| Param | Original file | Final file |
|---|---|---|
| Filename | modeM0/AS1A12_099T03_9000005570_40820cztM0_level2.fits | modeM0/AS1A12_099T03_9000005570_40820cztM0_level2_quad_clean.evt |
| Size (bytes) | 375,393,600 | 87,387,840 |
| Size | 358.0 MB | 83.3 MB |
| Events in quadrant A | 2,924,341 | 601,125 |
| Events in quadrant B | 2,405,511 | 619,932 |
| Events in quadrant C | 2,531,704 | 578,243 |
| Events in quadrant D | 5,623,067 | 477,168 |
| Mode M0 | |||
|---|---|---|---|
| Quadrant | BADHDUFLAG | Total packets | Discarded packets |
| A | 0 | 11887 | 3 |
| B | 0 | 10845 | 2 |
| C | 0 | 10949 | 2 |
| D | 0 | 20381 | 2 |
| Mode SS | |||
|---|---|---|---|
| Quadrant | BADHDUFLAG | Total packets | Discarded packets |
| A | 0 | 106 | 0 |
| B | 0 | 106 | 0 |
| C | 0 | 106 | 0 |
| D | 0 | 106 | 0 |
| Mode M9 | |||
|---|---|---|---|
| Quadrant | BADHDUFLAG | Total packets | Discarded packets |
| A | 0 | 27 | 0 |
| B | 0 | 27 | 0 |
| C | 0 | 27 | 0 |
| D | 0 | 28 | 0 |
| Quadrant | Total seconds | Saturated seconds | Saturation percentage |
|---|---|---|---|
| A | 5283 | 21 | 0.397501% |
| B | 5283 | 15 | 0.283930% |
| C | 5283 | 21 | 0.397501% |
| D | 5283 | 754 | 14.272194% |
Noise dominated data is calculated using 1-second bins in cleaned event files. If a bin has >2000 counts, and if more than 50% of those come from <1% of pixels, then it is considered to be noise-dominated and hence unusable.
| Quadrant | # 1 sec bins | Bins with >0 counts | Bins with >2000 counts | High rate bins dominated by noise | Noise dominated (total time) | Noise dominated (detector-on time) | Marked lightcurve |
|---|---|---|---|---|---|---|---|
| A | 7105 | 5284 | 11 | 11 | 0.15% | 0.21% | 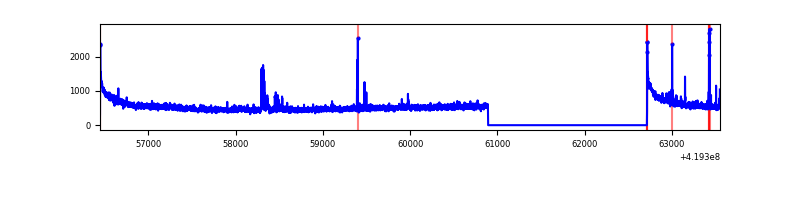 |
| B | 7105 | 5284 | 4 | 4 | 0.06% | 0.08% | 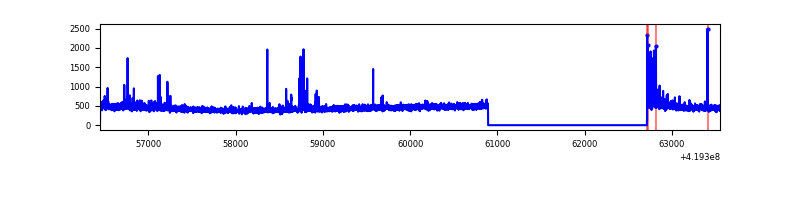 |
| C | 7105 | 5284 | 20 | 20 | 0.28% | 0.38% | 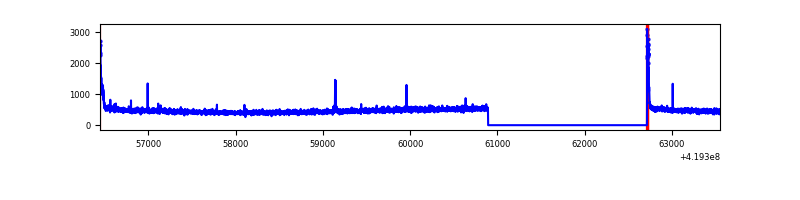 |
| D | 7105 | 5284 | 717 | 717 | 10.09% | 13.57% | 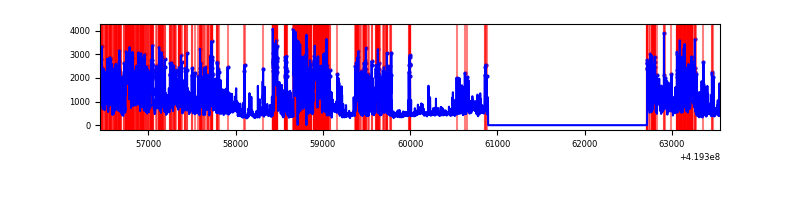 |
Top three noisy pixels from each quadrant. If the there are fewer than three noisy pixels in the level2.evt file, extra rows are filled as -1
| Pixel properties | Quadrant properties | ||||||
|---|---|---|---|---|---|---|---|
| Quadrant | DetID | PixID | Counts | Sigma | Mean | Median | Sigma |
| A | 10 | 83 | 514785 | 4270.78 | 583 | 572 | 120.4 |
| A | 2 | 79 | 45121 | 370.0 | 583 | 572 | 120.4 |
| A | 6 | 10 | 35952 | 293.84 | 583 | 572 | 120.4 |
| B | 0 | 190 | 89441 | 778.45 | 584 | 569 | 114.2 |
| B | 5 | 255 | 17445 | 147.82 | 584 | 569 | 114.2 |
| B | 12 | 111 | 14178 | 119.2 | 584 | 569 | 114.2 |
| C | 15 | 214 | 225729 | 1702.56 | 563 | 569 | 132.2 |
| C | 0 | 10 | 87051 | 653.94 | 563 | 569 | 132.2 |
| C | 1 | 241 | 12917 | 93.37 | 563 | 569 | 132.2 |
| D | 1 | 47 | 1143364 | 8965.84 | 525 | 511 | 127.5 |
| D | 2 | 153 | 852306 | 6682.45 | 525 | 511 | 127.5 |
| D | 12 | 79 | 684136 | 5363.13 | 525 | 511 | 127.5 |
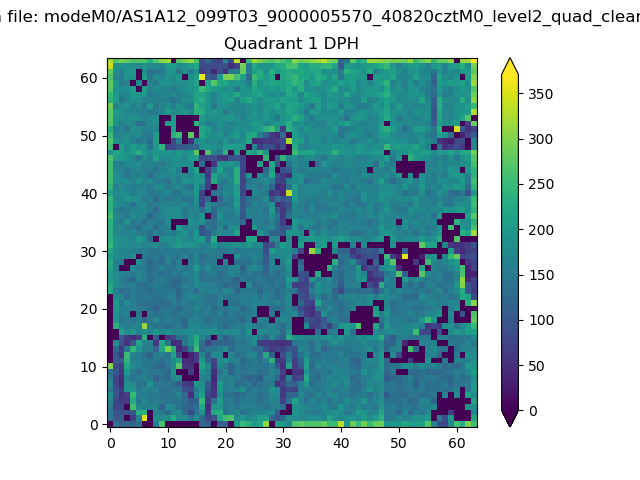
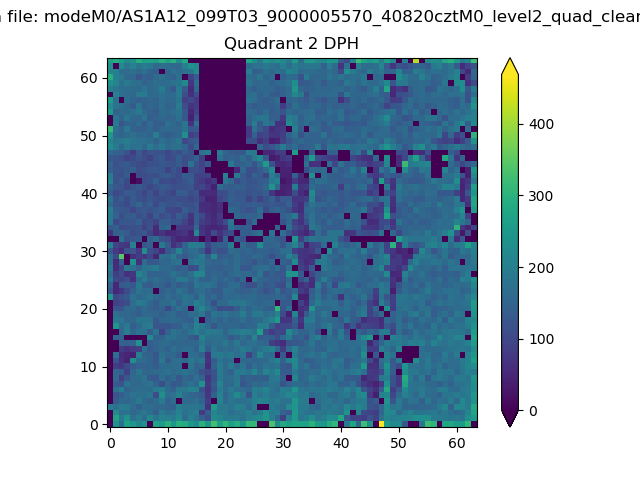
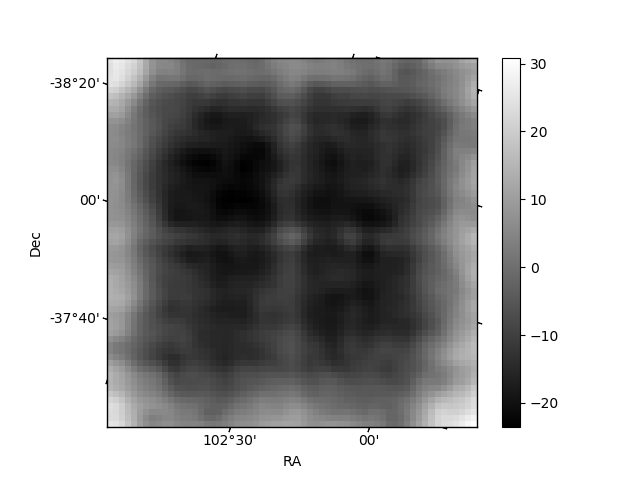
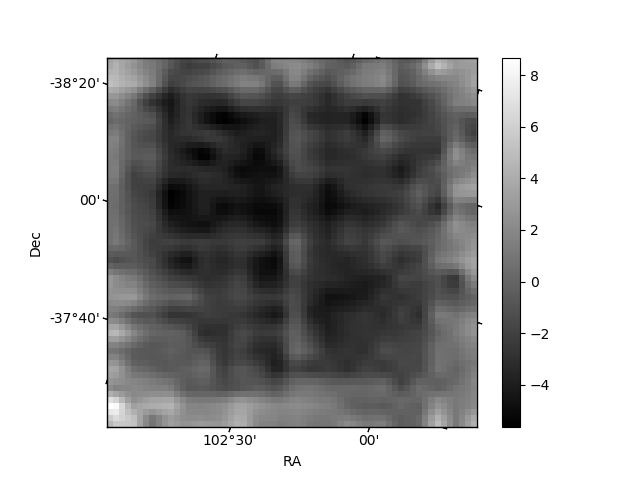
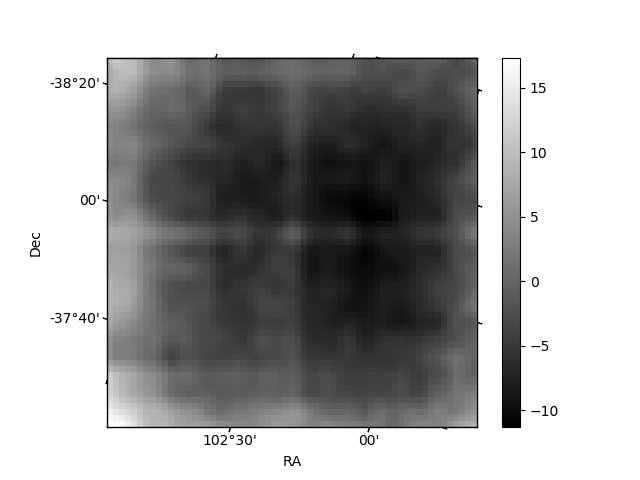
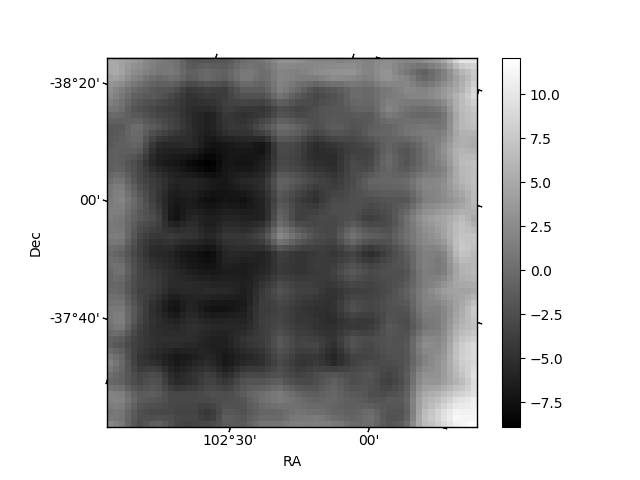
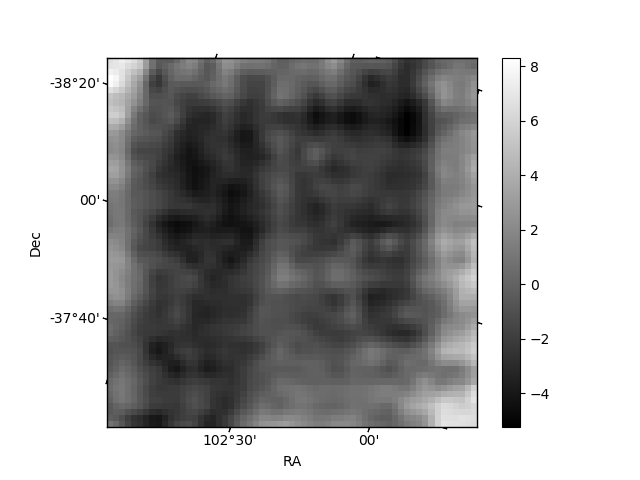
Histogram calculated using DETX and DETY for each event in the final _common_clean file
| Quadrant A |  |
 |
Quadrant B |
|---|---|---|---|
| Quadrant D | 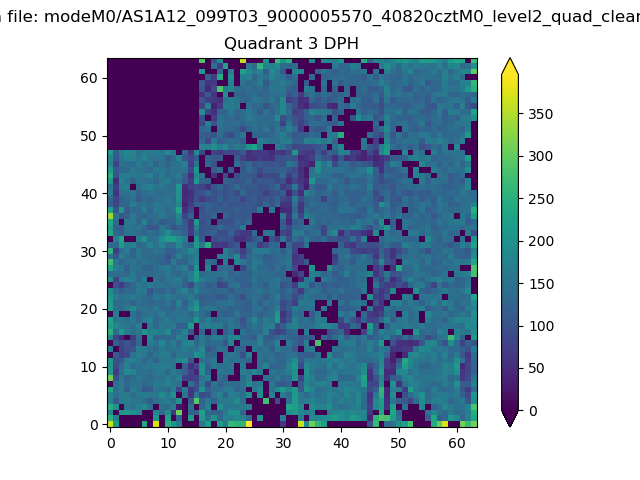 |
 |
Quadrant C |
| Plot type | Count rate plots | Images |
|---|---|---|
| Comparison with Poisson distribution Blue bars denote a histogram of data divided into 1 sec bins. Red curve is a Poisson curve with rate = median count rate of data. |
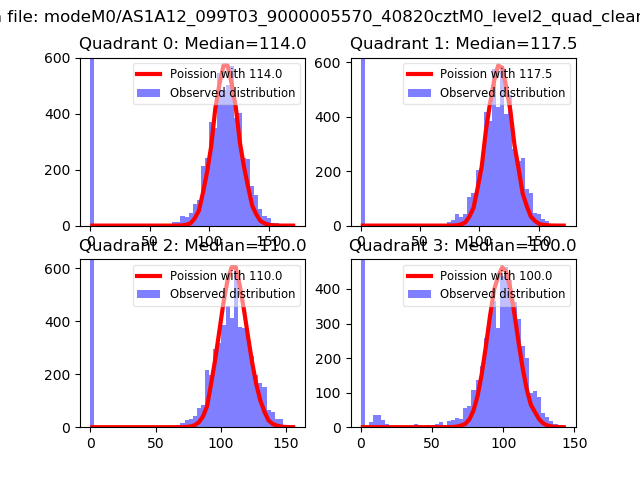 |
 |
| Quadrant-wise count rates Data is divided into 100 sec bins |
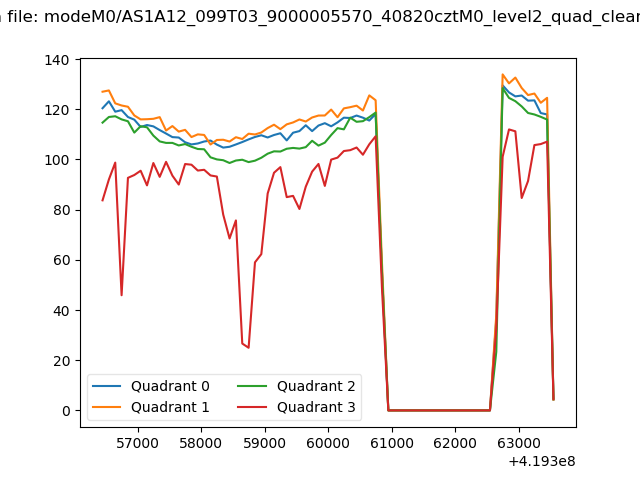 |
|
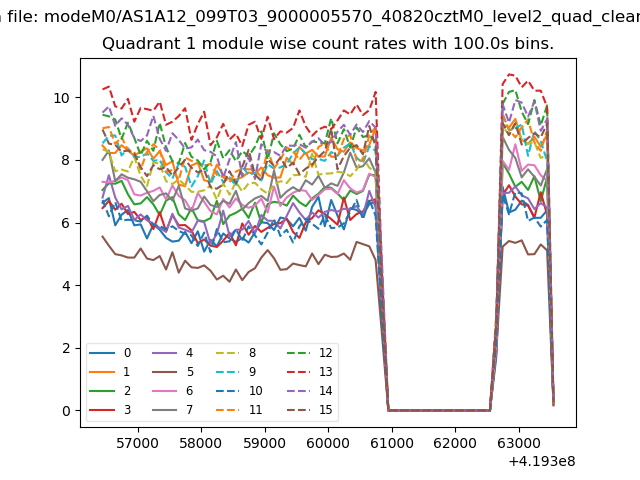
| Module-wise count rates for Quadrant A Data is divided into 100 sec bins |
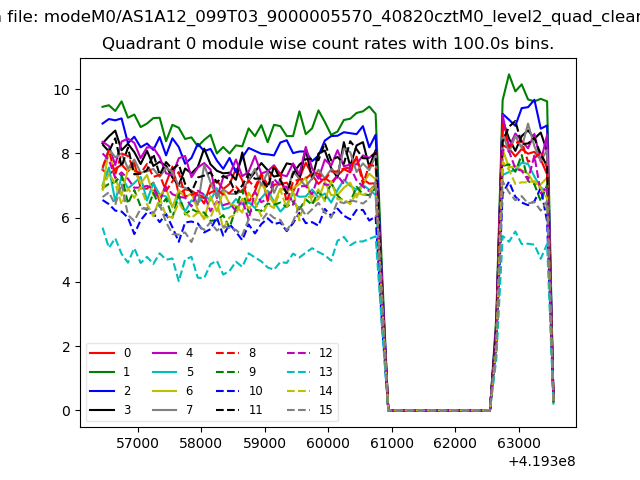 |
 |
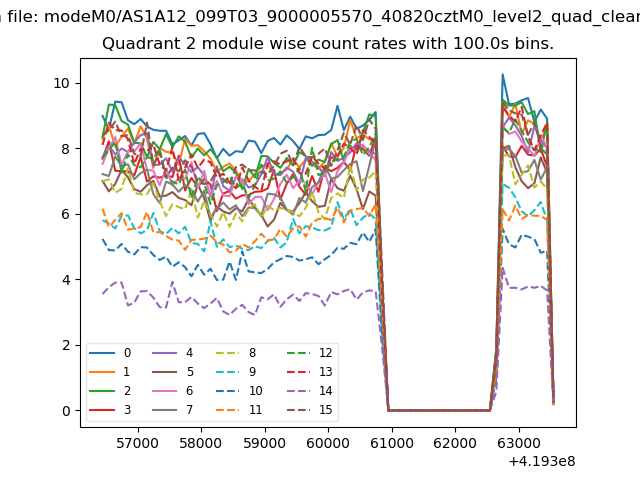
| Module-wise count rates for Quadrant B Data is divided into 100 sec bins |
 |
 |
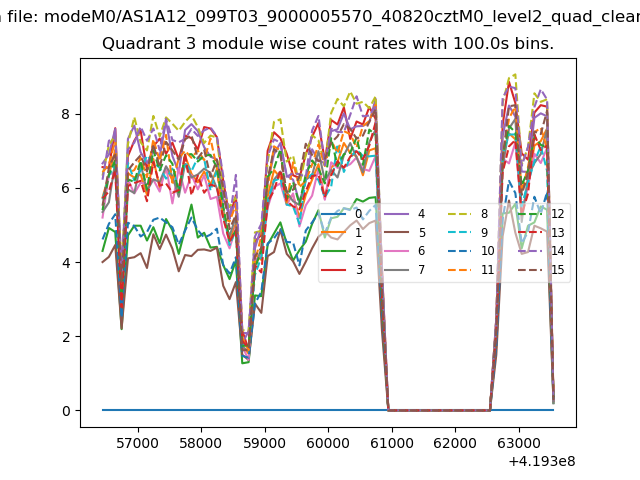
| Module-wise count rates for Quadrant C Data is divided into 100 sec bins |
 |
 |
| Module-wise count rates for Quadrant D Data is divided into 100 sec bins |
 |
 |
| Parameter | Plot |
|---|---|
| CZT HV Monitor | 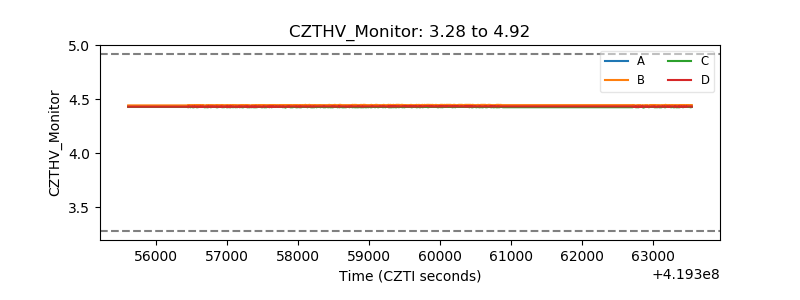 |
| D_VDD | 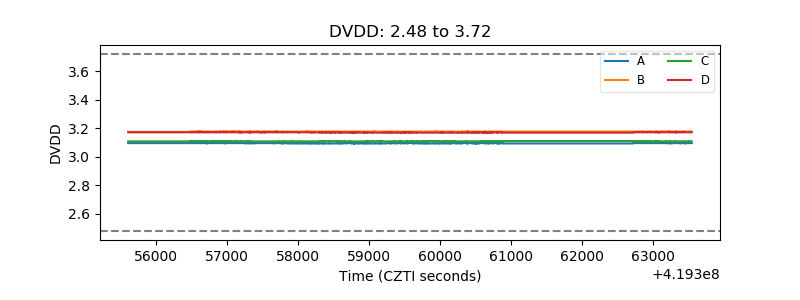 |
| Temperature 1 | 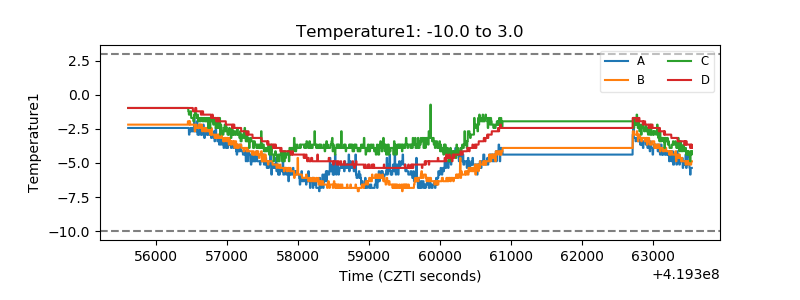 |
| Veto HV Monitor | 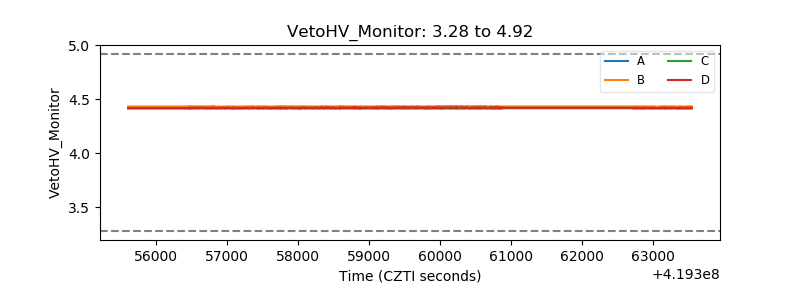 |
| Veto LLD | 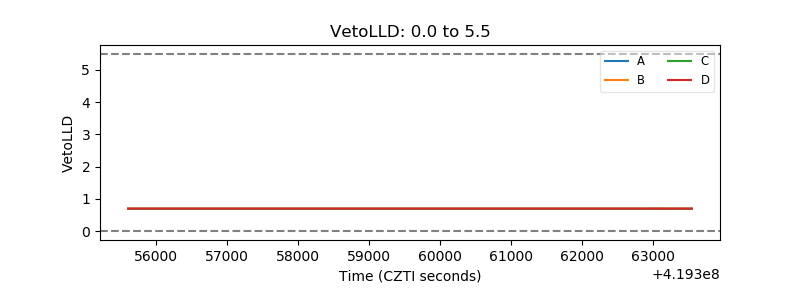 |
| Alpha Counter | 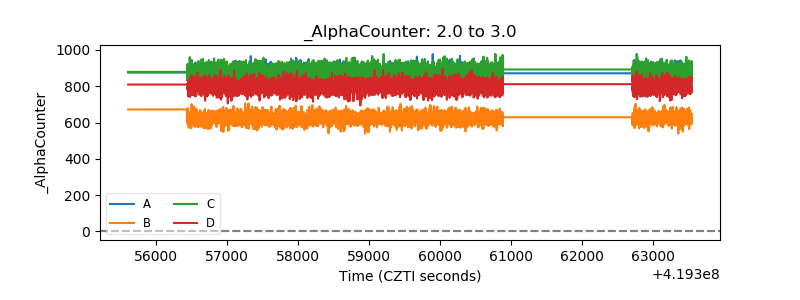 |
| _CPM_Rate | 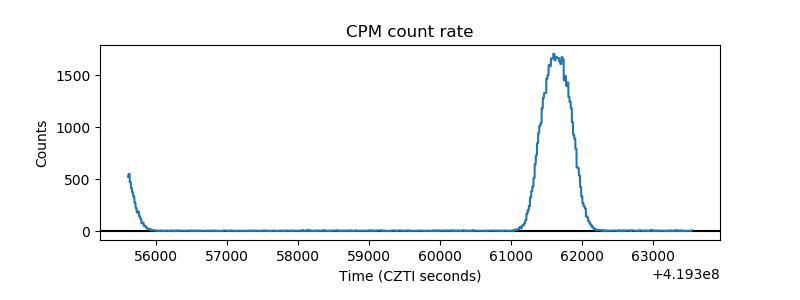 |
| CZT Counter | 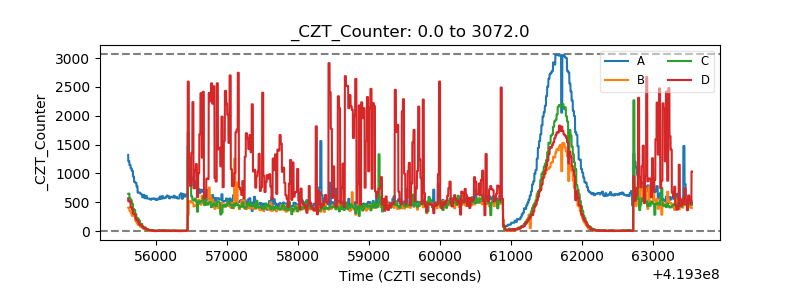 |
| +2.5 Volts monitor | 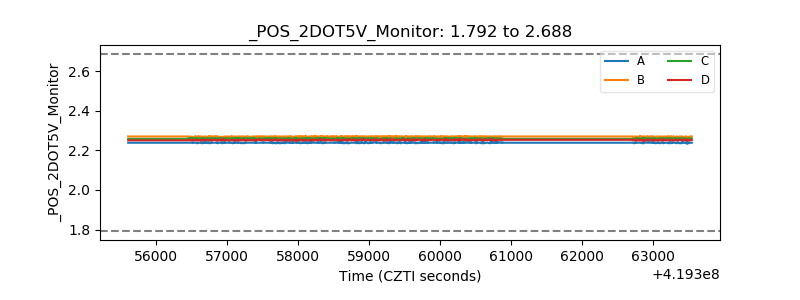 |
| +5 Volts monitor | 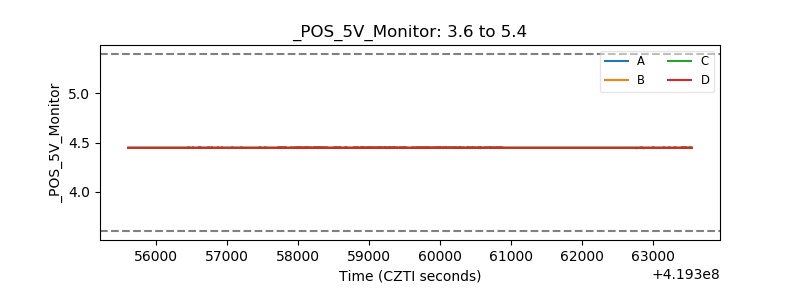 |
| _ROLL_ROT | 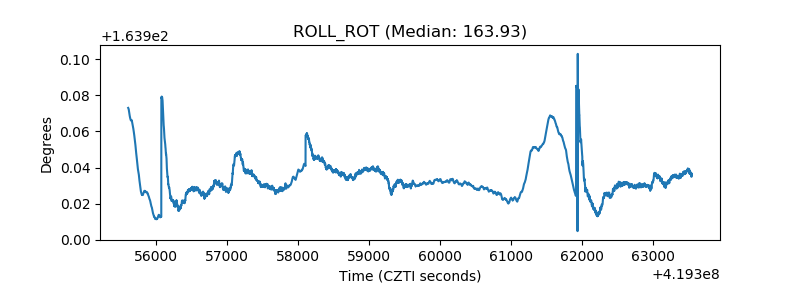 |
| _Roll_DEC | 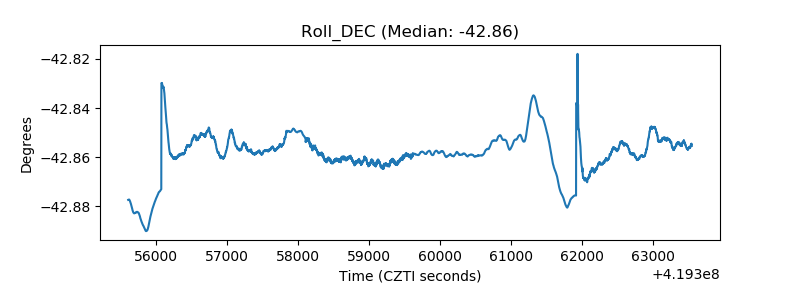 |
| _Roll_RA | 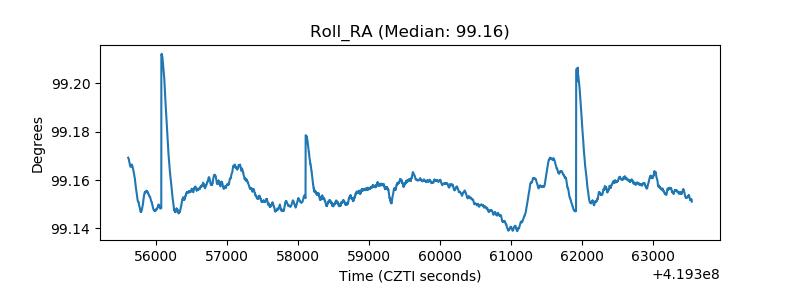 |
| Veto Counter | 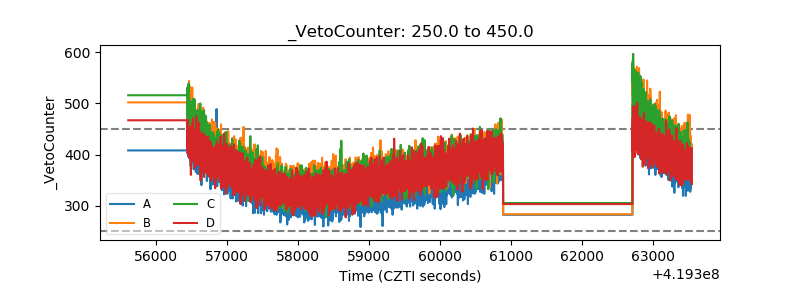 |