| Param | Original file | Final file |
|---|---|---|
| Filename | modeM0/AS1A12_099T03_9000005570_40821cztM0_level2.fits | modeM0/AS1A12_099T03_9000005570_40821cztM0_level2_quad_clean.evt |
| Size (bytes) | 94,717,440 | 21,075,840 |
| Size | 90.3 MB | 20.1 MB |
| Events in quadrant A | 770,310 | 144,727 |
| Events in quadrant B | 581,292 | 149,440 |
| Events in quadrant C | 601,716 | 139,911 |
| Events in quadrant D | 1,456,861 | 114,389 |
| Mode M0 | |||
|---|---|---|---|
| Quadrant | BADHDUFLAG | Total packets | Discarded packets |
| A | 0 | 3048 | 1 |
| B | 0 | 2546 | 1 |
| C | 0 | 2546 | 1 |
| D | 0 | 5175 | 1 |
| Mode SS | |||
|---|---|---|---|
| Quadrant | BADHDUFLAG | Total packets | Discarded packets |
| A | 0 | 22 | 0 |
| B | 0 | 22 | 0 |
| C | 0 | 22 | 0 |
| D | 0 | 22 | 0 |
| Mode M9 | |||
|---|---|---|---|
| Quadrant | BADHDUFLAG | Total packets | Discarded packets |
| A | 0 | 8 | 0 |
| B | 0 | 8 | 0 |
| C | 0 | 8 | 0 |
| D | 0 | 9 | 0 |
| Quadrant | Total seconds | Saturated seconds | Saturation percentage |
|---|---|---|---|
| A | 1194 | 12 | 1.005025% |
| B | 1194 | 12 | 1.005025% |
| C | 1194 | 15 | 1.256281% |
| D | 1194 | 192 | 16.080402% |
Noise dominated data is calculated using 1-second bins in cleaned event files. If a bin has >2000 counts, and if more than 50% of those come from <1% of pixels, then it is considered to be noise-dominated and hence unusable.
| Quadrant | # 1 sec bins | Bins with >0 counts | Bins with >2000 counts | High rate bins dominated by noise | Noise dominated (total time) | Noise dominated (detector-on time) | Marked lightcurve |
|---|---|---|---|---|---|---|---|
| A | 1194 | 1194 | 8 | 8 | 0.67% | 0.67% | 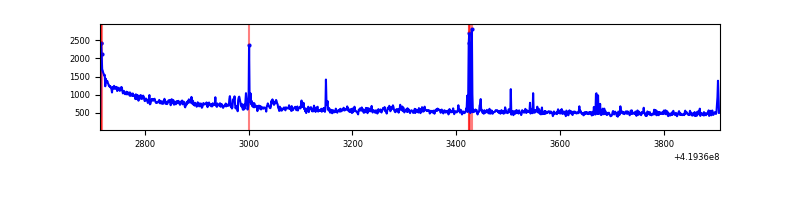 |
| B | 1194 | 1194 | 4 | 4 | 0.34% | 0.34% | 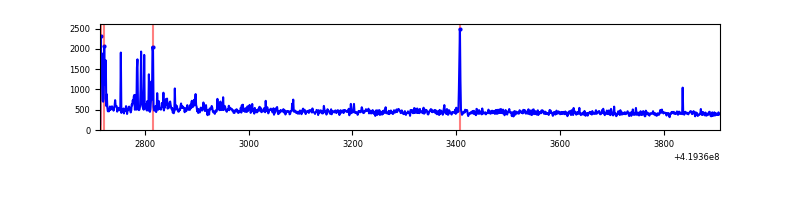 |
| C | 1194 | 1194 | 16 | 16 | 1.34% | 1.34% | 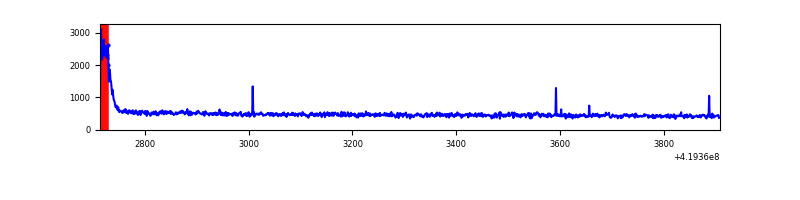 |
| D | 1194 | 1194 | 209 | 209 | 17.50% | 17.50% | 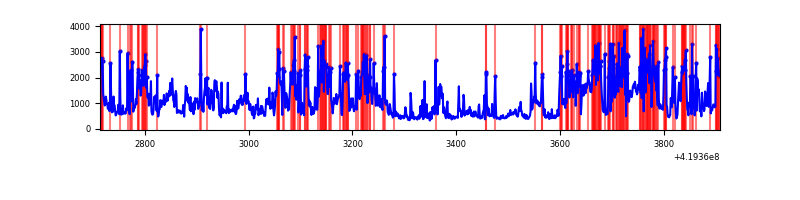 |
Top three noisy pixels from each quadrant. If the there are fewer than three noisy pixels in the level2.evt file, extra rows are filled as -1
| Pixel properties | Quadrant properties | ||||||
|---|---|---|---|---|---|---|---|
| Quadrant | DetID | PixID | Counts | Sigma | Mean | Median | Sigma |
| A | 10 | 83 | 177234 | 6104.95 | 133 | 131 | 29.0 |
| A | 6 | 10 | 31660 | 1086.84 | 133 | 131 | 29.0 |
| A | 2 | 79 | 24540 | 841.41 | 133 | 131 | 29.0 |
| B | 0 | 190 | 33484 | 1193.19 | 134 | 131 | 28.0 |
| B | 5 | 255 | 13449 | 476.45 | 134 | 131 | 28.0 |
| B | 0 | 230 | 6238 | 218.48 | 134 | 131 | 28.0 |
| C | 15 | 214 | 53927 | 1728.31 | 126 | 127 | 31.1 |
| C | 0 | 10 | 46924 | 1503.34 | 126 | 127 | 31.1 |
| C | 3 | 233 | 2398 | 72.96 | 126 | 127 | 31.1 |
| D | 1 | 47 | 609959 | 19872.0 | 118 | 114 | 30.7 |
| D | 12 | 79 | 202080 | 6581.13 | 118 | 114 | 30.7 |
| D | 12 | 233 | 74326 | 2418.22 | 118 | 114 | 30.7 |
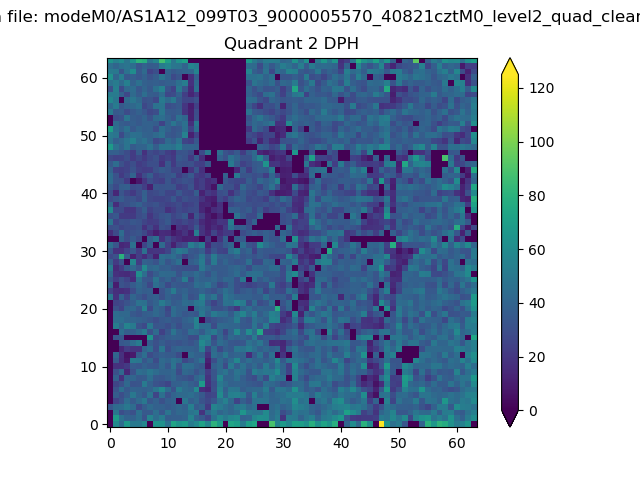
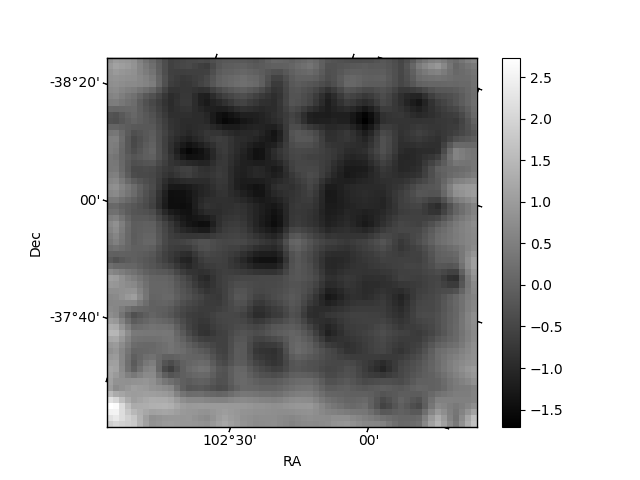
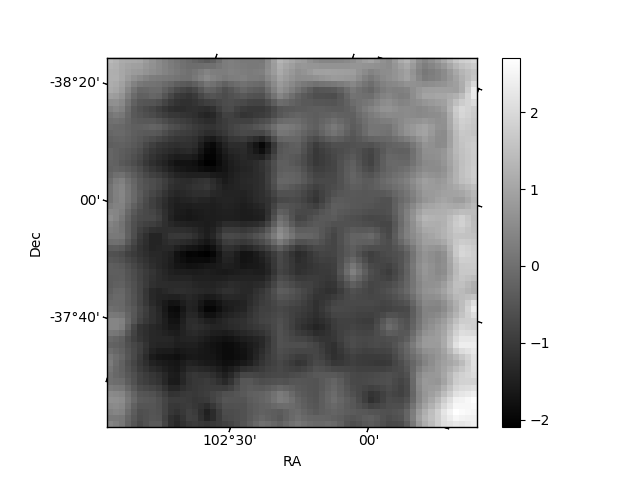
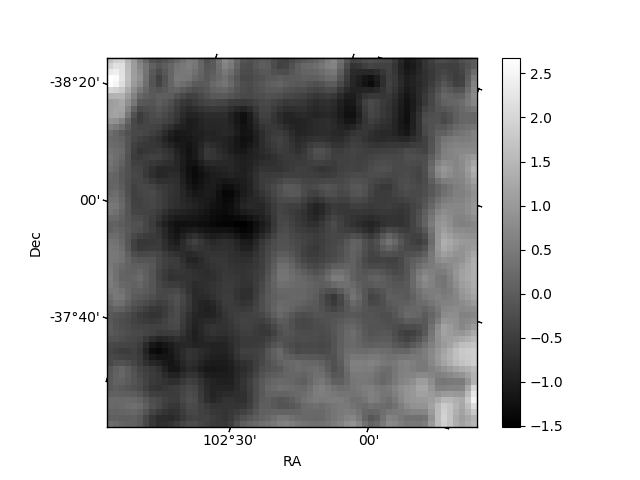
Histogram calculated using DETX and DETY for each event in the final _common_clean file
| Quadrant A | 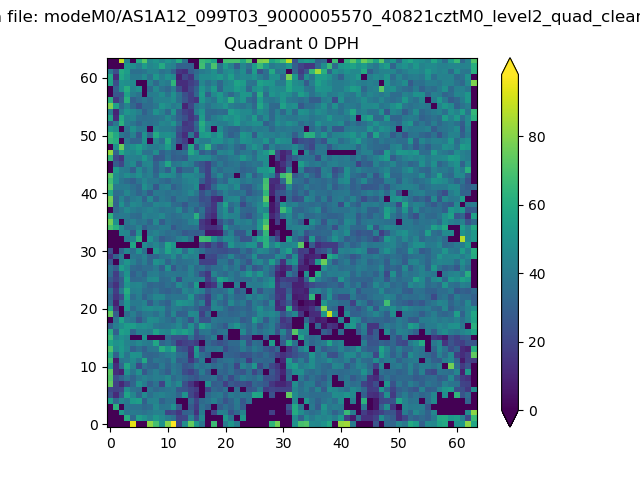 |
 |
Quadrant B |
|---|---|---|---|
| Quadrant D |  |
 |
Quadrant C |
| Plot type | Count rate plots | Images |
|---|---|---|
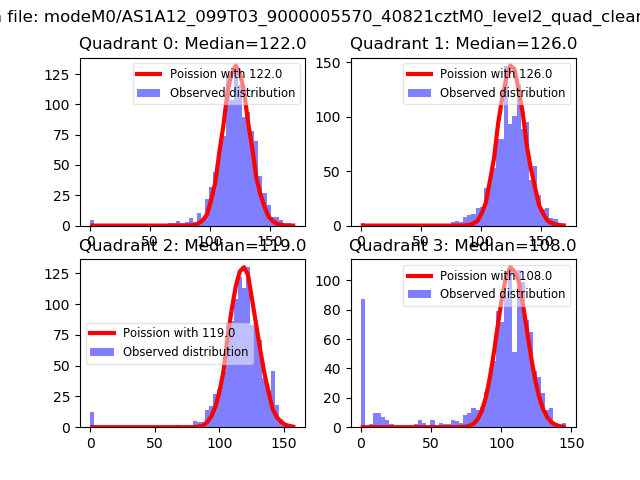
| Comparison with Poisson distribution Blue bars denote a histogram of data divided into 1 sec bins. Red curve is a Poisson curve with rate = median count rate of data. |
 |
 |
| Quadrant-wise count rates Data is divided into 100 sec bins |
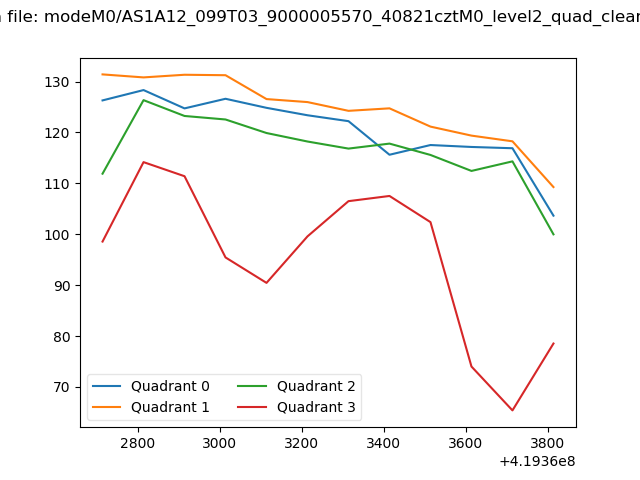 |
|
| Module-wise count rates for Quadrant A Data is divided into 100 sec bins |
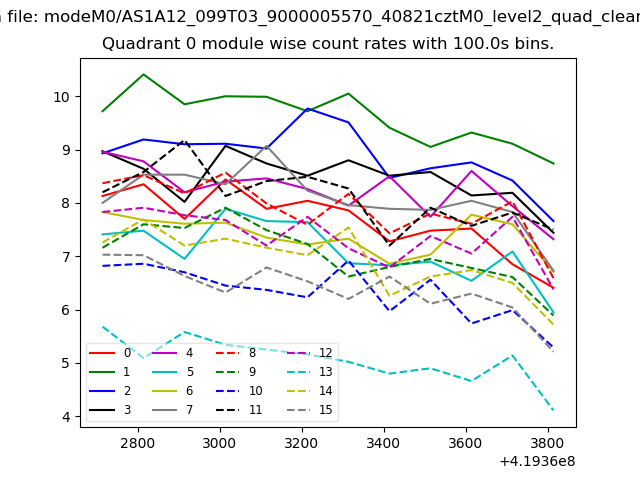 |
 |
| Module-wise count rates for Quadrant B Data is divided into 100 sec bins |
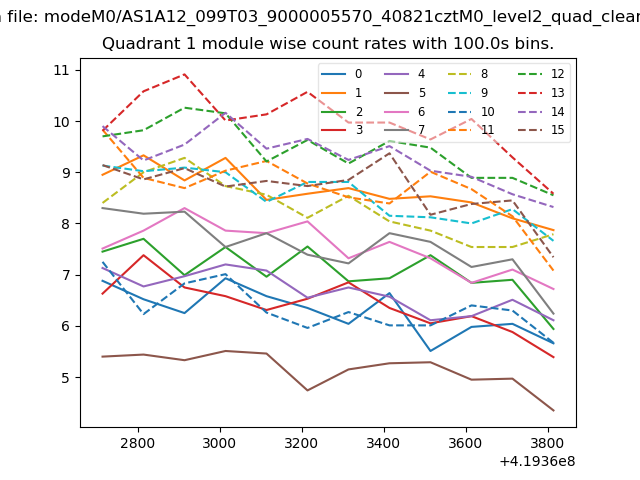 |
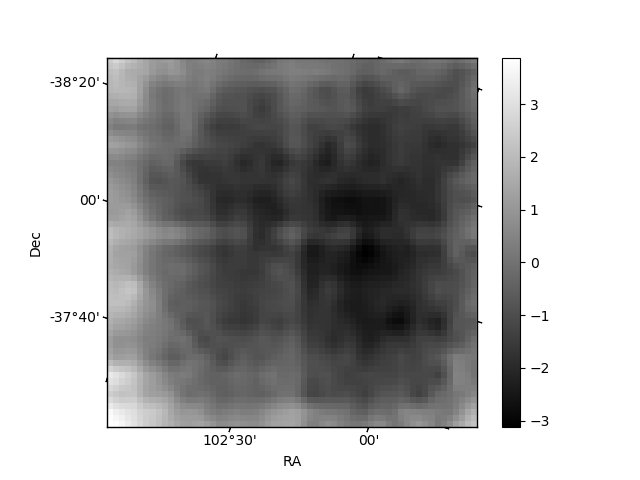 |
| Module-wise count rates for Quadrant C Data is divided into 100 sec bins |
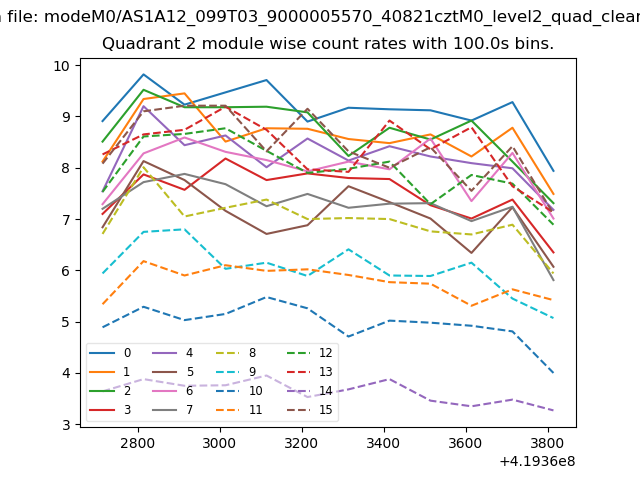 |
 |
| Module-wise count rates for Quadrant D Data is divided into 100 sec bins |
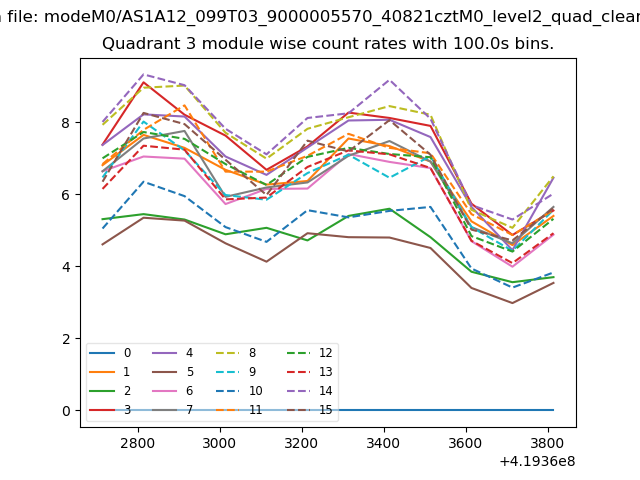 |
 |
| Parameter | Plot |
|---|---|
| CZT HV Monitor |  |
| D_VDD | 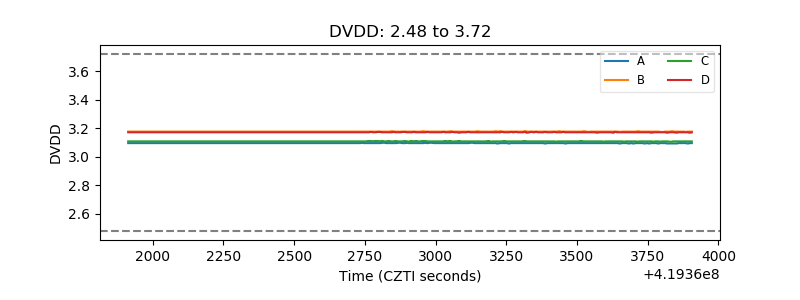 |
| Temperature 1 | 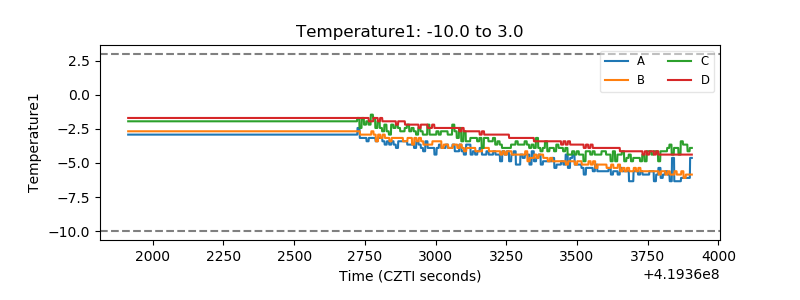 |
| Veto HV Monitor | 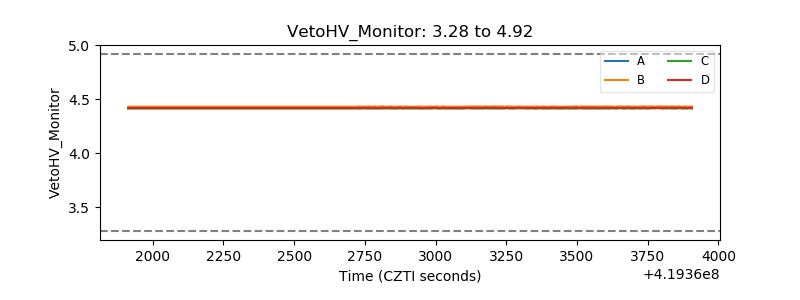 |
| Veto LLD | 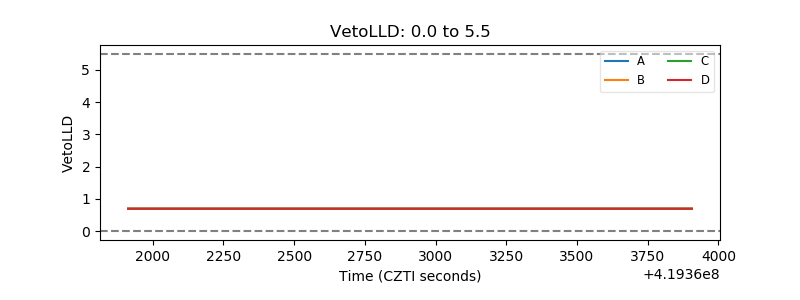 |
| Alpha Counter | 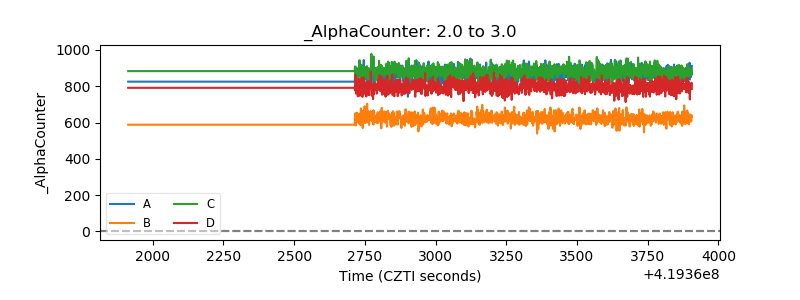 |
| _CPM_Rate | 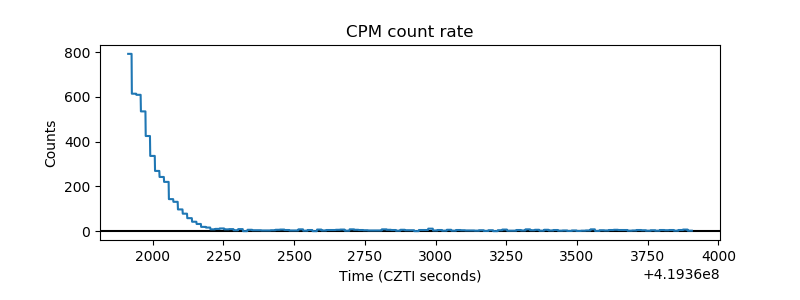 |
| CZT Counter | 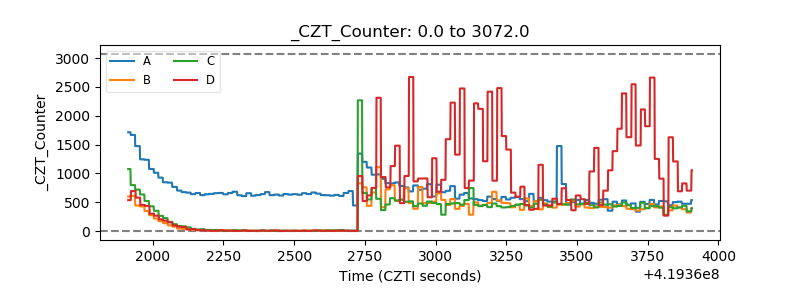 |
| +2.5 Volts monitor |  |
| +5 Volts monitor | 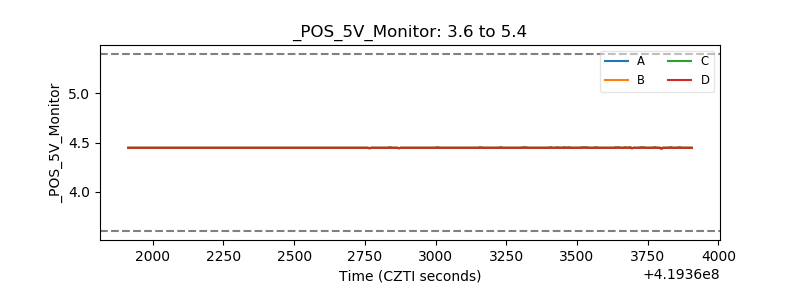 |
| _ROLL_ROT | 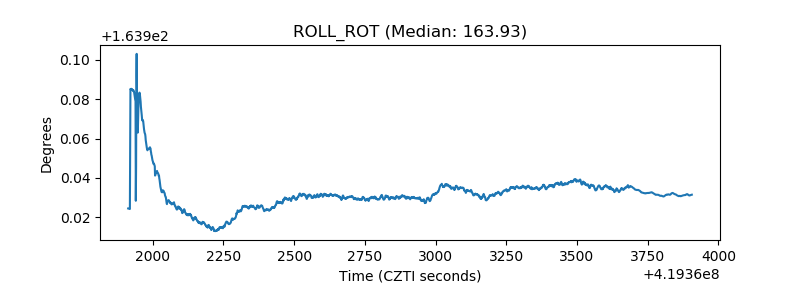 |
| _Roll_DEC | 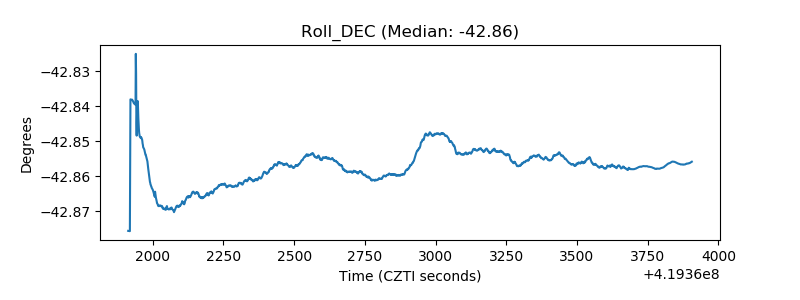 |
| _Roll_RA | 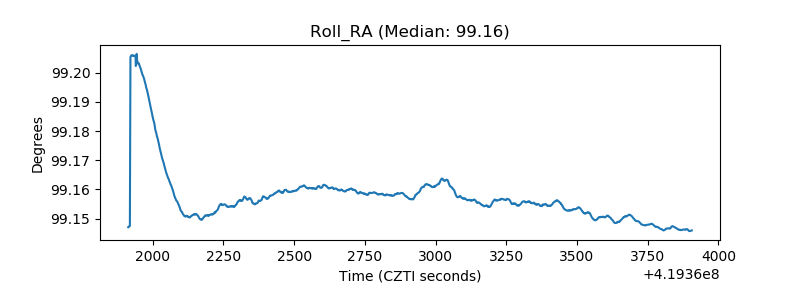 |
| Veto Counter | 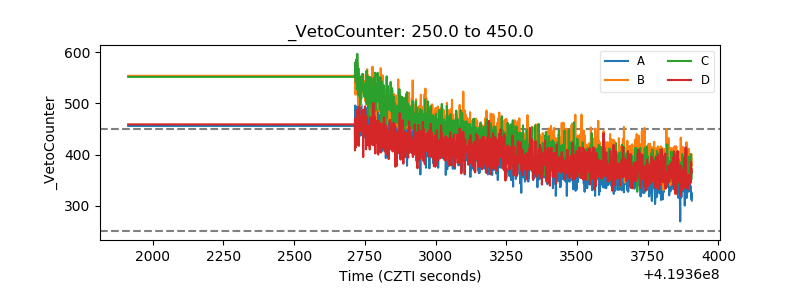 |