| Param | Original file | Final file |
|---|---|---|
| Filename | modeM0/AS1A12_104T02_9000005572_40821cztM0_level2.fits | modeM0/AS1A12_104T02_9000005572_40821cztM0_level2_quad_clean.evt |
| Size (bytes) | 205,444,800 | 54,276,480 |
| Size | 195.9 MB | 51.8 MB |
| Events in quadrant A | 1,824,287 | 368,107 |
| Events in quadrant B | 1,453,321 | 379,911 |
| Events in quadrant C | 1,554,103 | 358,276 |
| Events in quadrant D | 2,527,717 | 314,577 |
| Mode M9 | |||
|---|---|---|---|
| Quadrant | BADHDUFLAG | Total packets | Discarded packets |
| A | 0 | 19 | 0 |
| B | 0 | 19 | 0 |
| C | 0 | 19 | 0 |
| D | 0 | 19 | 0 |
| Mode M0 | |||
|---|---|---|---|
| Quadrant | BADHDUFLAG | Total packets | Discarded packets |
| A | 0 | 7308 | 2 |
| B | 0 | 6358 | 1 |
| C | 0 | 6492 | 1 |
| D | 0 | 9695 | 1 |
| Mode SS | |||
|---|---|---|---|
| Quadrant | BADHDUFLAG | Total packets | Discarded packets |
| A | 0 | 62 | 0 |
| B | 0 | 62 | 0 |
| C | 0 | 62 | 0 |
| D | 0 | 62 | 0 |
| Quadrant | Total seconds | Saturated seconds | Saturation percentage |
|---|---|---|---|
| A | 3133 | 14 | 0.446856% |
| B | 3133 | 11 | 0.351101% |
| C | 3133 | 16 | 0.510693% |
| D | 3133 | 202 | 6.447494% |
Noise dominated data is calculated using 1-second bins in cleaned event files. If a bin has >2000 counts, and if more than 50% of those come from <1% of pixels, then it is considered to be noise-dominated and hence unusable.
| Quadrant | # 1 sec bins | Bins with >0 counts | Bins with >2000 counts | High rate bins dominated by noise | Noise dominated (total time) | Noise dominated (detector-on time) | Marked lightcurve |
|---|---|---|---|---|---|---|---|
| A | 5075 | 3134 | 9 | 9 | 0.18% | 0.29% | 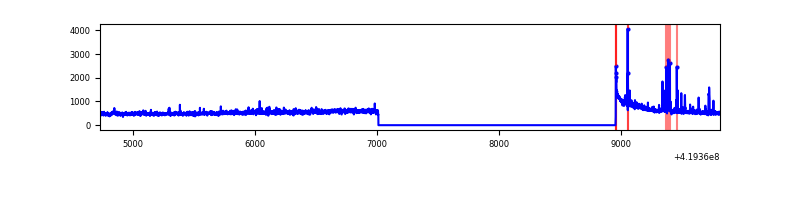 |
| B | 5075 | 3134 | 1 | 1 | 0.02% | 0.03% | 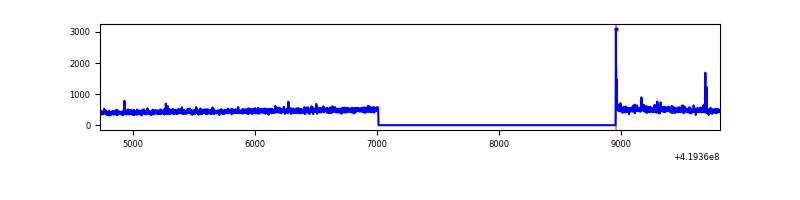 |
| C | 5075 | 3134 | 17 | 17 | 0.33% | 0.54% | 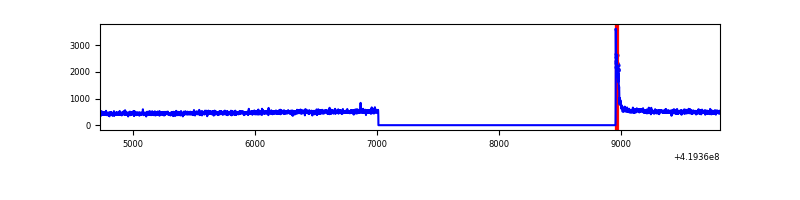 |
| D | 5075 | 3134 | 229 | 229 | 4.51% | 7.31% | 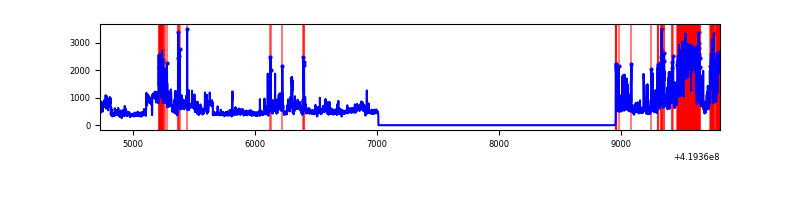 |
Top three noisy pixels from each quadrant. If the there are fewer than three noisy pixels in the level2.evt file, extra rows are filled as -1
| Pixel properties | Quadrant properties | ||||||
|---|---|---|---|---|---|---|---|
| Quadrant | DetID | PixID | Counts | Sigma | Mean | Median | Sigma |
| A | 10 | 83 | 278794 | 3714.45 | 360 | 353 | 75.0 |
| A | 13 | 248 | 50678 | 671.34 | 360 | 353 | 75.0 |
| A | 15 | 191 | 42890 | 567.45 | 360 | 353 | 75.0 |
| B | 0 | 190 | 24025 | 336.8 | 360 | 351 | 70.3 |
| B | 12 | 111 | 8956 | 122.42 | 360 | 351 | 70.3 |
| B | 11 | 111 | 8141 | 110.83 | 360 | 351 | 70.3 |
| C | 15 | 214 | 132118 | 1594.5 | 349 | 351 | 82.6 |
| C | 0 | 10 | 53152 | 638.94 | 349 | 351 | 82.6 |
| C | 13 | 61 | 2338 | 24.04 | 349 | 351 | 82.6 |
| D | 12 | 79 | 321695 | 3795.39 | 338 | 329 | 84.7 |
| D | 1 | 47 | 309604 | 3652.59 | 338 | 329 | 84.7 |
| D | 13 | 249 | 218838 | 2580.63 | 338 | 329 | 84.7 |
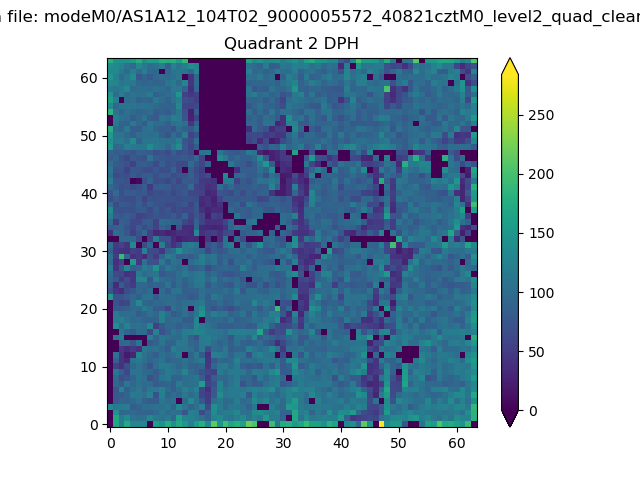
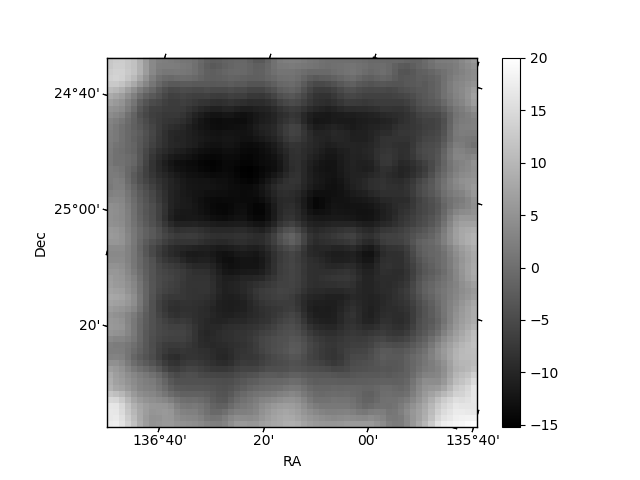
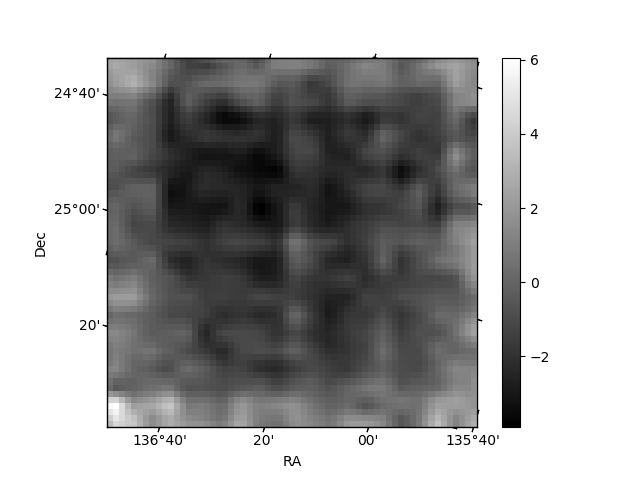
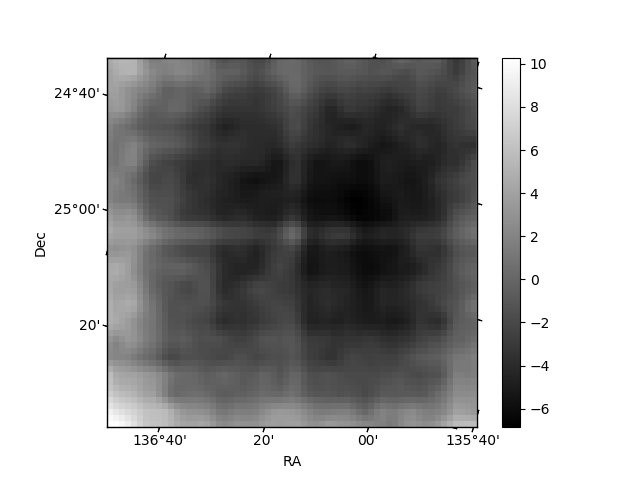
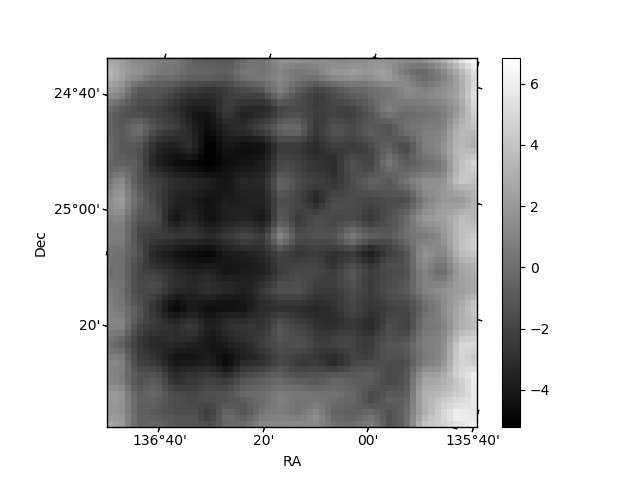
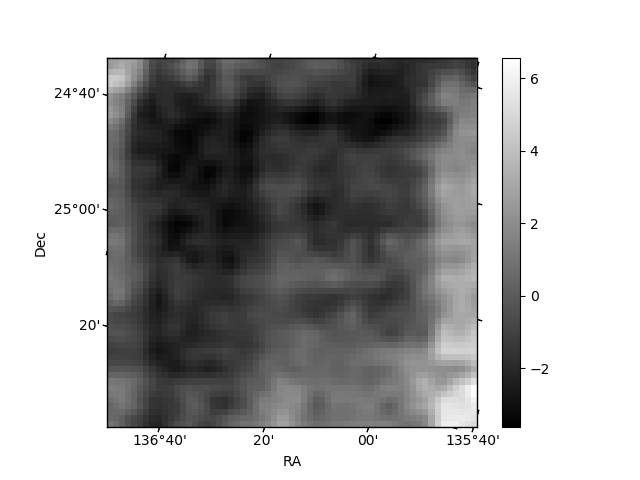
Histogram calculated using DETX and DETY for each event in the final _common_clean file
| Quadrant A | 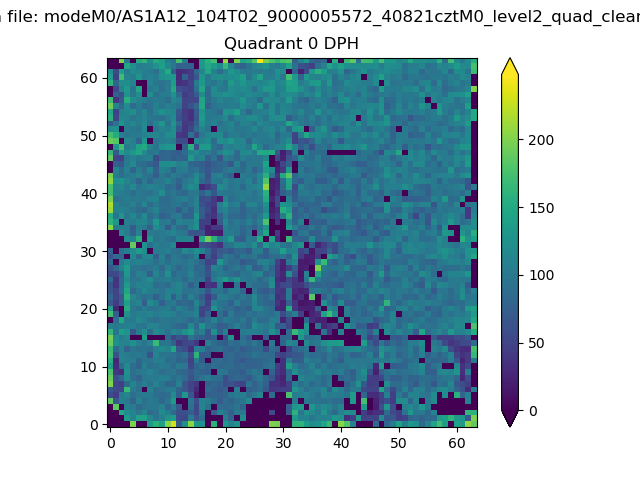 |
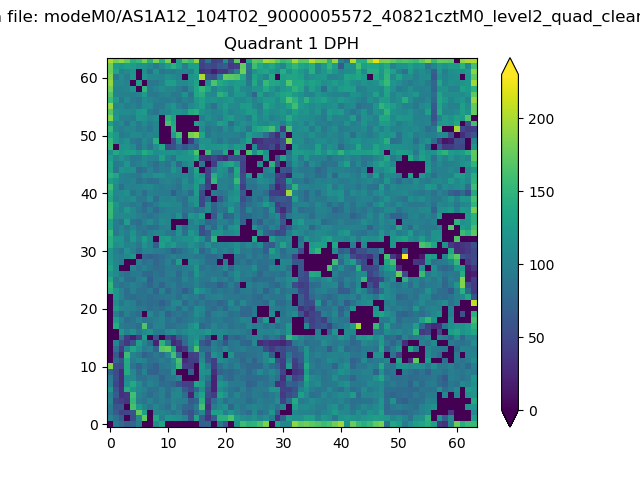 |
Quadrant B |
|---|---|---|---|
| Quadrant D | 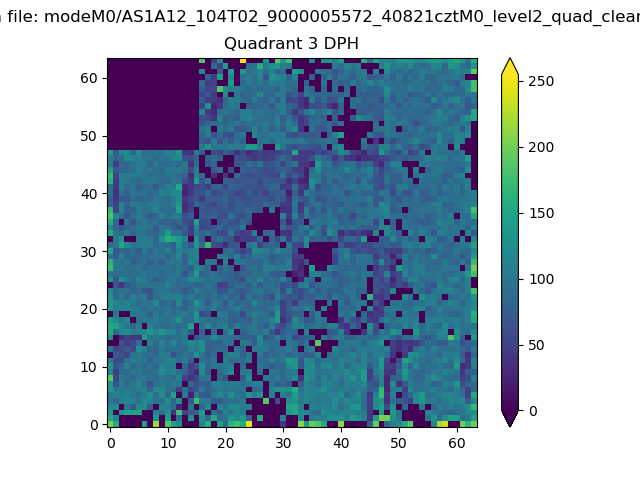 |
 |
Quadrant C |
| Plot type | Count rate plots | Images |
|---|---|---|
| Comparison with Poisson distribution Blue bars denote a histogram of data divided into 1 sec bins. Red curve is a Poisson curve with rate = median count rate of data. |
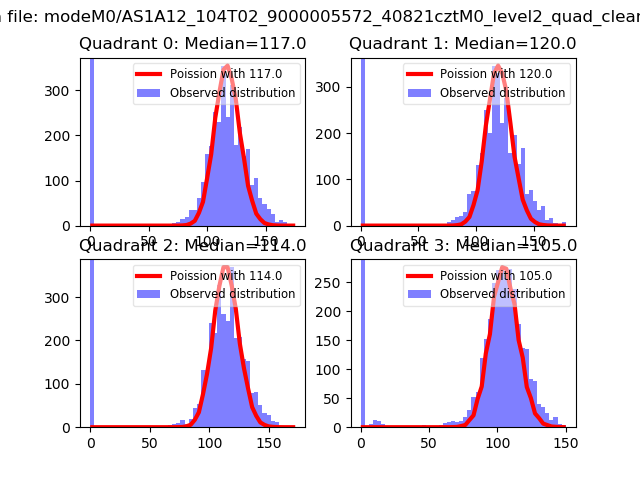 |
 |
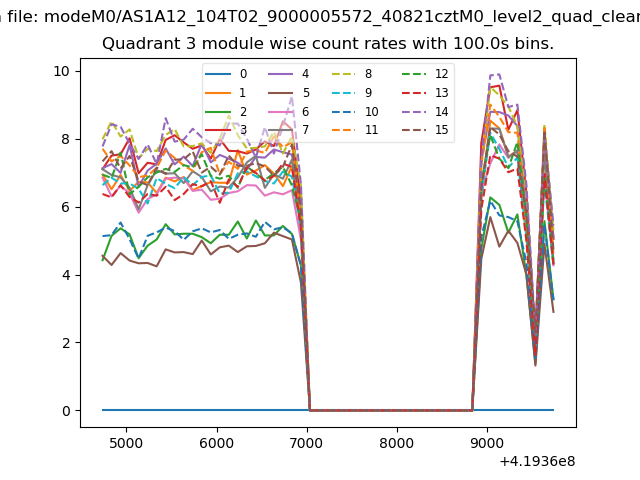
| Quadrant-wise count rates Data is divided into 100 sec bins |
 |
|
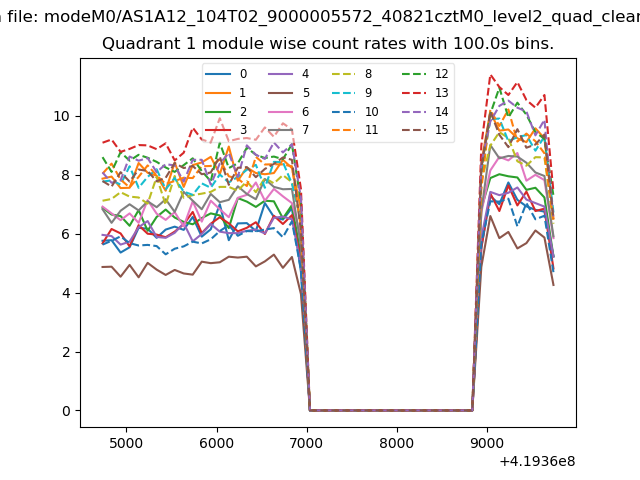
| Module-wise count rates for Quadrant A Data is divided into 100 sec bins |
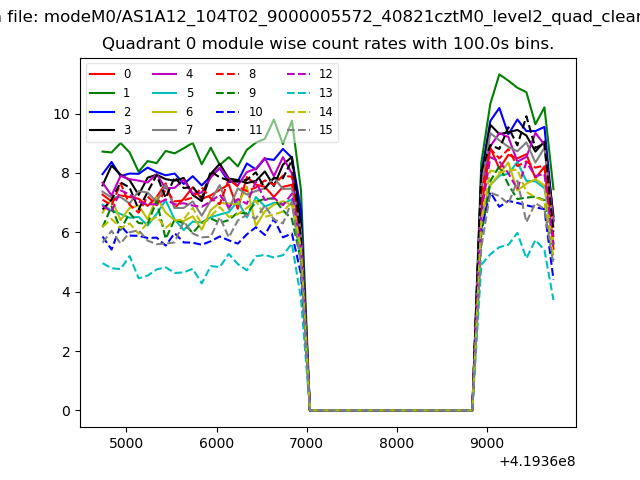 |
 |
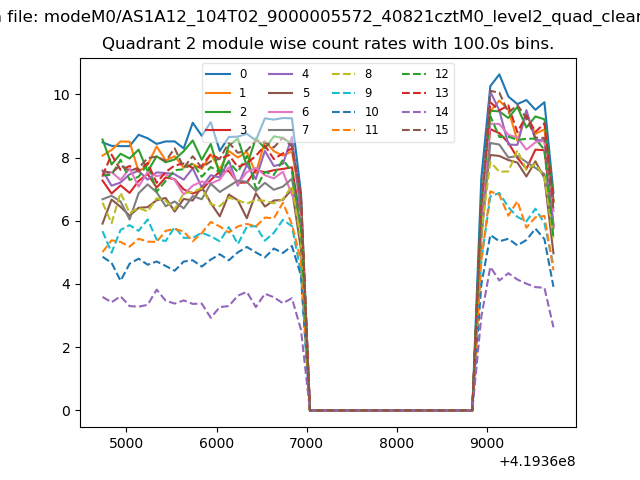
| Module-wise count rates for Quadrant B Data is divided into 100 sec bins |
 |
 |
| Module-wise count rates for Quadrant C Data is divided into 100 sec bins |
 |
 |
| Module-wise count rates for Quadrant D Data is divided into 100 sec bins |
 |
 |
| Parameter | Plot |
|---|---|
| CZT HV Monitor | 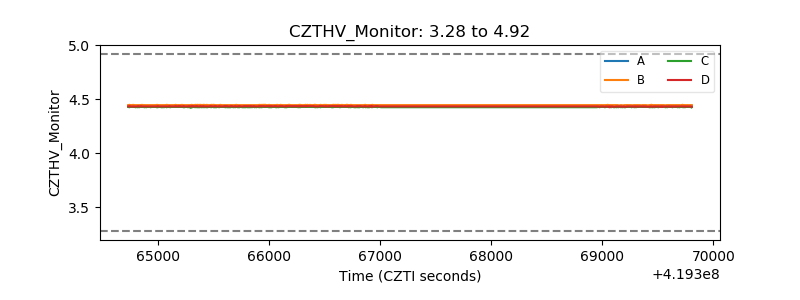 |
| D_VDD | 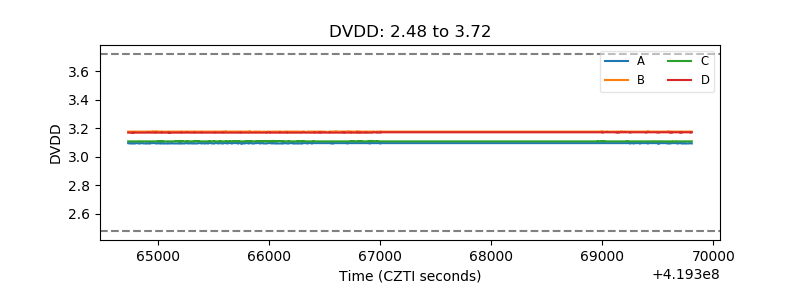 |
| Temperature 1 | 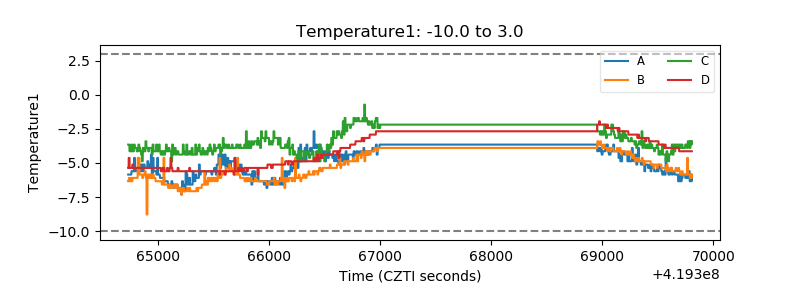 |
| Veto HV Monitor | 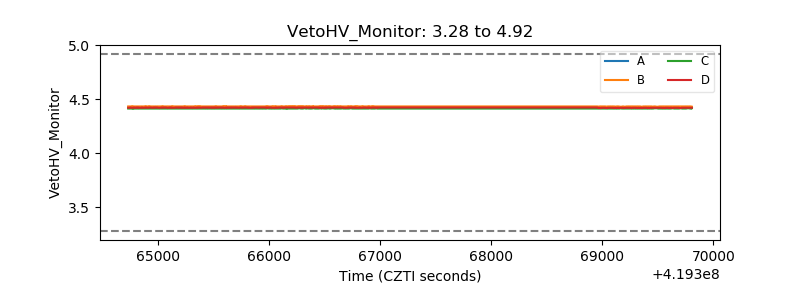 |
| Veto LLD | 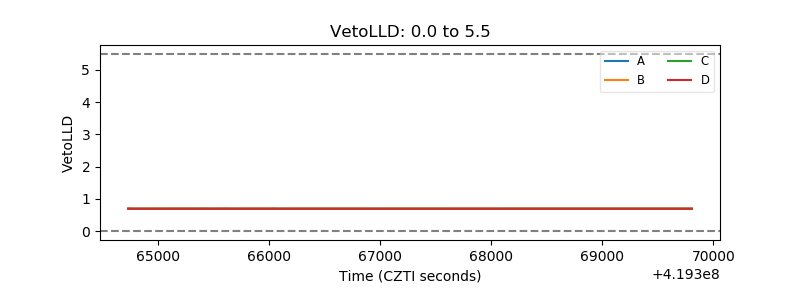 |
| Alpha Counter |  |
| _CPM_Rate | 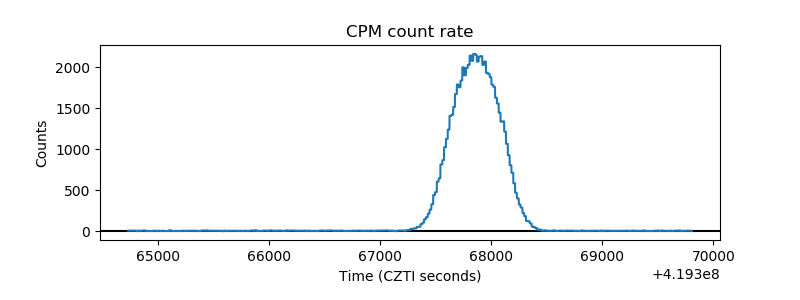 |
| CZT Counter | 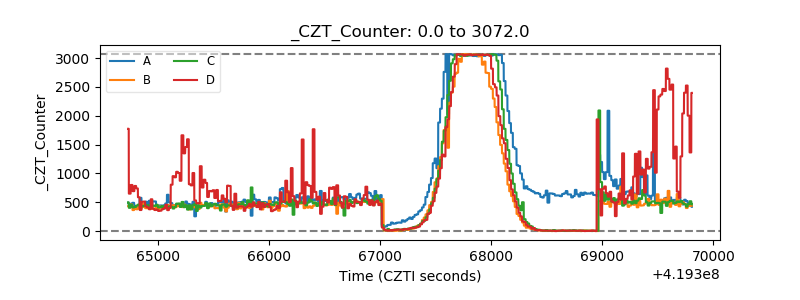 |
| +2.5 Volts monitor | 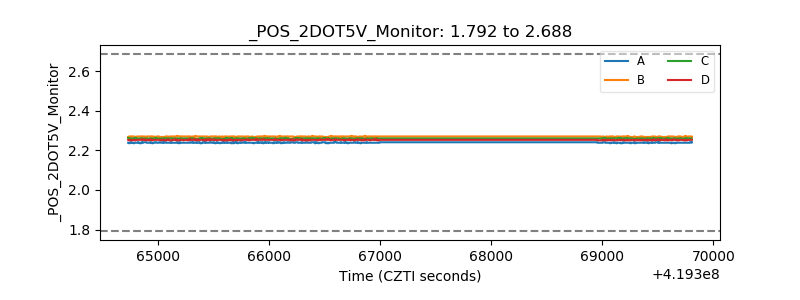 |
| +5 Volts monitor |  |
| _ROLL_ROT | 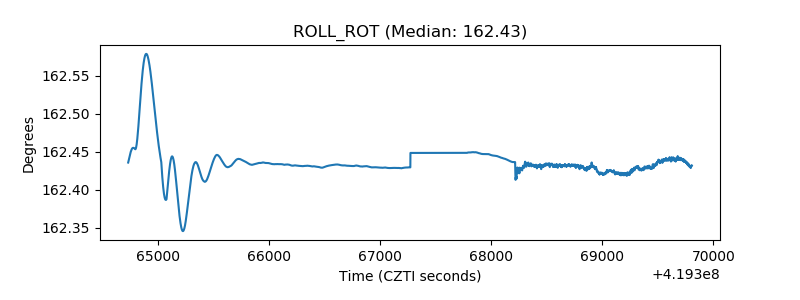 |
| _Roll_DEC | 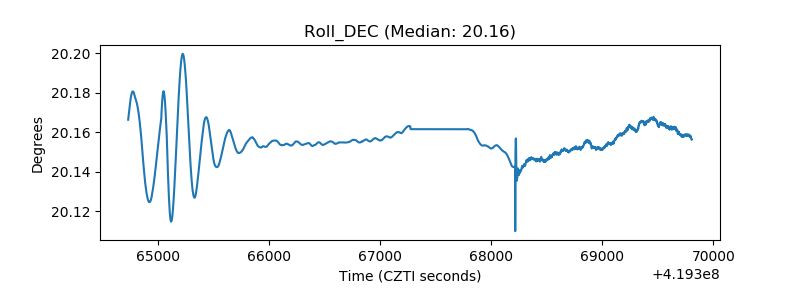 |
| _Roll_RA | 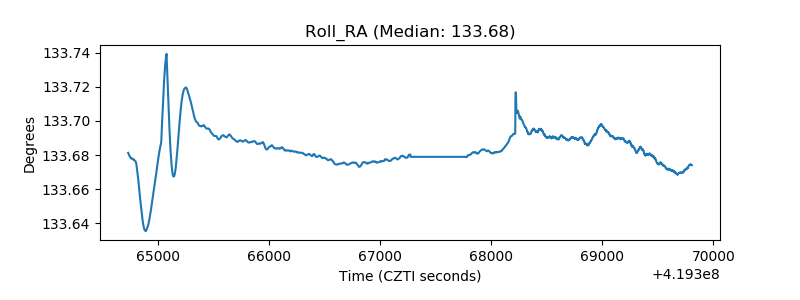 |
| Veto Counter | 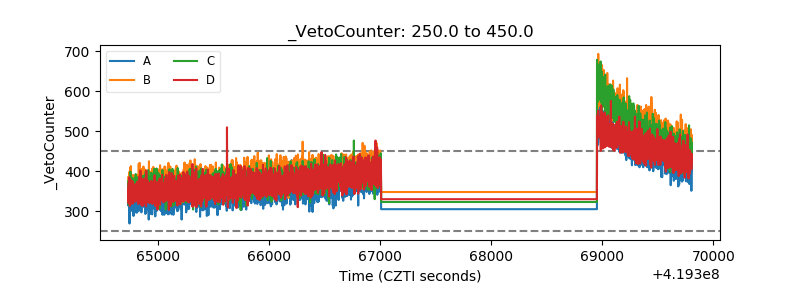 |