| Param | Original file | Final file |
|---|---|---|
| Filename | modeM0/AS1A12_104T02_9000005572_40822cztM0_level2.fits | modeM0/AS1A12_104T02_9000005572_40822cztM0_level2_quad_clean.evt |
| Size (bytes) | 331,868,160 | 87,684,480 |
| Size | 316.5 MB | 83.6 MB |
| Events in quadrant A | 2,894,477 | 598,910 |
| Events in quadrant B | 2,307,134 | 622,609 |
| Events in quadrant C | 2,492,388 | 582,517 |
| Events in quadrant D | 4,205,040 | 504,299 |
| Mode M9 | |||
|---|---|---|---|
| Quadrant | BADHDUFLAG | Total packets | Discarded packets |
| A | 0 | 32 | 0 |
| B | 0 | 32 | 0 |
| C | 0 | 32 | 0 |
| D | 0 | 33 | 0 |
| Mode M0 | |||
|---|---|---|---|
| Quadrant | BADHDUFLAG | Total packets | Discarded packets |
| A | 0 | 11560 | 3 |
| B | 0 | 10052 | 2 |
| C | 0 | 10328 | 2 |
| D | 0 | 15950 | 2 |
| Mode SS | |||
|---|---|---|---|
| Quadrant | BADHDUFLAG | Total packets | Discarded packets |
| A | 0 | 100 | 0 |
| B | 0 | 100 | 0 |
| C | 0 | 100 | 0 |
| D | 0 | 100 | 0 |
| Quadrant | Total seconds | Saturated seconds | Saturation percentage |
|---|---|---|---|
| A | 4949 | 28 | 0.565771% |
| B | 4949 | 13 | 0.262679% |
| C | 4949 | 30 | 0.606183% |
| D | 4949 | 381 | 7.698525% |
Noise dominated data is calculated using 1-second bins in cleaned event files. If a bin has >2000 counts, and if more than 50% of those come from <1% of pixels, then it is considered to be noise-dominated and hence unusable.
| Quadrant | # 1 sec bins | Bins with >0 counts | Bins with >2000 counts | High rate bins dominated by noise | Noise dominated (total time) | Noise dominated (detector-on time) | Marked lightcurve |
|---|---|---|---|---|---|---|---|
| A | 6982 | 4950 | 22 | 22 | 0.32% | 0.44% | 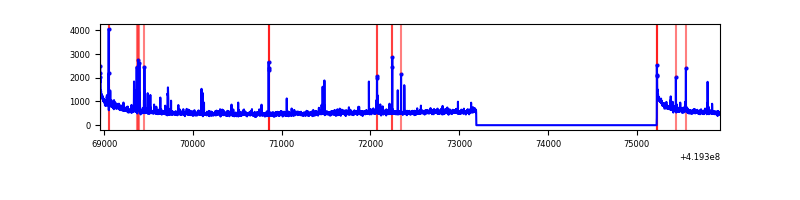 |
| B | 6982 | 4950 | 2 | 2 | 0.03% | 0.04% | 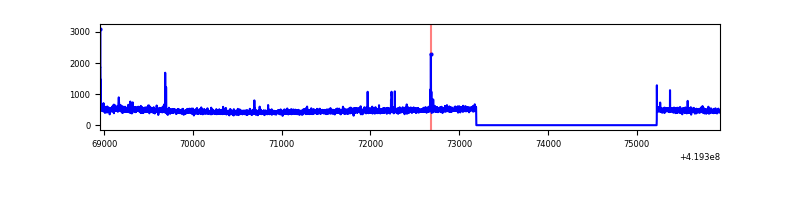 |
| C | 6982 | 4950 | 30 | 30 | 0.43% | 0.61% | 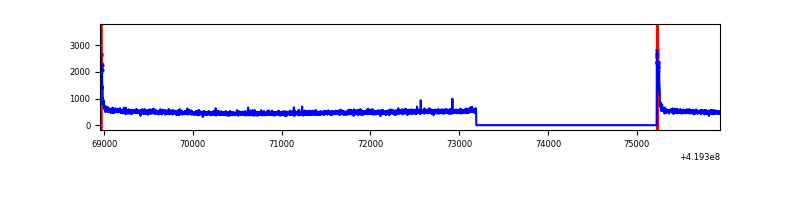 |
| D | 6982 | 4950 | 442 | 442 | 6.33% | 8.93% | 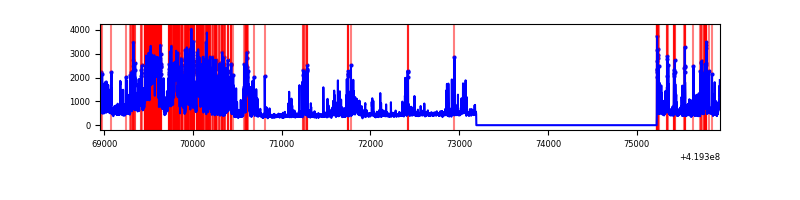 |
Top three noisy pixels from each quadrant. If the there are fewer than three noisy pixels in the level2.evt file, extra rows are filled as -1
| Pixel properties | Quadrant properties | ||||||
|---|---|---|---|---|---|---|---|
| Quadrant | DetID | PixID | Counts | Sigma | Mean | Median | Sigma |
| A | 10 | 83 | 470044 | 4021.36 | 568 | 557 | 116.7 |
| A | 6 | 10 | 83739 | 712.49 | 568 | 557 | 116.7 |
| A | 12 | 189 | 59295 | 503.12 | 568 | 557 | 116.7 |
| B | 0 | 190 | 29338 | 261.81 | 571 | 556 | 109.9 |
| B | 5 | 255 | 16111 | 141.49 | 571 | 556 | 109.9 |
| B | 12 | 111 | 13706 | 119.62 | 571 | 556 | 109.9 |
| C | 15 | 214 | 213021 | 1632.57 | 555 | 559 | 130.1 |
| C | 0 | 10 | 107014 | 818.01 | 555 | 559 | 130.1 |
| C | 13 | 61 | 3706 | 24.18 | 555 | 559 | 130.1 |
| D | 1 | 47 | 1104327 | 8422.89 | 533 | 518 | 131.0 |
| D | 12 | 79 | 420623 | 3205.72 | 533 | 518 | 131.0 |
| D | 2 | 249 | 387122 | 2950.08 | 533 | 518 | 131.0 |
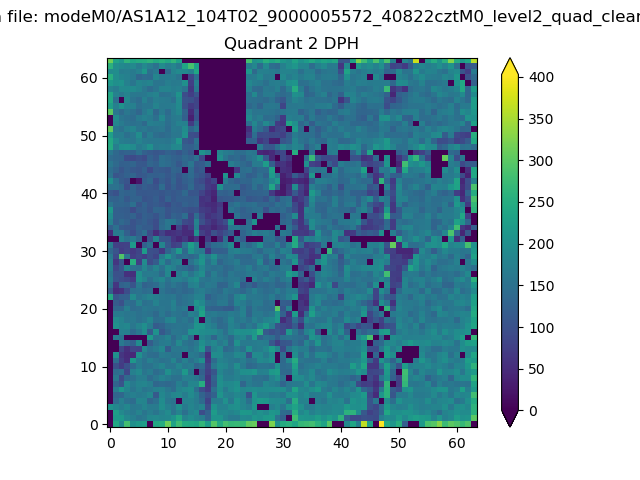
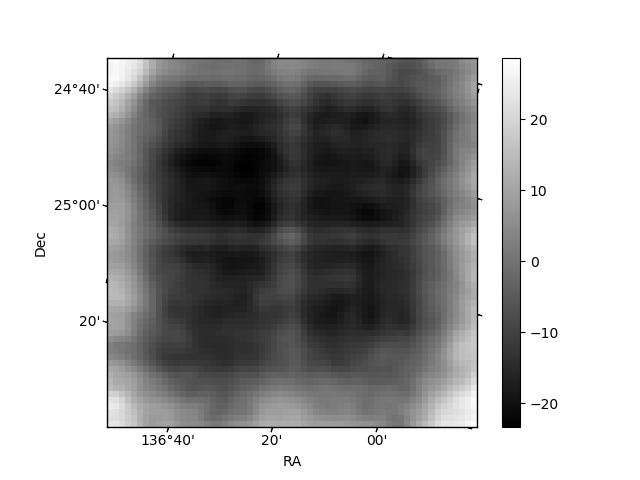
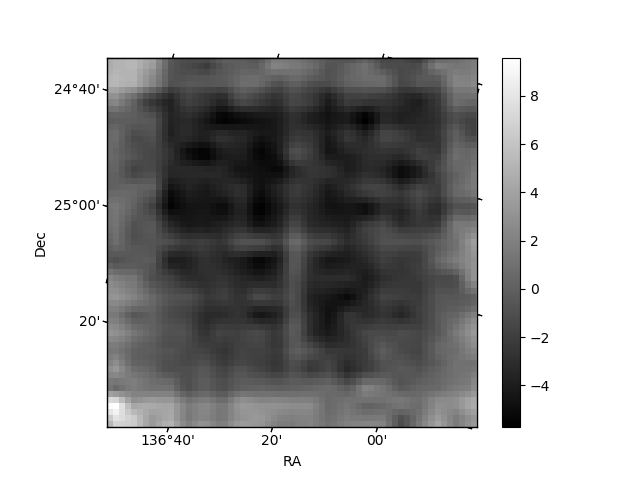
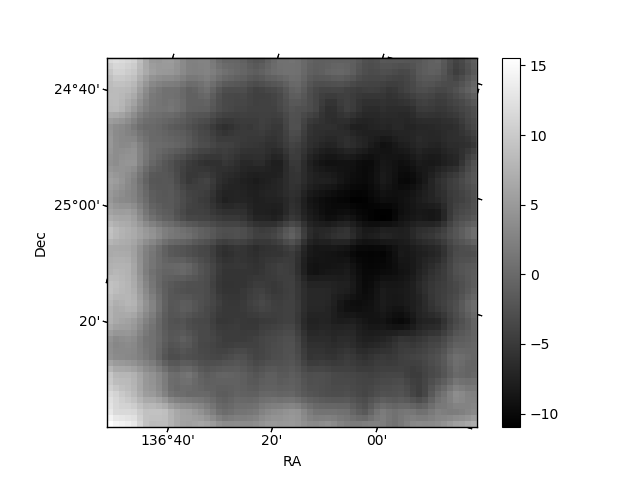
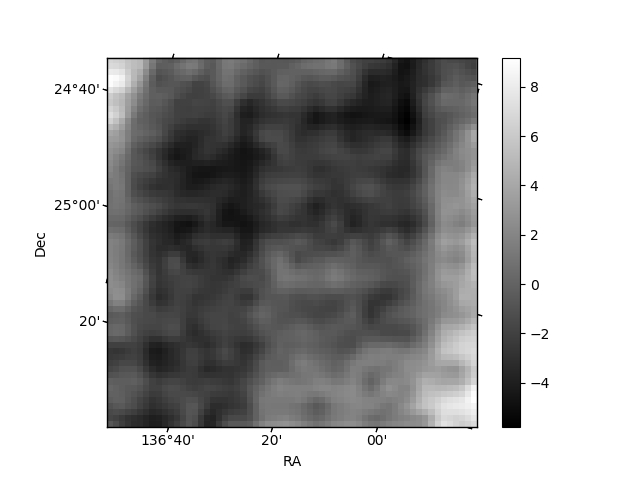
Histogram calculated using DETX and DETY for each event in the final _common_clean file
| Quadrant A | 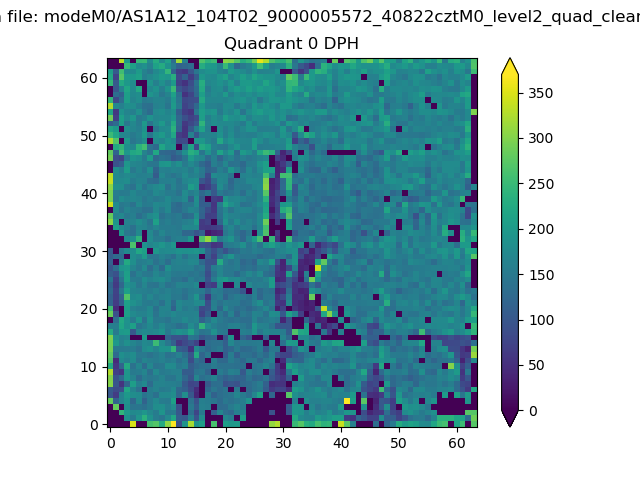 |
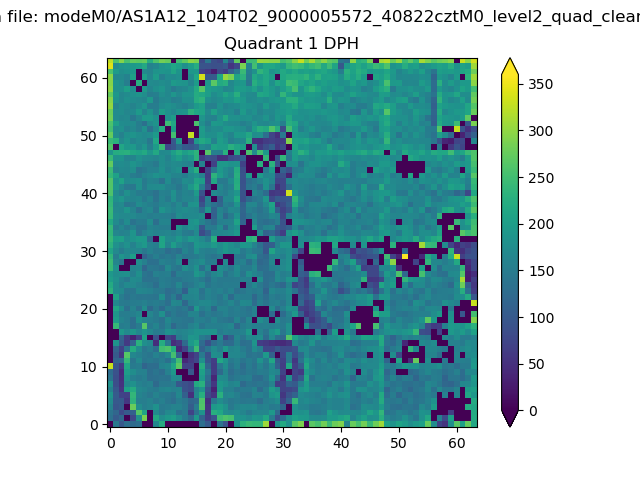 |
Quadrant B |
|---|---|---|---|
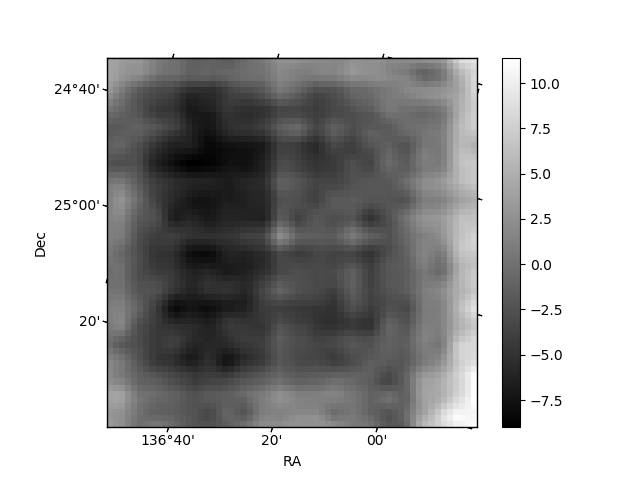
| Quadrant D | 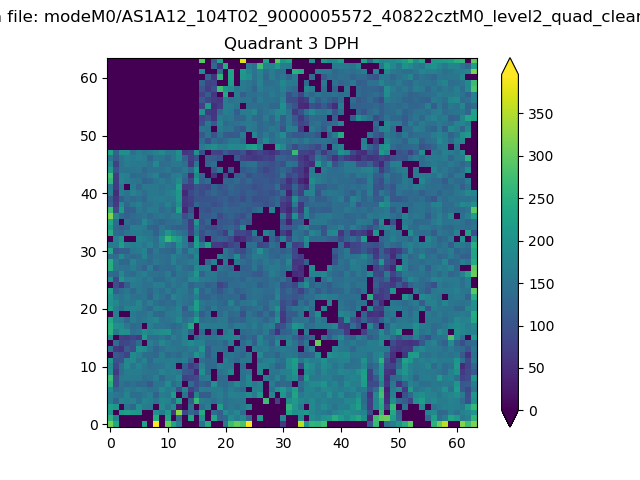 |
 |
Quadrant C |
| Plot type | Count rate plots | Images |
|---|---|---|
| Comparison with Poisson distribution Blue bars denote a histogram of data divided into 1 sec bins. Red curve is a Poisson curve with rate = median count rate of data. |
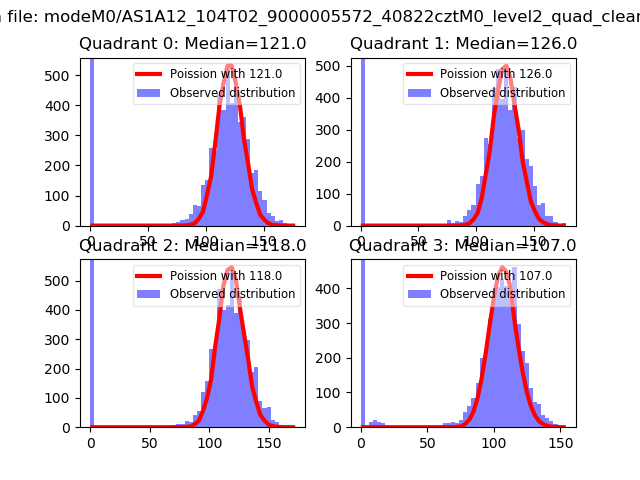 |
 |
| Quadrant-wise count rates Data is divided into 100 sec bins |
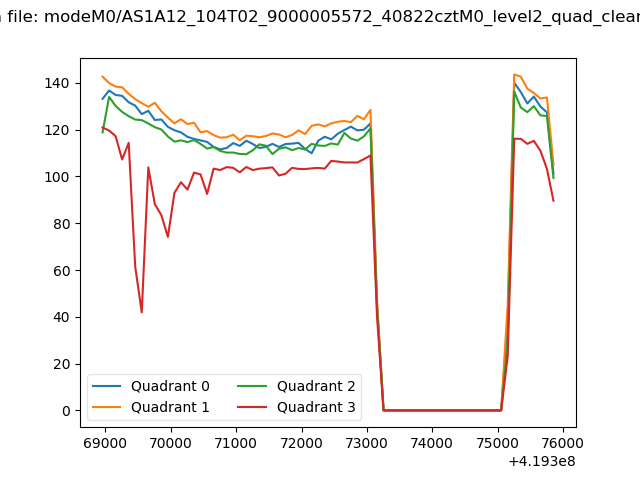 |
|
| Module-wise count rates for Quadrant A Data is divided into 100 sec bins |
 |
 |
| Module-wise count rates for Quadrant B Data is divided into 100 sec bins |
 |
 |
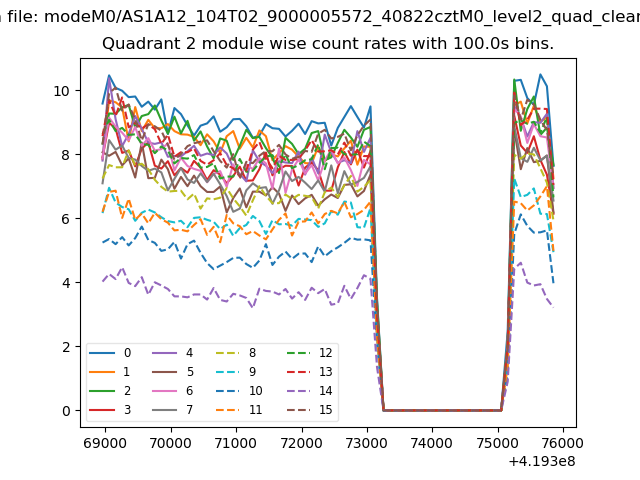
| Module-wise count rates for Quadrant C Data is divided into 100 sec bins |
 |
 |
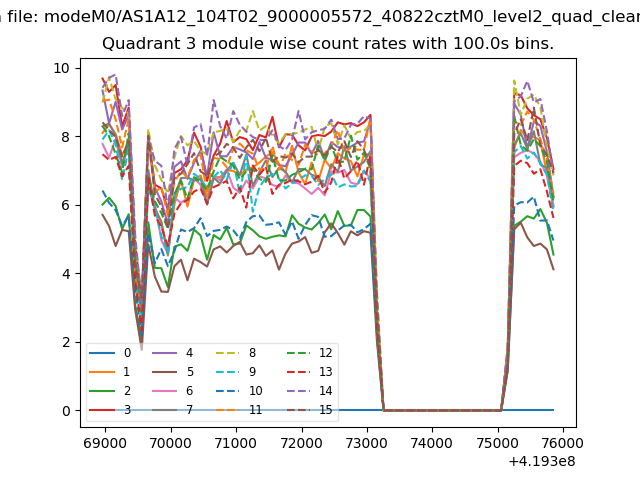
| Module-wise count rates for Quadrant D Data is divided into 100 sec bins |
 |
 |
| Parameter | Plot |
|---|---|
| CZT HV Monitor | 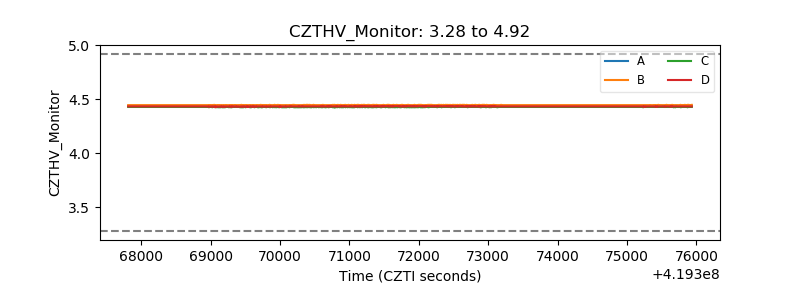 |
| D_VDD | 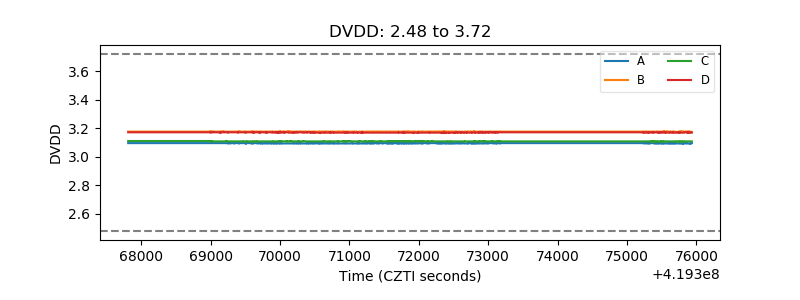 |
| Temperature 1 | 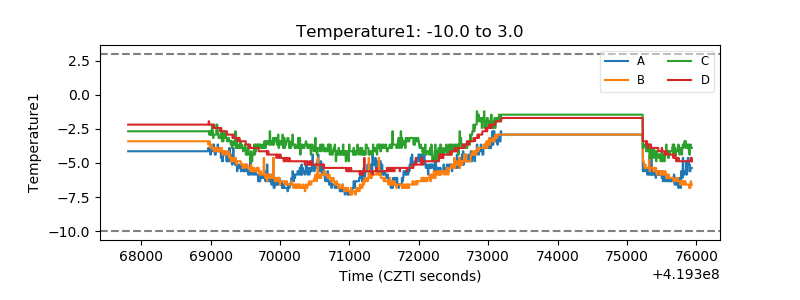 |
| Veto HV Monitor | 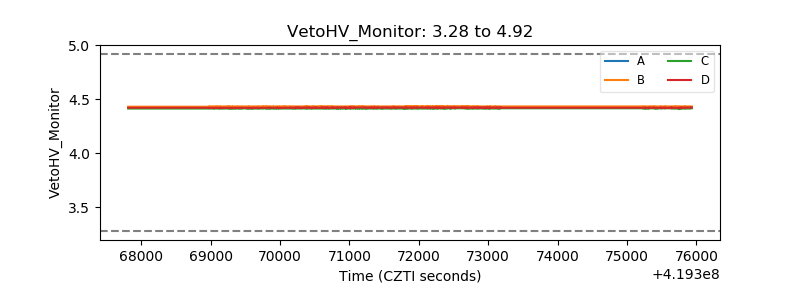 |
| Veto LLD | 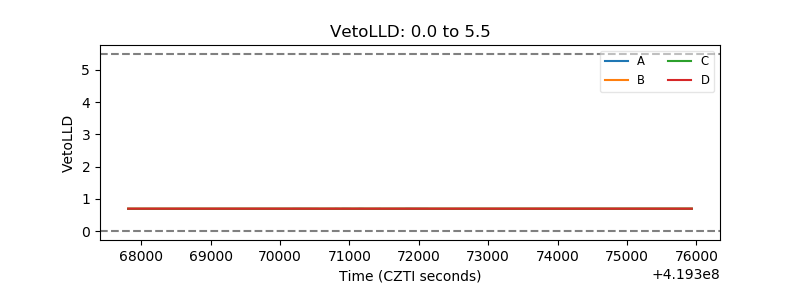 |
| Alpha Counter |  |
| _CPM_Rate |  |
| CZT Counter | 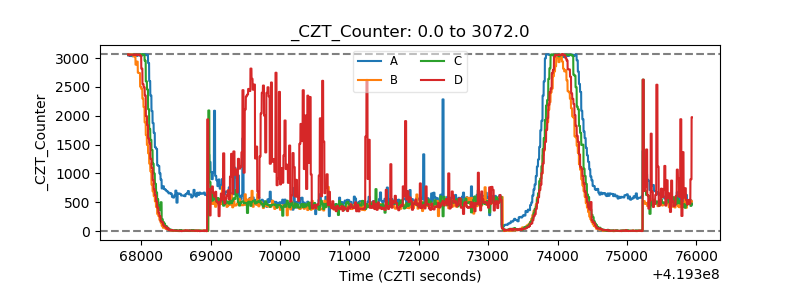 |
| +2.5 Volts monitor | 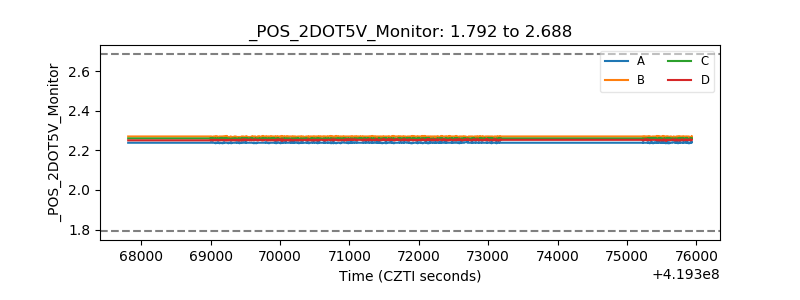 |
| +5 Volts monitor | 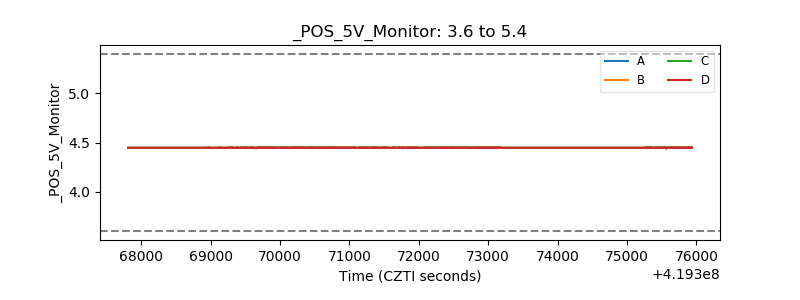 |
| _ROLL_ROT | 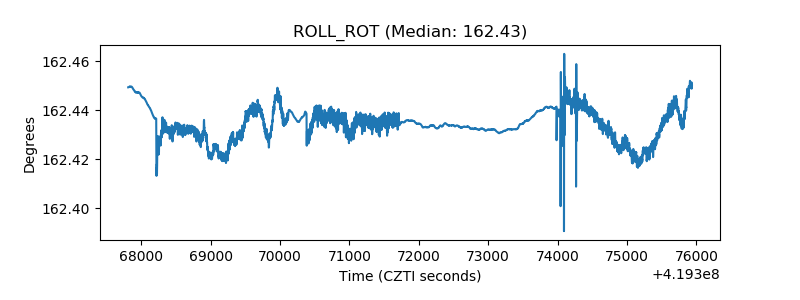 |
| _Roll_DEC | 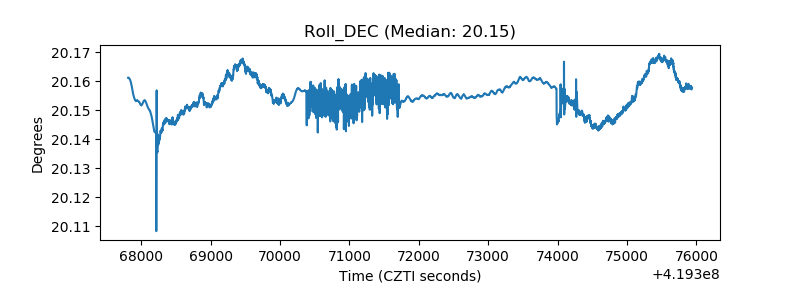 |
| _Roll_RA | 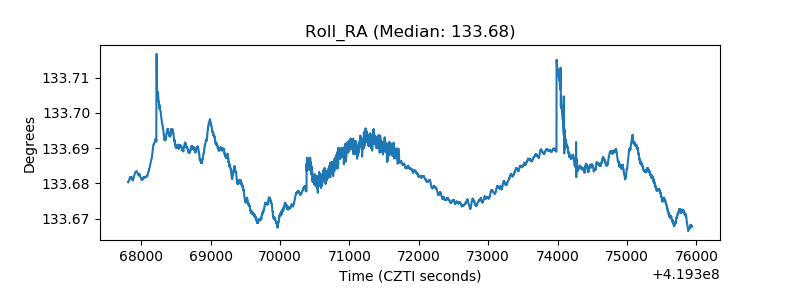 |
| Veto Counter | 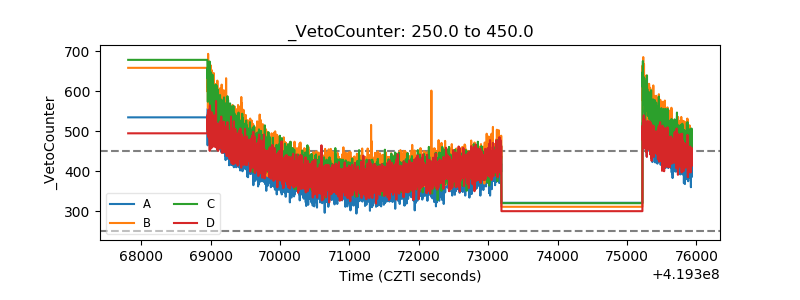 |