| Param | Original file | Final file |
|---|---|---|
| Filename | modeM0/AS1A12_104T02_9000005572_40824cztM0_level2.fits | modeM0/AS1A12_104T02_9000005572_40824cztM0_level2_quad_clean.evt |
| Size (bytes) | 286,205,760 | 85,242,240 |
| Size | 272.9 MB | 81.3 MB |
| Events in quadrant A | 2,750,373 | 575,106 |
| Events in quadrant B | 2,229,910 | 596,394 |
| Events in quadrant C | 2,498,360 | 558,961 |
| Events in quadrant D | 2,731,183 | 504,867 |
| Mode M9 | |||
|---|---|---|---|
| Quadrant | BADHDUFLAG | Total packets | Discarded packets |
| A | 0 | 40 | 0 |
| B | 0 | 40 | 0 |
| C | 0 | 40 | 0 |
| D | 0 | 41 | 0 |
| Mode M0 | |||
|---|---|---|---|
| Quadrant | BADHDUFLAG | Total packets | Discarded packets |
| A | 0 | 11144 | 3 |
| B | 0 | 9967 | 2 |
| C | 0 | 10404 | 2 |
| D | 0 | 11758 | 2 |
| Mode SS | |||
|---|---|---|---|
| Quadrant | BADHDUFLAG | Total packets | Discarded packets |
| A | 0 | 102 | 0 |
| B | 0 | 102 | 0 |
| C | 0 | 102 | 0 |
| D | 0 | 102 | 0 |
| Quadrant | Total seconds | Saturated seconds | Saturation percentage |
|---|---|---|---|
| A | 4929 | 6 | 0.121729% |
| B | 4929 | 10 | 0.202881% |
| C | 4929 | 36 | 0.730371% |
| D | 4929 | 115 | 2.333130% |
Noise dominated data is calculated using 1-second bins in cleaned event files. If a bin has >2000 counts, and if more than 50% of those come from <1% of pixels, then it is considered to be noise-dominated and hence unusable.
| Quadrant | # 1 sec bins | Bins with >0 counts | Bins with >2000 counts | High rate bins dominated by noise | Noise dominated (total time) | Noise dominated (detector-on time) | Marked lightcurve |
|---|---|---|---|---|---|---|---|
| A | 7052 | 4930 | 4 | 4 | 0.06% | 0.08% | 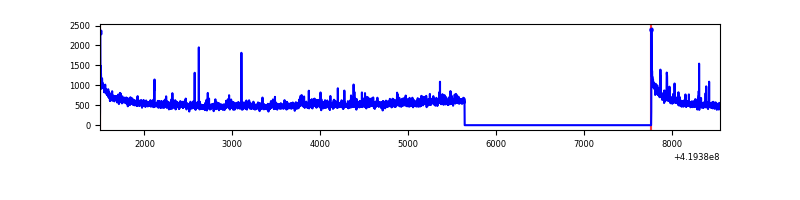 |
| B | 7052 | 4930 | 1 | 1 | 0.01% | 0.02% | 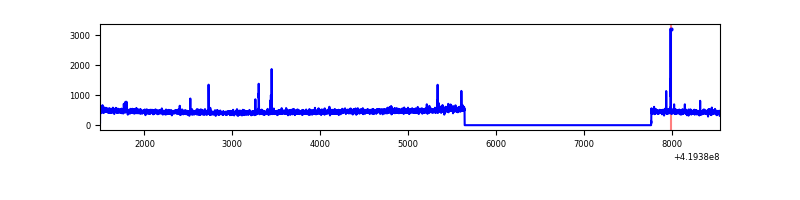 |
| C | 7052 | 4930 | 42 | 42 | 0.60% | 0.85% | 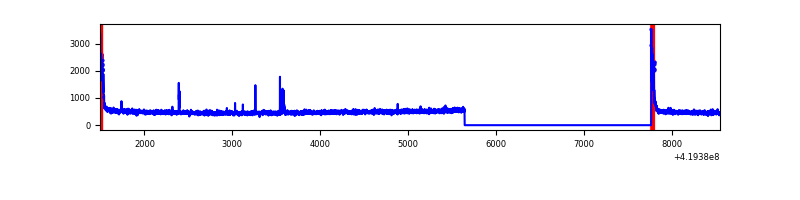 |
| D | 7052 | 4930 | 80 | 80 | 1.13% | 1.62% | 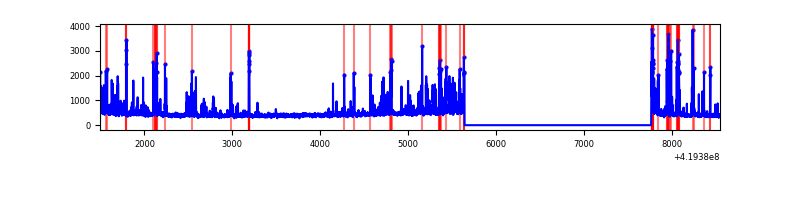 |
Top three noisy pixels from each quadrant. If the there are fewer than three noisy pixels in the level2.evt file, extra rows are filled as -1
| Pixel properties | Quadrant properties | ||||||
|---|---|---|---|---|---|---|---|
| Quadrant | DetID | PixID | Counts | Sigma | Mean | Median | Sigma |
| A | 10 | 83 | 468950 | 4101.66 | 558 | 546 | 114.2 |
| A | 6 | 10 | 55085 | 477.58 | 558 | 546 | 114.2 |
| A | 12 | 189 | 53232 | 461.35 | 558 | 546 | 114.2 |
| B | 0 | 190 | 28111 | 255.71 | 558 | 543 | 107.8 |
| B | 12 | 111 | 13652 | 121.6 | 558 | 543 | 107.8 |
| B | 11 | 111 | 12596 | 111.8 | 558 | 543 | 107.8 |
| C | 15 | 214 | 211339 | 1660.13 | 543 | 547 | 127.0 |
| C | 0 | 10 | 143484 | 1125.72 | 543 | 547 | 127.0 |
| C | 14 | 254 | 10818 | 80.89 | 543 | 547 | 127.0 |
| D | 2 | 249 | 374545 | 2911.2 | 531 | 516 | 128.5 |
| D | 13 | 249 | 210271 | 1632.6 | 531 | 516 | 128.5 |
| D | 1 | 47 | 71509 | 552.56 | 531 | 516 | 128.5 |
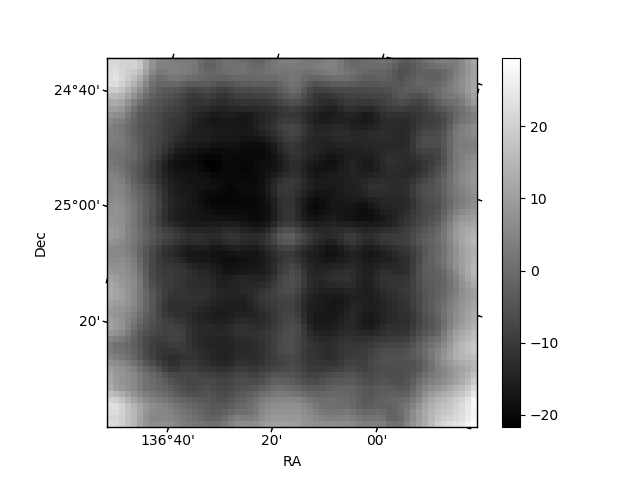
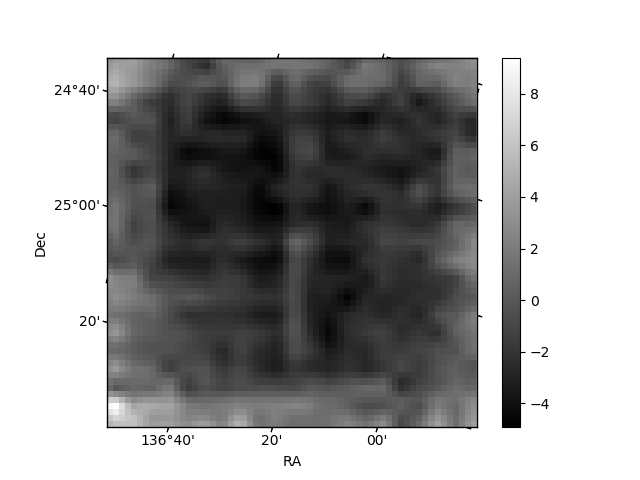
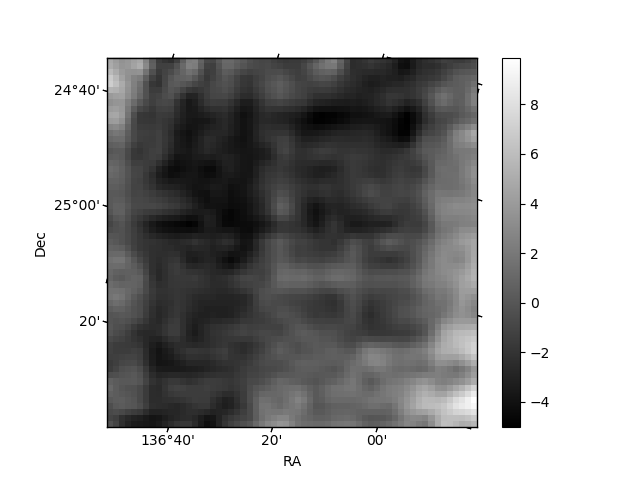
Histogram calculated using DETX and DETY for each event in the final _common_clean file
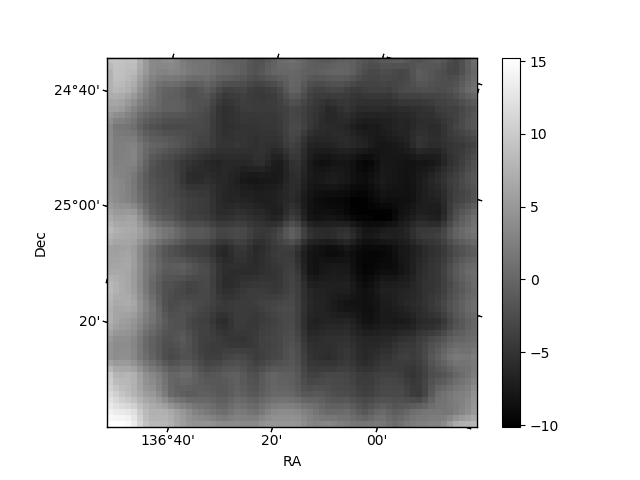
| Quadrant A | 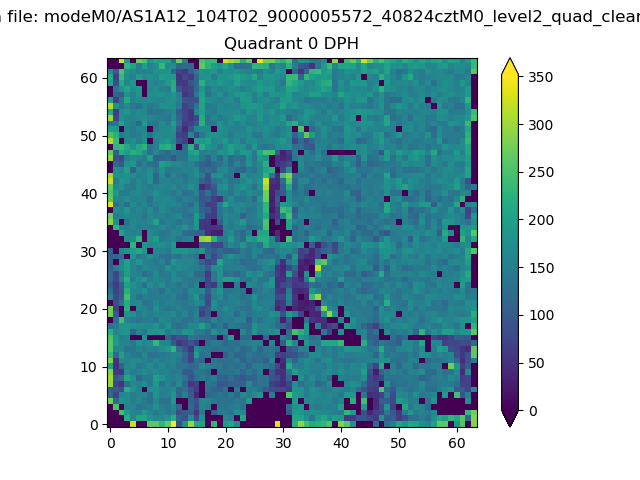 |
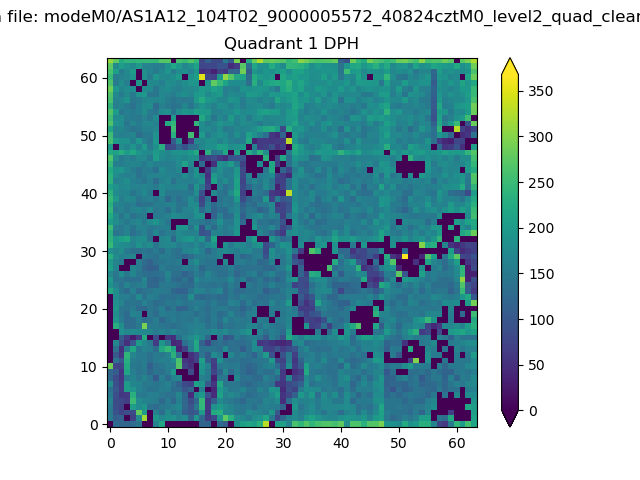 |
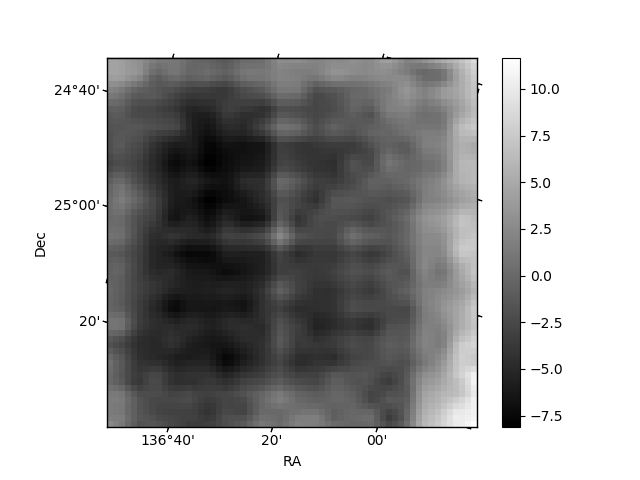
Quadrant B |
|---|---|---|---|
| Quadrant D | 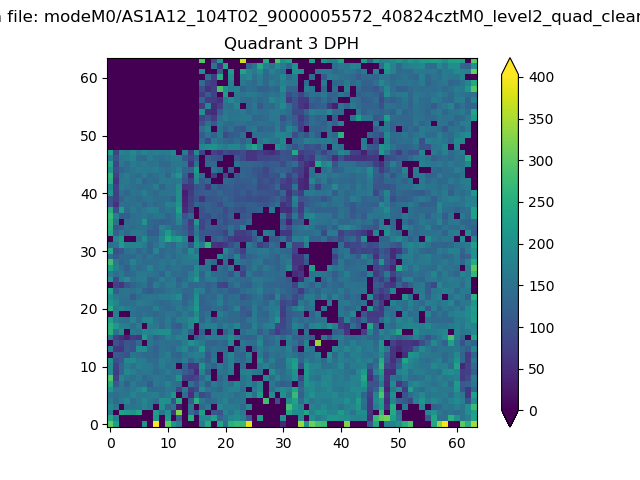 |
 |
Quadrant C |
| Plot type | Count rate plots | Images |
|---|---|---|
| Comparison with Poisson distribution Blue bars denote a histogram of data divided into 1 sec bins. Red curve is a Poisson curve with rate = median count rate of data. |
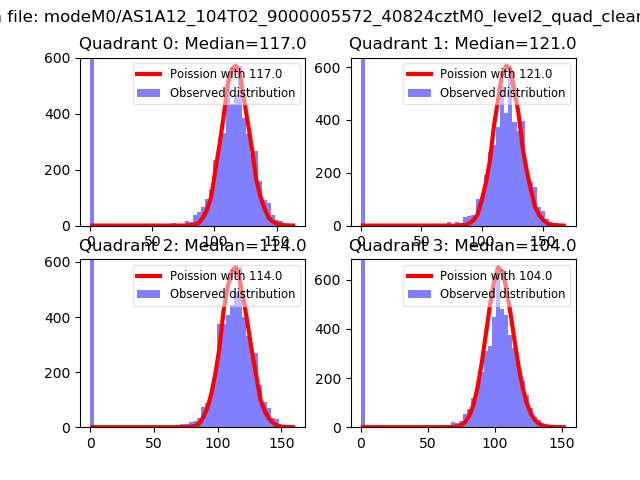 |
 |
| Quadrant-wise count rates Data is divided into 100 sec bins |
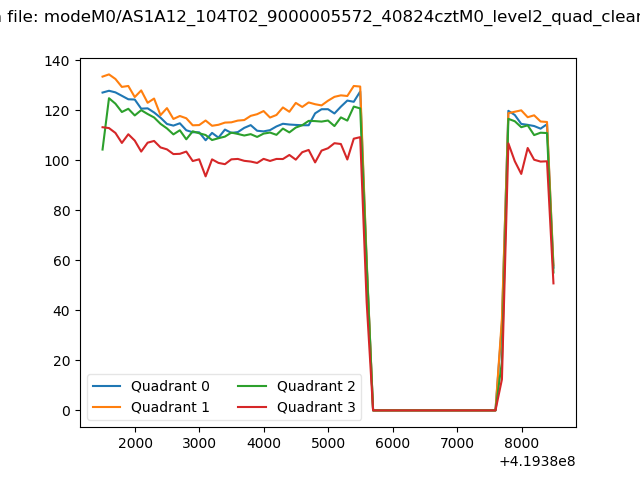 |
|
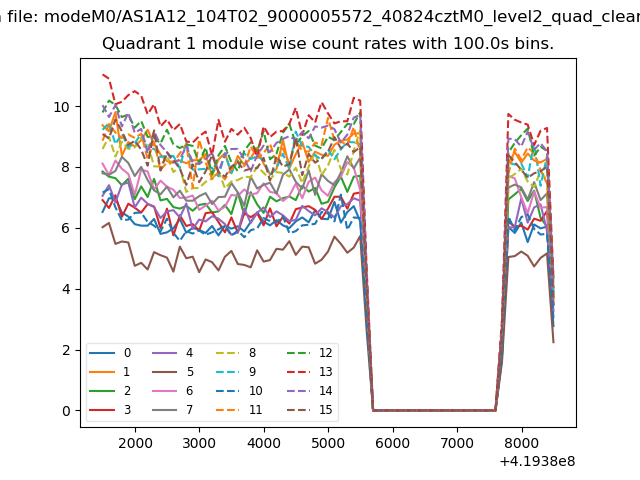
| Module-wise count rates for Quadrant A Data is divided into 100 sec bins |
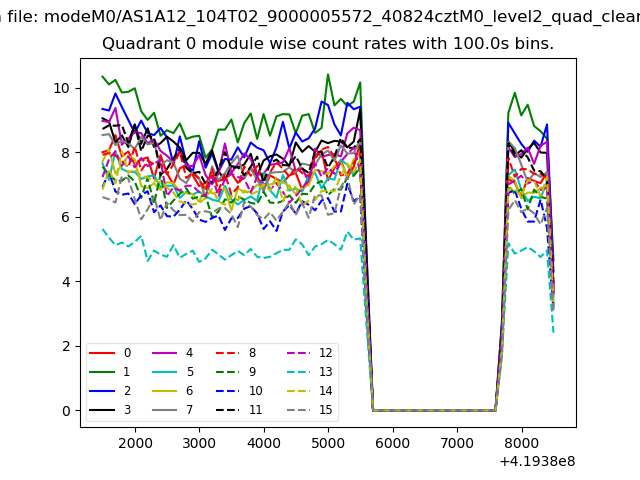 |
 |
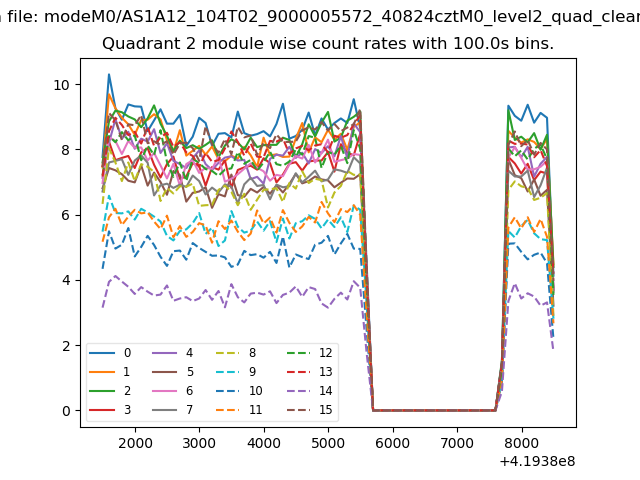
| Module-wise count rates for Quadrant B Data is divided into 100 sec bins |
 |
 |
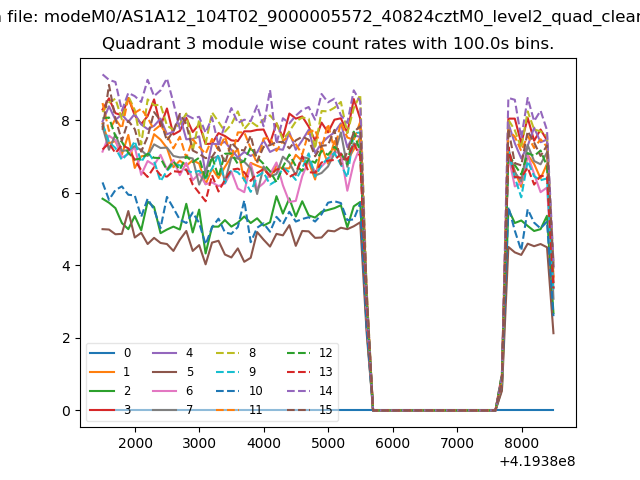
| Module-wise count rates for Quadrant C Data is divided into 100 sec bins |
 |
 |
| Module-wise count rates for Quadrant D Data is divided into 100 sec bins |
 |
 |
| Parameter | Plot |
|---|---|
| CZT HV Monitor | 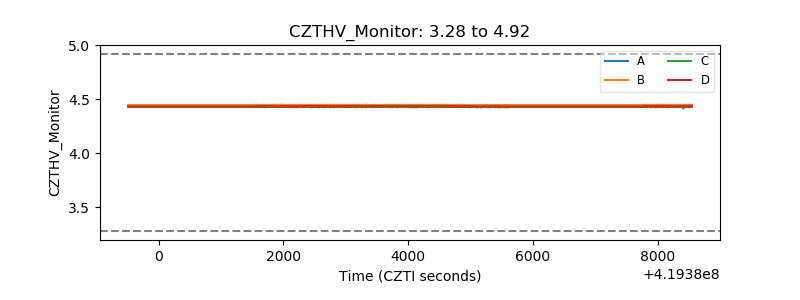 |
| D_VDD | 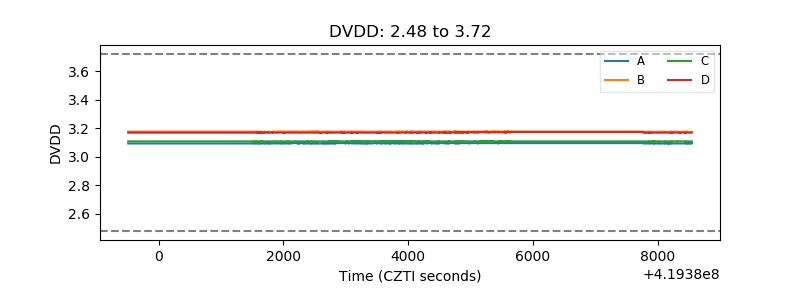 |
| Temperature 1 | 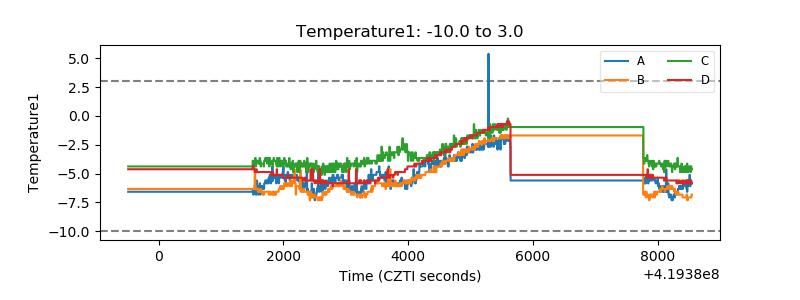 |
| Veto HV Monitor | 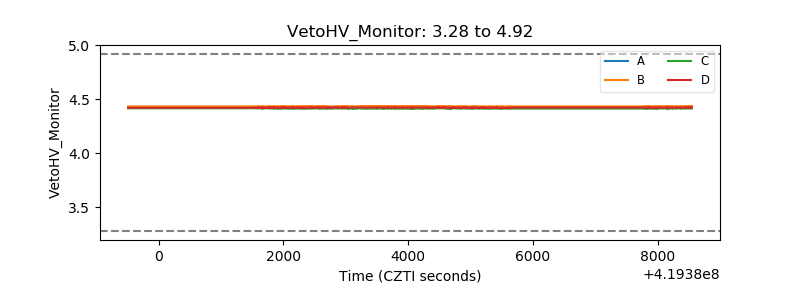 |
| Veto LLD | 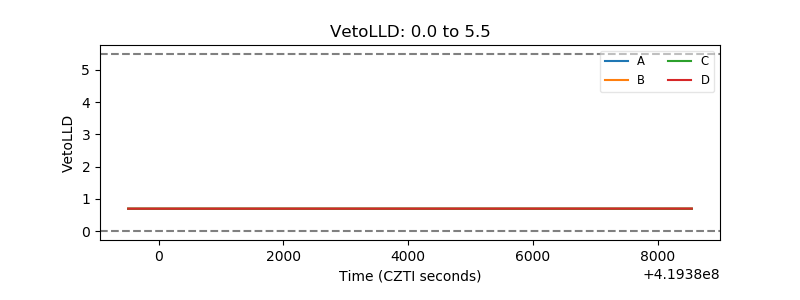 |
| Alpha Counter | 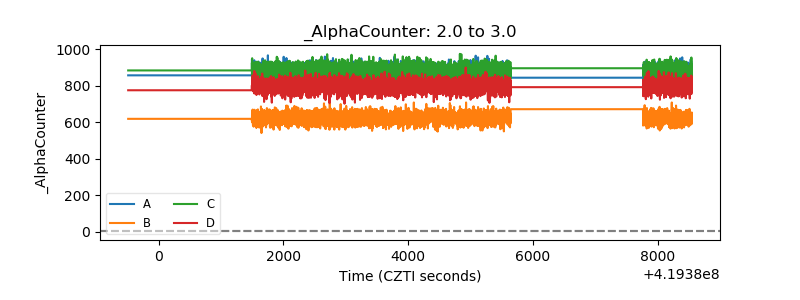 |
| _CPM_Rate | 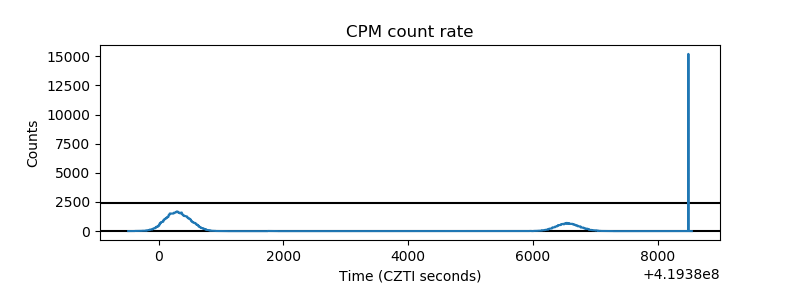 |
| CZT Counter | 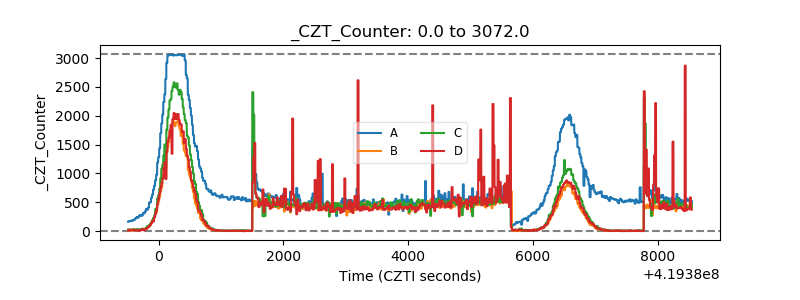 |
| +2.5 Volts monitor | 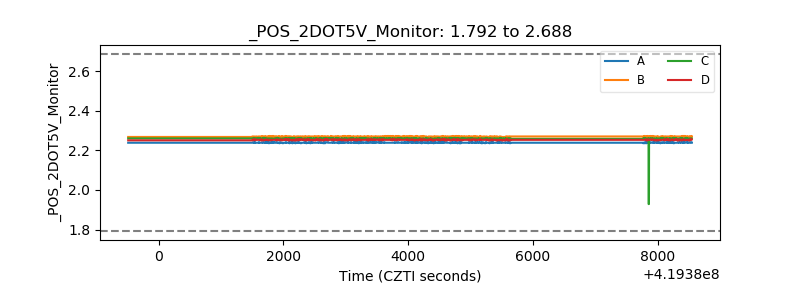 |
| +5 Volts monitor | 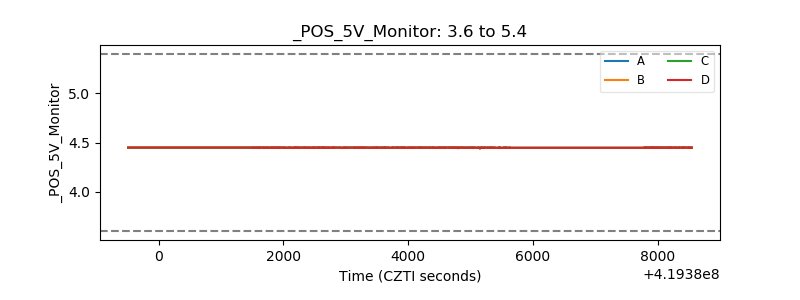 |
| _ROLL_ROT | 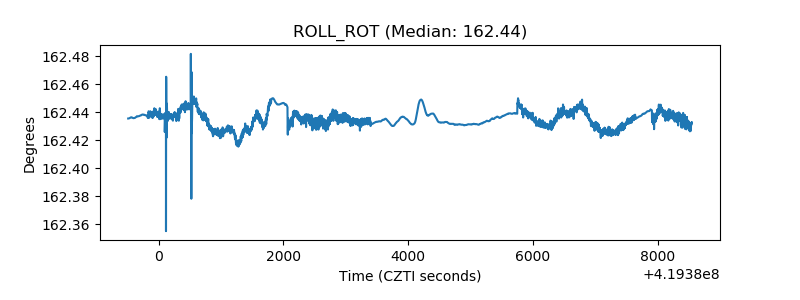 |
| _Roll_DEC | 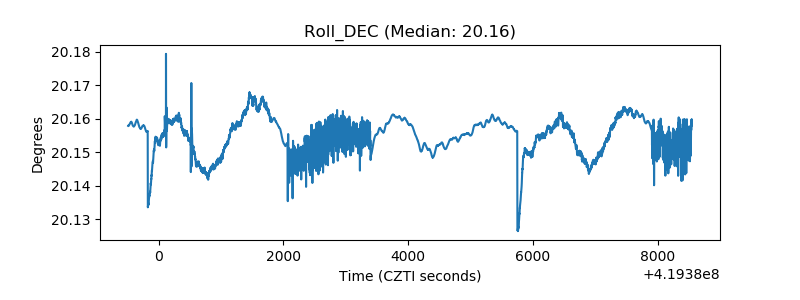 |
| _Roll_RA | 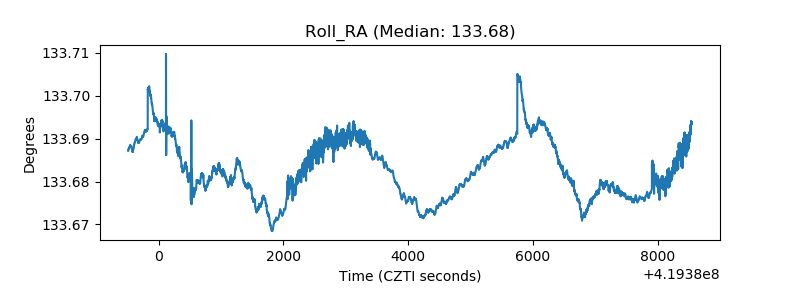 |
| Veto Counter | 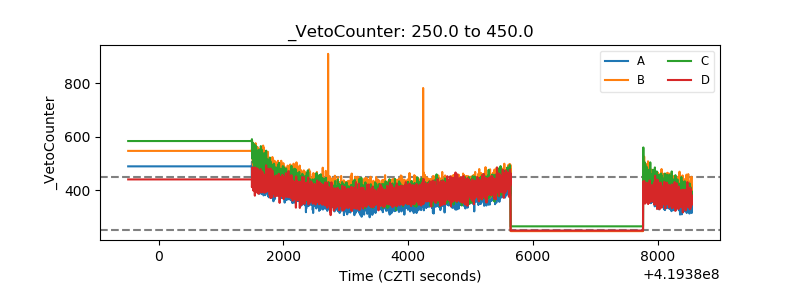 |