| Param | Original file | Final file |
|---|---|---|
| Filename | modeM0/AS1A12_104T02_9000005572_40825cztM0_level2.fits | modeM0/AS1A12_104T02_9000005572_40825cztM0_level2_quad_clean.evt |
| Size (bytes) | 300,755,520 | 84,323,520 |
| Size | 286.8 MB | 80.4 MB |
| Events in quadrant A | 2,870,982 | 565,521 |
| Events in quadrant B | 2,281,339 | 585,855 |
| Events in quadrant C | 2,500,940 | 553,563 |
| Events in quadrant D | 3,084,556 | 493,678 |
| Mode M9 | |||
|---|---|---|---|
| Quadrant | BADHDUFLAG | Total packets | Discarded packets |
| A | 0 | 42 | 0 |
| B | 0 | 42 | 0 |
| C | 0 | 42 | 0 |
| D | 0 | 42 | 0 |
| Mode M0 | |||
|---|---|---|---|
| Quadrant | BADHDUFLAG | Total packets | Discarded packets |
| A | 0 | 11571 | 3 |
| B | 0 | 10333 | 2 |
| C | 0 | 10583 | 2 |
| D | 0 | 12858 | 2 |
| Mode SS | |||
|---|---|---|---|
| Quadrant | BADHDUFLAG | Total packets | Discarded packets |
| A | 0 | 104 | 0 |
| B | 0 | 104 | 0 |
| C | 0 | 104 | 0 |
| D | 0 | 104 | 0 |
| Quadrant | Total seconds | Saturated seconds | Saturation percentage |
|---|---|---|---|
| A | 5066 | 32 | 0.631662% |
| B | 5066 | 14 | 0.276352% |
| C | 5066 | 31 | 0.611923% |
| D | 5066 | 207 | 4.086064% |
Noise dominated data is calculated using 1-second bins in cleaned event files. If a bin has >2000 counts, and if more than 50% of those come from <1% of pixels, then it is considered to be noise-dominated and hence unusable.
| Quadrant | # 1 sec bins | Bins with >0 counts | Bins with >2000 counts | High rate bins dominated by noise | Noise dominated (total time) | Noise dominated (detector-on time) | Marked lightcurve |
|---|---|---|---|---|---|---|---|
| A | 9222 | 5068 | 22 | 22 | 0.24% | 0.43% | 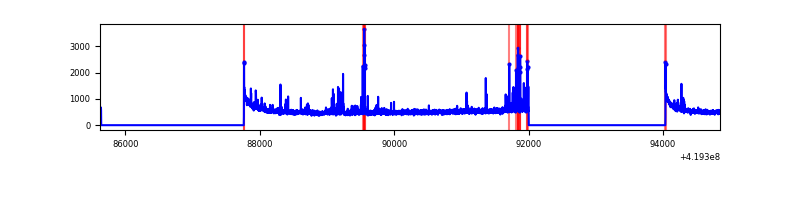 |
| B | 9222 | 5068 | 2 | 2 | 0.02% | 0.04% | 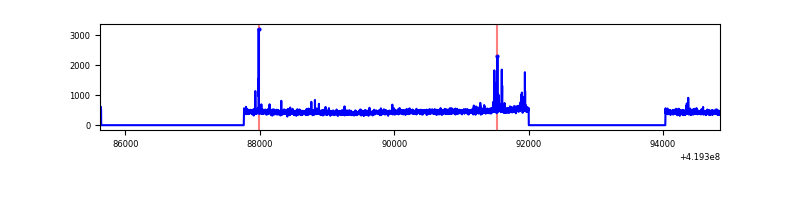 |
| C | 9222 | 5068 | 33 | 33 | 0.36% | 0.65% | 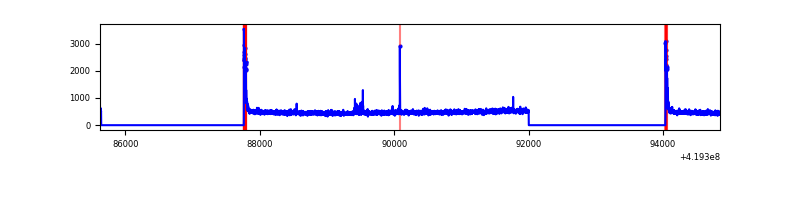 |
| D | 9222 | 5068 | 154 | 154 | 1.67% | 3.04% | 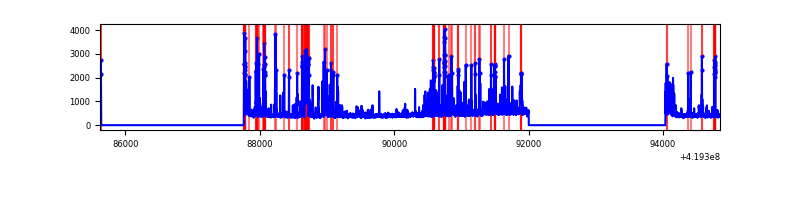 |
Top three noisy pixels from each quadrant. If the there are fewer than three noisy pixels in the level2.evt file, extra rows are filled as -1
| Pixel properties | Quadrant properties | ||||||
|---|---|---|---|---|---|---|---|
| Quadrant | DetID | PixID | Counts | Sigma | Mean | Median | Sigma |
| A | 10 | 83 | 468002 | 4037.0 | 562 | 550 | 115.8 |
| A | 13 | 248 | 181345 | 1561.38 | 562 | 550 | 115.8 |
| A | 6 | 10 | 22824 | 192.36 | 562 | 550 | 115.8 |
| B | 0 | 190 | 36298 | 326.6 | 560 | 544 | 109.5 |
| B | 15 | 32 | 21546 | 191.85 | 560 | 544 | 109.5 |
| B | 12 | 111 | 13937 | 122.34 | 560 | 544 | 109.5 |
| C | 15 | 214 | 216884 | 1692.7 | 547 | 551 | 127.8 |
| C | 0 | 10 | 120916 | 941.8 | 547 | 551 | 127.8 |
| C | 14 | 254 | 20624 | 157.06 | 547 | 551 | 127.8 |
| D | 13 | 249 | 506857 | 3815.75 | 536 | 521 | 132.7 |
| D | 2 | 249 | 381148 | 2868.41 | 536 | 521 | 132.7 |
| D | 1 | 47 | 69292 | 518.26 | 536 | 521 | 132.7 |
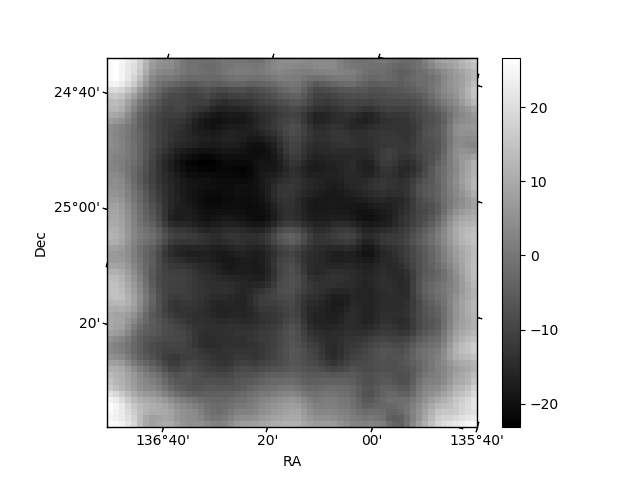
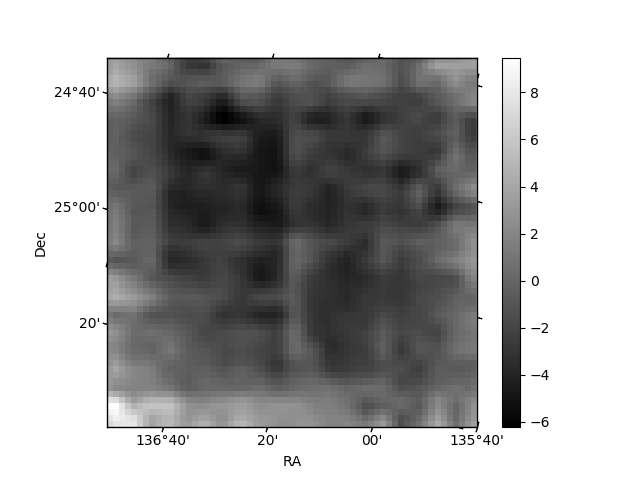
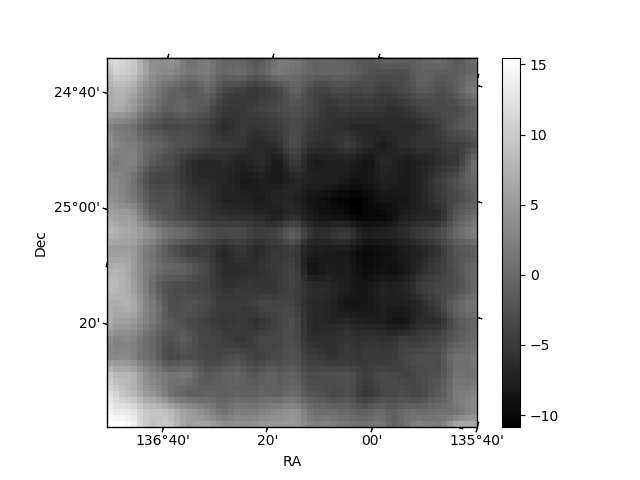
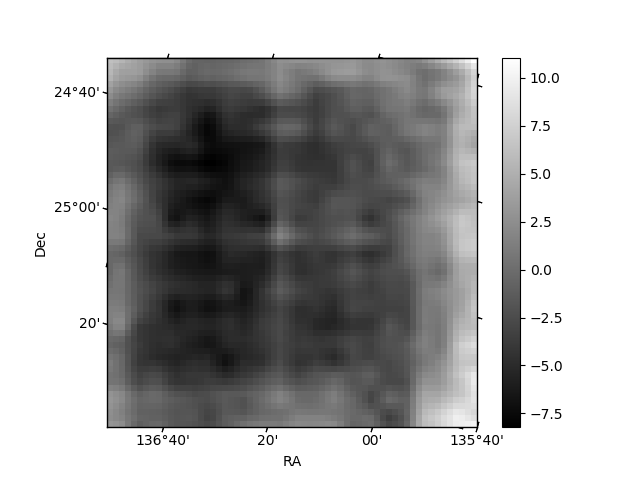
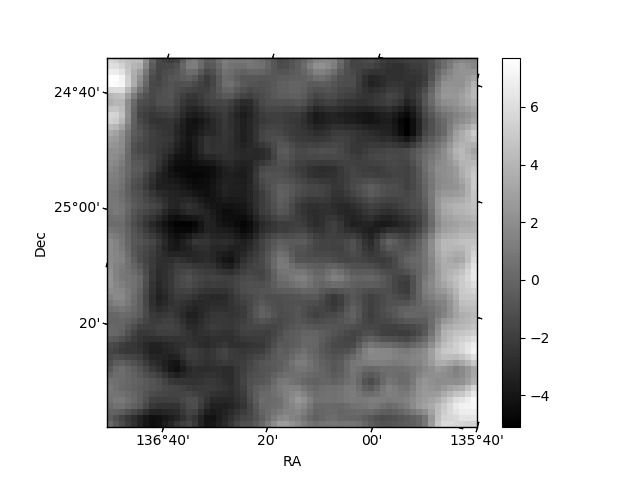
Histogram calculated using DETX and DETY for each event in the final _common_clean file
| Quadrant A | 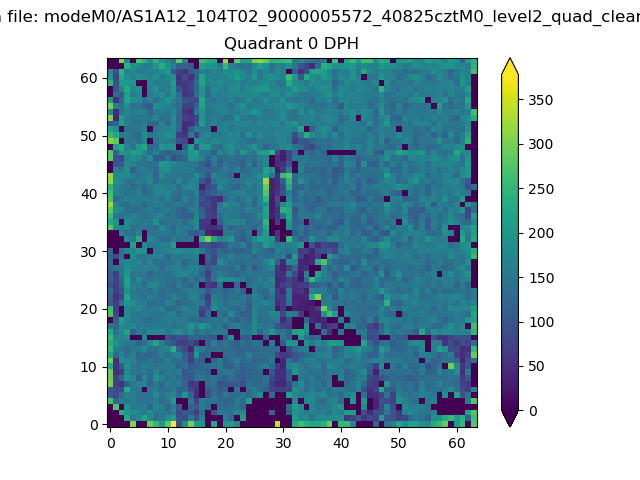 |
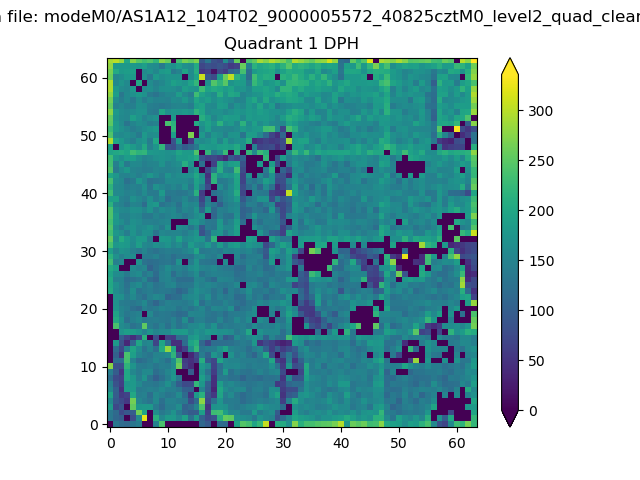 |
Quadrant B |
|---|---|---|---|
| Quadrant D | 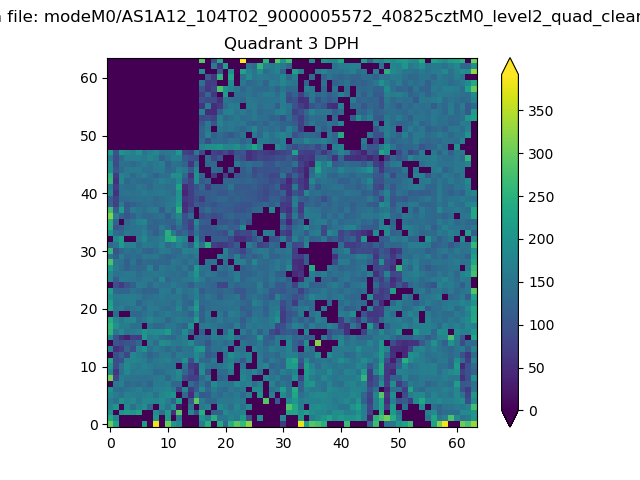 |
 |
Quadrant C |
| Plot type | Count rate plots | Images |
|---|---|---|
| Comparison with Poisson distribution Blue bars denote a histogram of data divided into 1 sec bins. Red curve is a Poisson curve with rate = median count rate of data. |
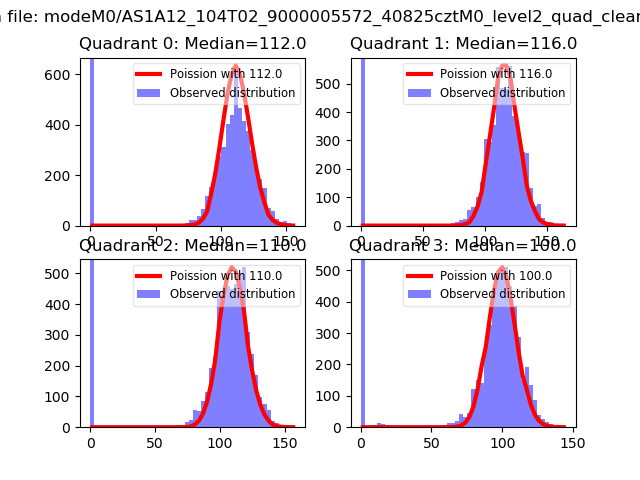 |
 |
| Quadrant-wise count rates Data is divided into 100 sec bins |
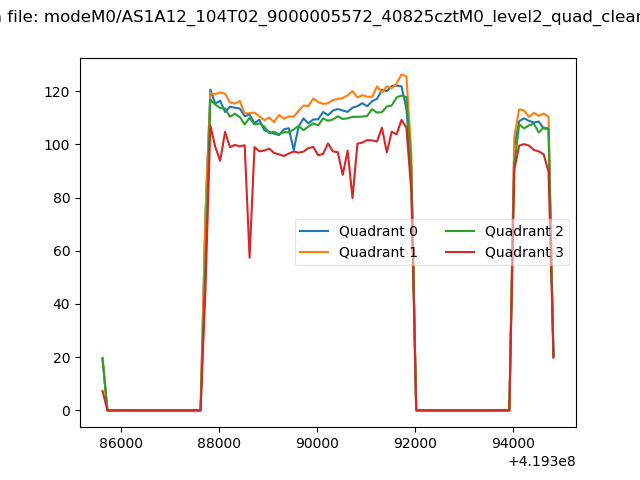 |
|
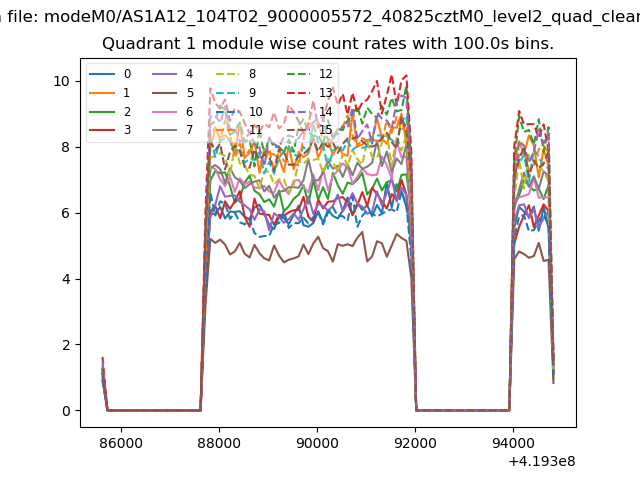
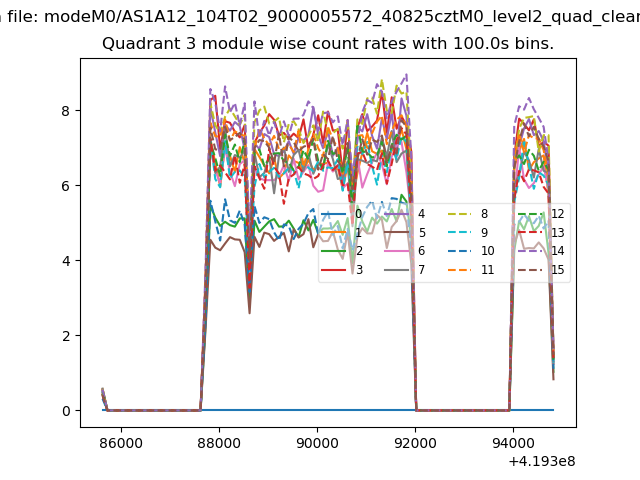
| Module-wise count rates for Quadrant A Data is divided into 100 sec bins |
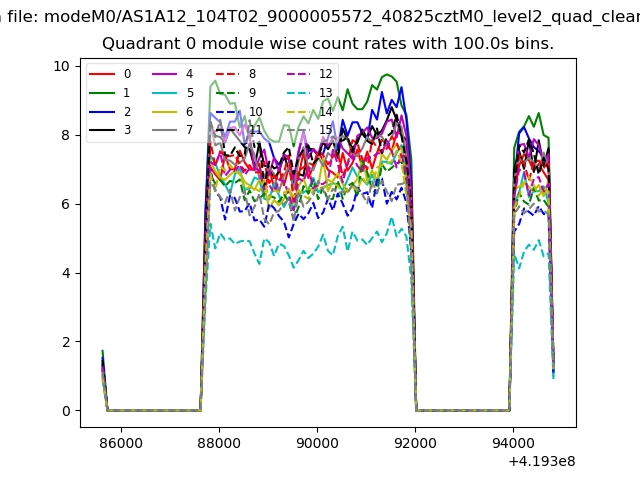 |
 |
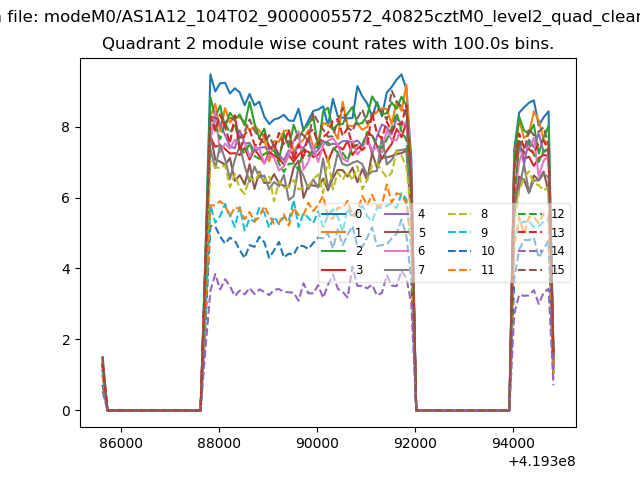
| Module-wise count rates for Quadrant B Data is divided into 100 sec bins |
 |
 |
| Module-wise count rates for Quadrant C Data is divided into 100 sec bins |
 |
 |
| Module-wise count rates for Quadrant D Data is divided into 100 sec bins |
 |
 |
| Parameter | Plot |
|---|---|
| CZT HV Monitor |  |
| D_VDD | 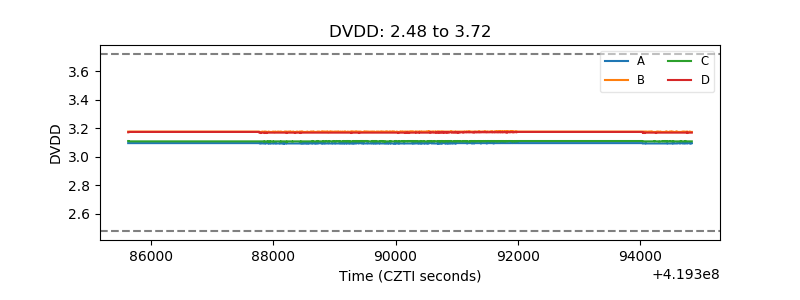 |
| Temperature 1 | 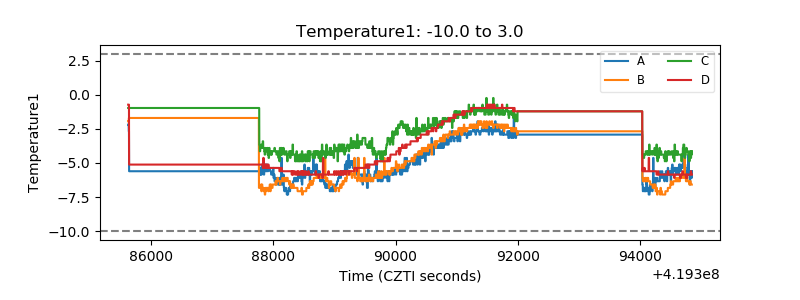 |
| Veto HV Monitor | 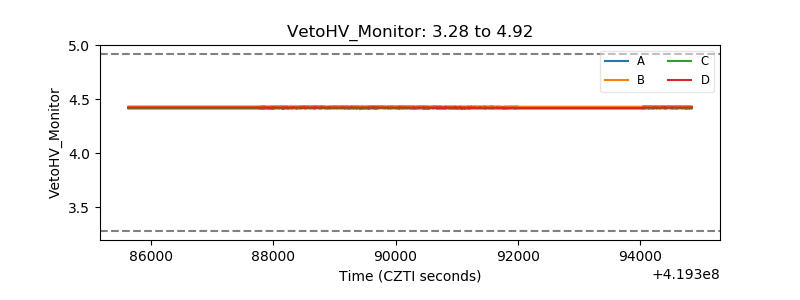 |
| Veto LLD | 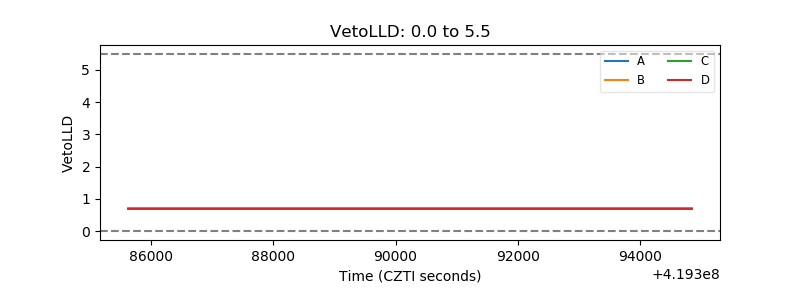 |
| Alpha Counter |  |
| _CPM_Rate | 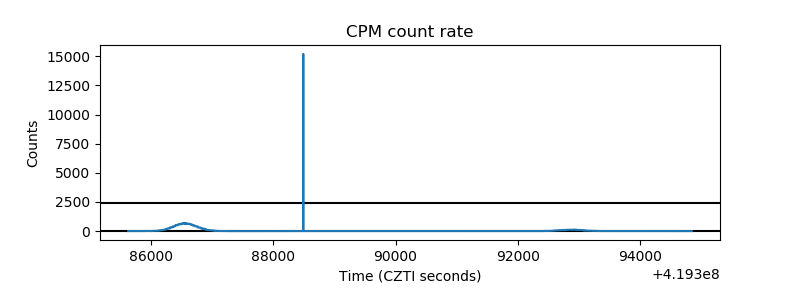 |
| CZT Counter | 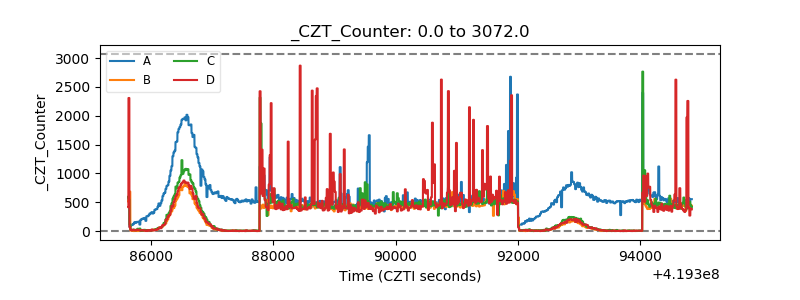 |
| +2.5 Volts monitor | 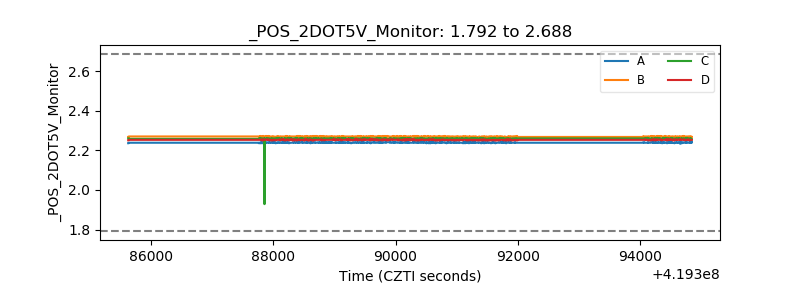 |
| +5 Volts monitor | 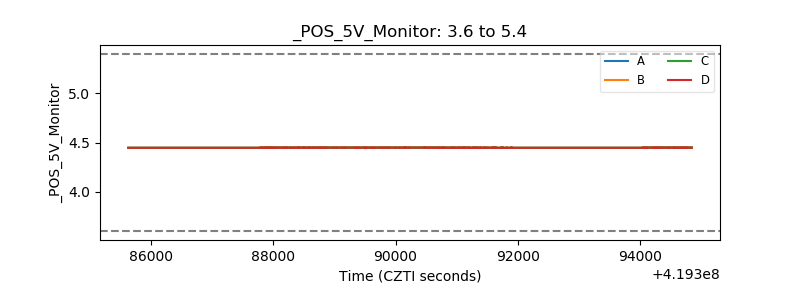 |
| _ROLL_ROT | 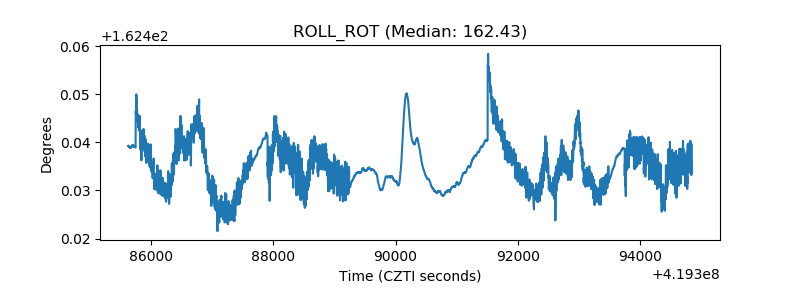 |
| _Roll_DEC | 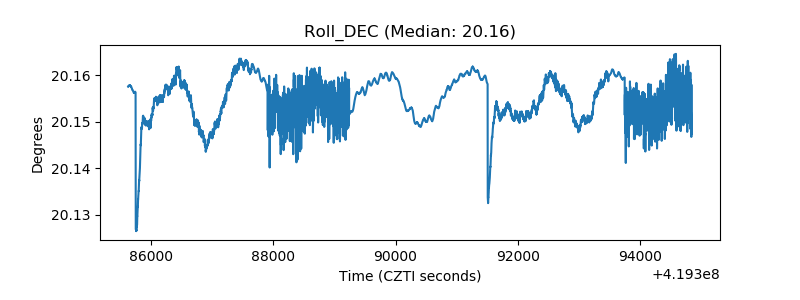 |
| _Roll_RA | 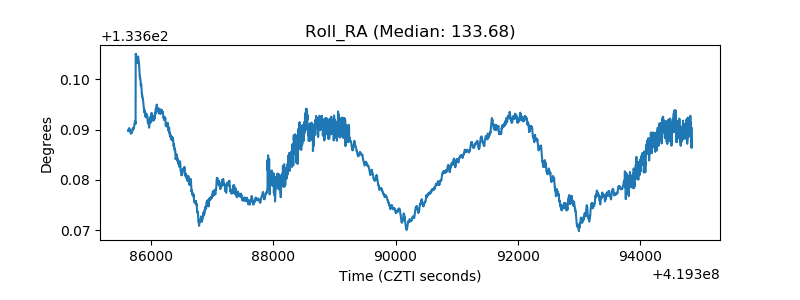 |
| Veto Counter | 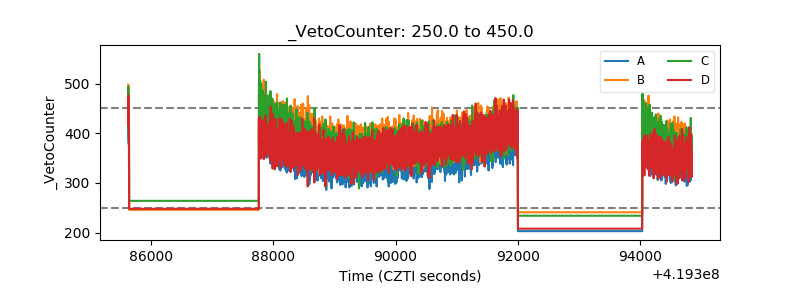 |