| Param | Original file | Final file |
|---|---|---|
| Filename | modeM0/AS1A12_104T02_9000005572_40826cztM0_level2.fits | modeM0/AS1A12_104T02_9000005572_40826cztM0_level2_quad_clean.evt |
| Size (bytes) | 298,978,560 | 85,752,000 |
| Size | 285.1 MB | 81.8 MB |
| Events in quadrant A | 2,844,205 | 569,139 |
| Events in quadrant B | 2,352,807 | 590,564 |
| Events in quadrant C | 2,663,297 | 559,443 |
| Events in quadrant D | 2,797,415 | 509,573 |
| Mode M9 | |||
|---|---|---|---|
| Quadrant | BADHDUFLAG | Total packets | Discarded packets |
| A | 0 | 30 | 0 |
| B | 0 | 30 | 0 |
| C | 0 | 30 | 0 |
| D | 0 | 31 | 0 |
| Mode M0 | |||
|---|---|---|---|
| Quadrant | BADHDUFLAG | Total packets | Discarded packets |
| A | 0 | 11469 | 3 |
| B | 0 | 10652 | 2 |
| C | 0 | 11171 | 2 |
| D | 0 | 12169 | 2 |
| Mode SS | |||
|---|---|---|---|
| Quadrant | BADHDUFLAG | Total packets | Discarded packets |
| A | 0 | 108 | 0 |
| B | 0 | 108 | 0 |
| C | 0 | 108 | 0 |
| D | 0 | 108 | 0 |
| Quadrant | Total seconds | Saturated seconds | Saturation percentage |
|---|---|---|---|
| A | 5250 | 24 | 0.457143% |
| B | 5250 | 8 | 0.152381% |
| C | 5250 | 34 | 0.647619% |
| D | 5250 | 101 | 1.923810% |
Noise dominated data is calculated using 1-second bins in cleaned event files. If a bin has >2000 counts, and if more than 50% of those come from <1% of pixels, then it is considered to be noise-dominated and hence unusable.
| Quadrant | # 1 sec bins | Bins with >0 counts | Bins with >2000 counts | High rate bins dominated by noise | Noise dominated (total time) | Noise dominated (detector-on time) | Marked lightcurve |
|---|---|---|---|---|---|---|---|
| A | 6983 | 5251 | 14 | 14 | 0.20% | 0.27% | 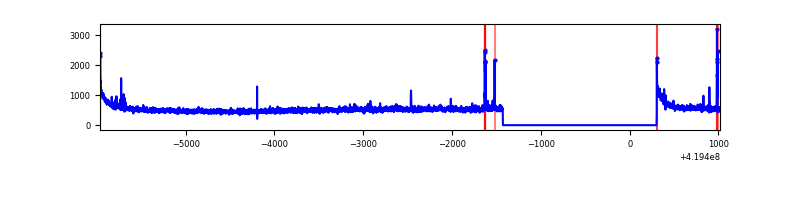 |
| B | 6983 | 5251 | 1 | 1 | 0.01% | 0.02% | 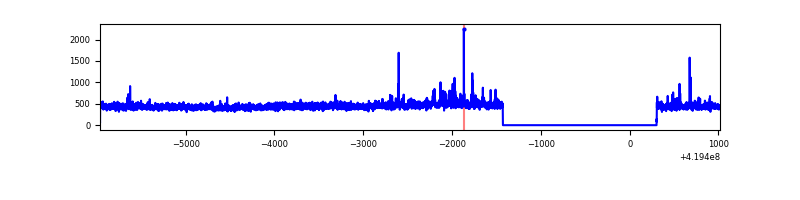 |
| C | 6983 | 5251 | 32 | 32 | 0.46% | 0.61% | 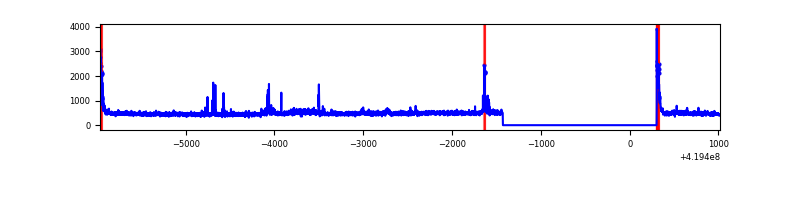 |
| D | 6983 | 5251 | 88 | 88 | 1.26% | 1.68% | 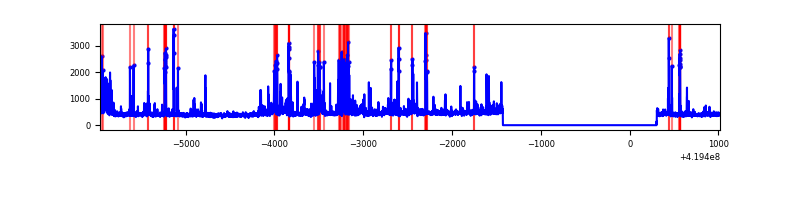 |
Top three noisy pixels from each quadrant. If the there are fewer than three noisy pixels in the level2.evt file, extra rows are filled as -1
| Pixel properties | Quadrant properties | ||||||
|---|---|---|---|---|---|---|---|
| Quadrant | DetID | PixID | Counts | Sigma | Mean | Median | Sigma |
| A | 10 | 83 | 490044 | 4054.73 | 579 | 567 | 120.7 |
| A | 13 | 248 | 57190 | 469.05 | 579 | 567 | 120.7 |
| A | 15 | 191 | 41301 | 337.43 | 579 | 567 | 120.7 |
| B | 0 | 190 | 52269 | 460.02 | 576 | 560 | 112.4 |
| B | 0 | 230 | 16814 | 144.6 | 576 | 560 | 112.4 |
| B | 12 | 111 | 14361 | 122.78 | 576 | 560 | 112.4 |
| C | 15 | 214 | 226030 | 1703.18 | 563 | 566 | 132.4 |
| C | 0 | 10 | 117790 | 885.52 | 563 | 566 | 132.4 |
| C | 14 | 254 | 105952 | 796.1 | 563 | 566 | 132.4 |
| D | 13 | 249 | 384039 | 2763.3 | 559 | 543 | 138.8 |
| D | 2 | 249 | 162548 | 1167.34 | 559 | 543 | 138.8 |
| D | 2 | 153 | 35833 | 254.28 | 559 | 543 | 138.8 |
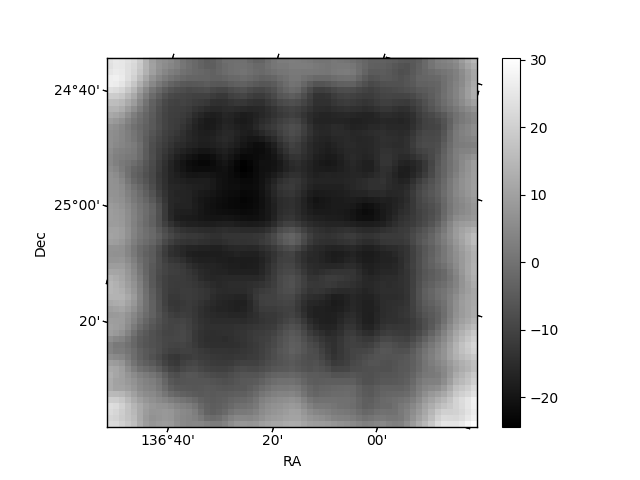
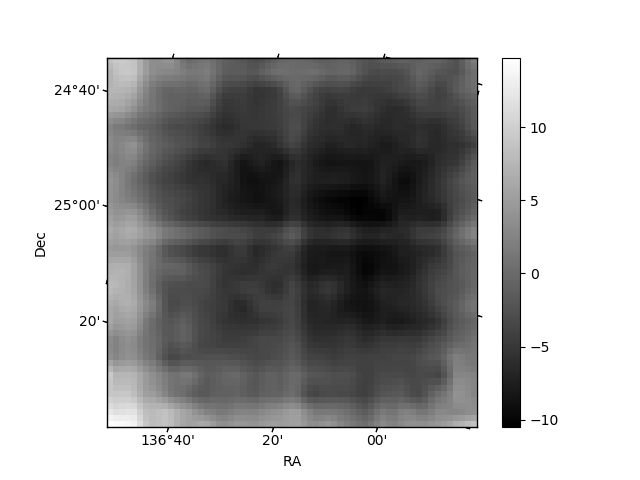
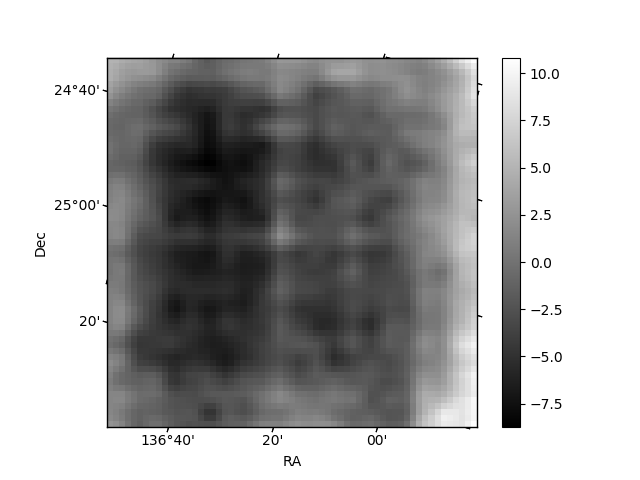
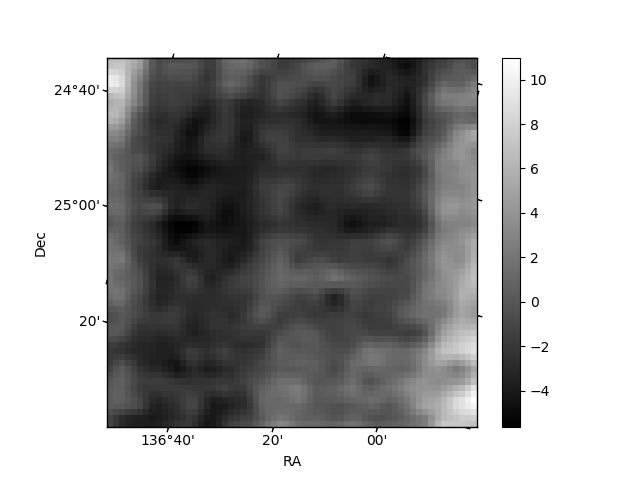
Histogram calculated using DETX and DETY for each event in the final _common_clean file
| Quadrant A | 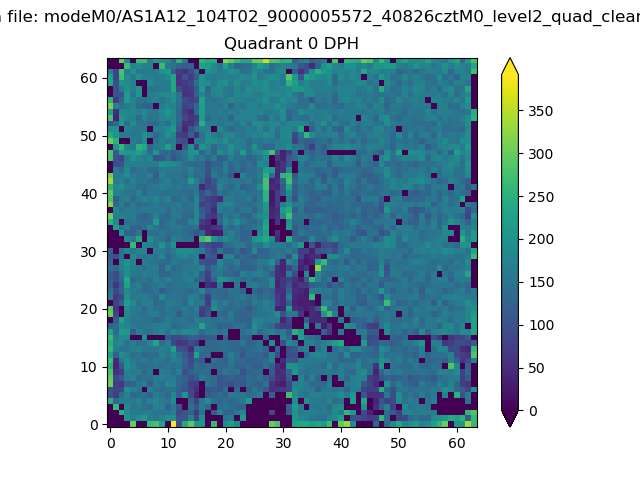 |
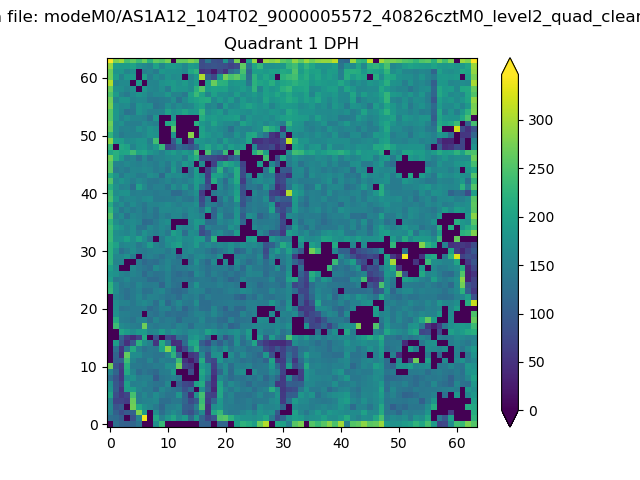 |
Quadrant B |
|---|---|---|---|
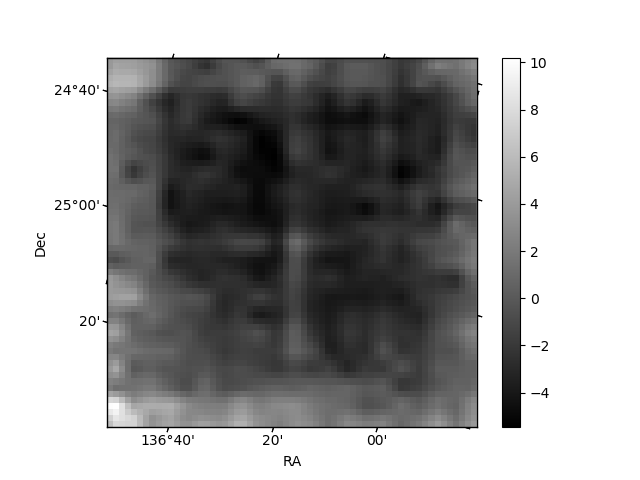
| Quadrant D |  |
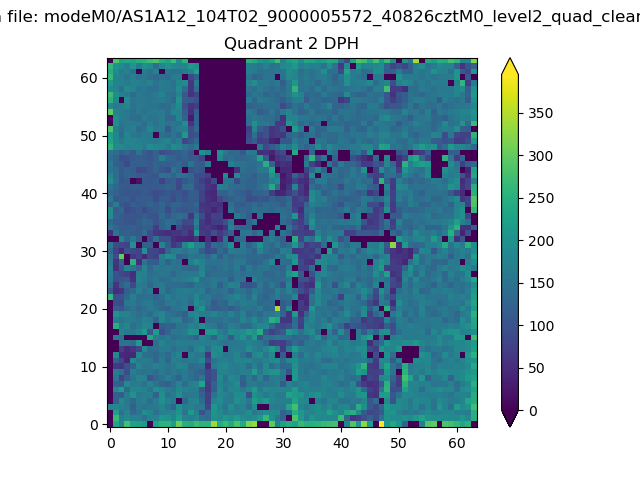 |
Quadrant C |
| Plot type | Count rate plots | Images |
|---|---|---|
| Comparison with Poisson distribution Blue bars denote a histogram of data divided into 1 sec bins. Red curve is a Poisson curve with rate = median count rate of data. |
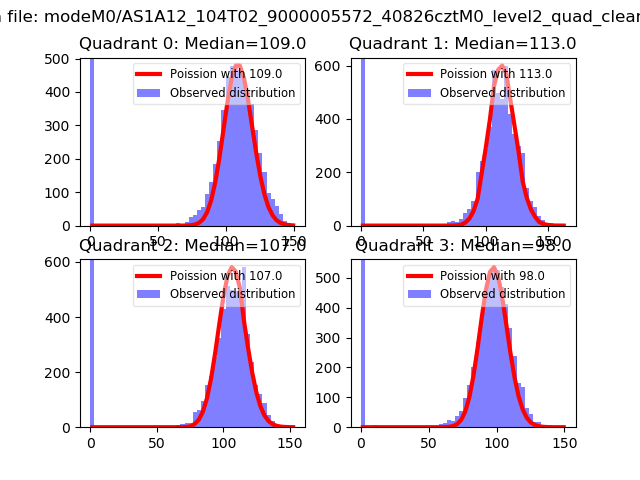 |
 |
| Quadrant-wise count rates Data is divided into 100 sec bins |
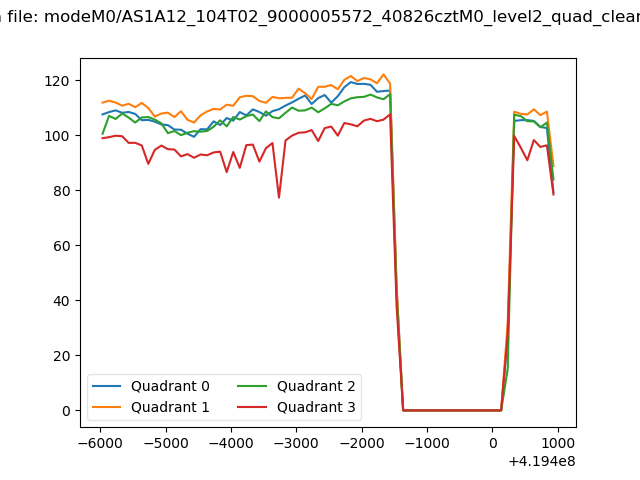 |
|
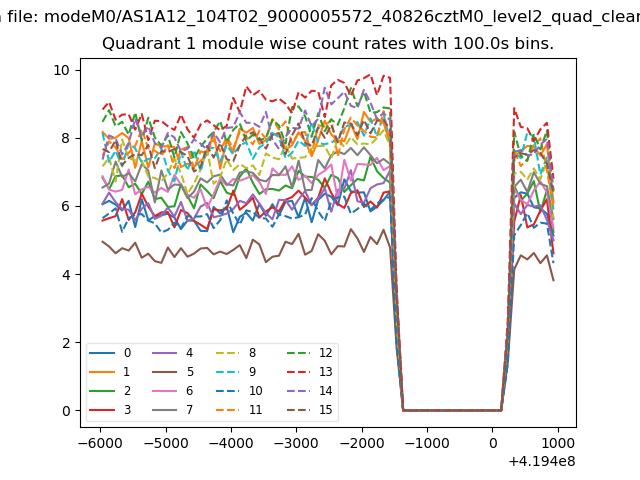
| Module-wise count rates for Quadrant A Data is divided into 100 sec bins |
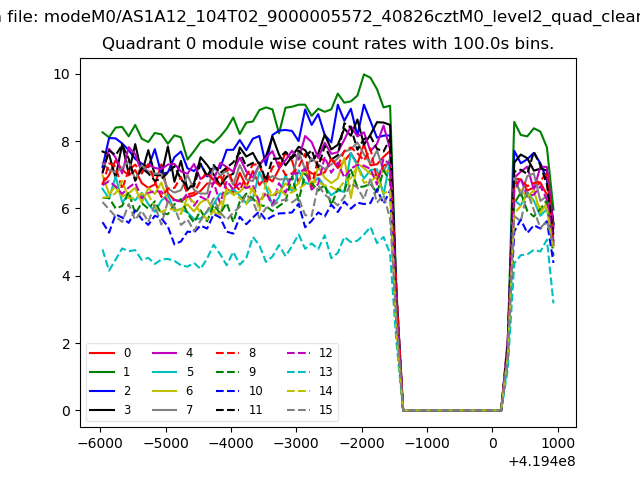 |
 |
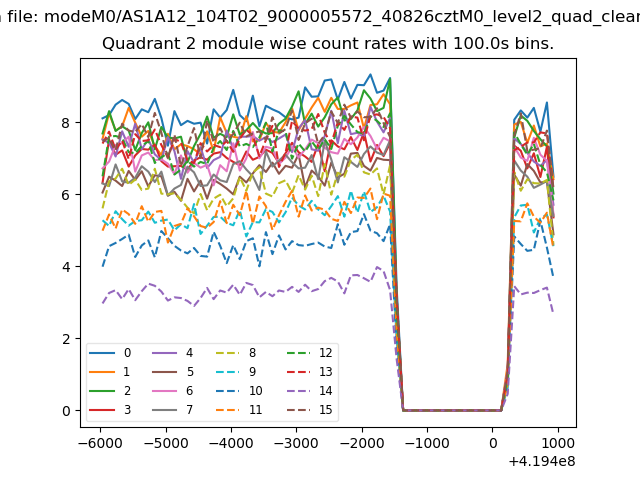
| Module-wise count rates for Quadrant B Data is divided into 100 sec bins |
 |
 |
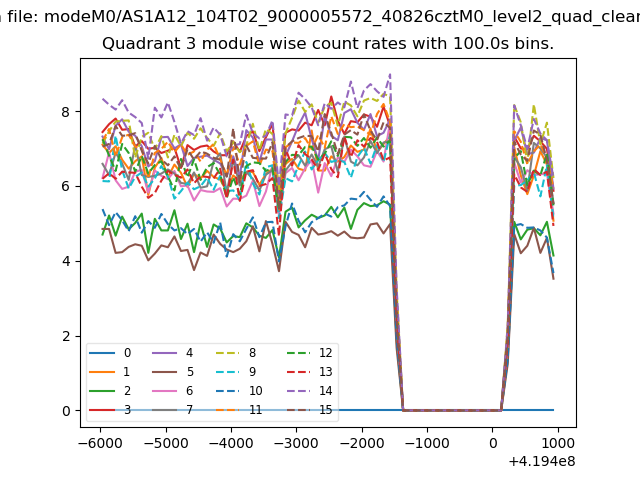
| Module-wise count rates for Quadrant C Data is divided into 100 sec bins |
 |
 |
| Module-wise count rates for Quadrant D Data is divided into 100 sec bins |
 |
 |
| Parameter | Plot |
|---|---|
| CZT HV Monitor | 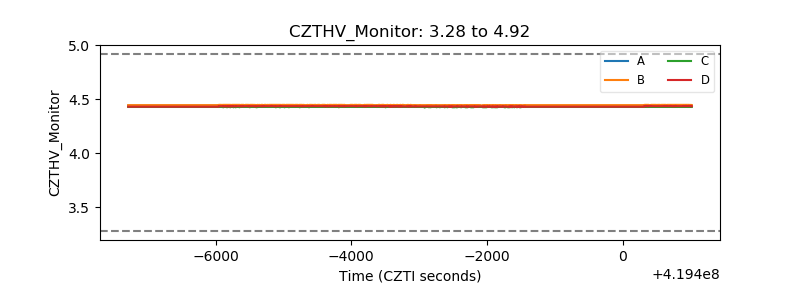 |
| D_VDD | 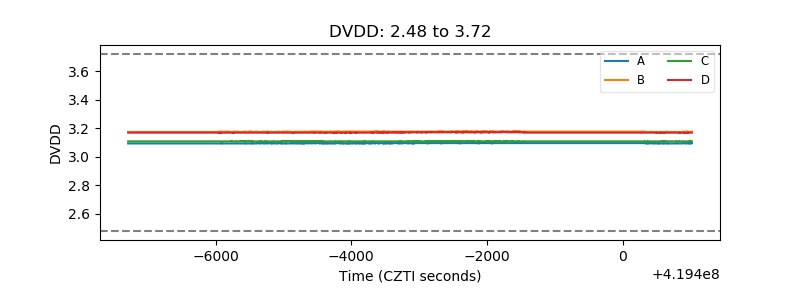 |
| Temperature 1 |  |
| Veto HV Monitor | 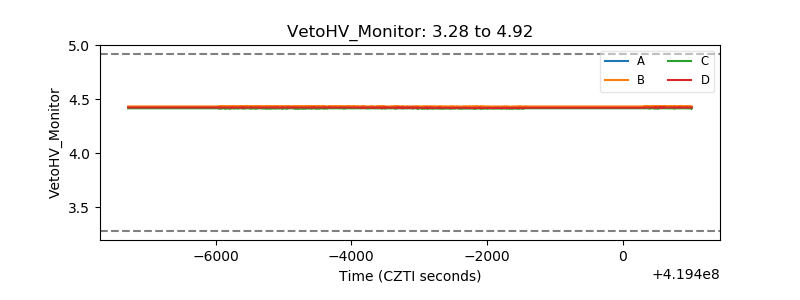 |
| Veto LLD | 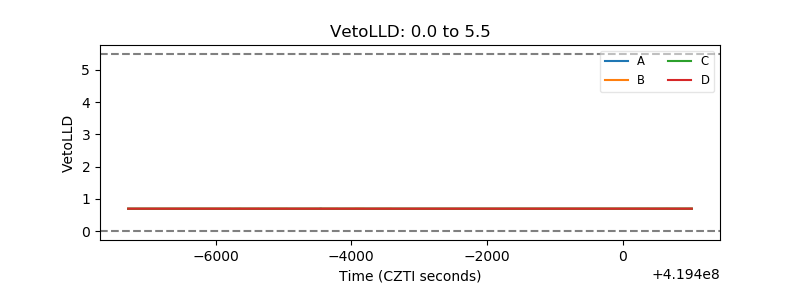 |
| Alpha Counter |  |
| _CPM_Rate | 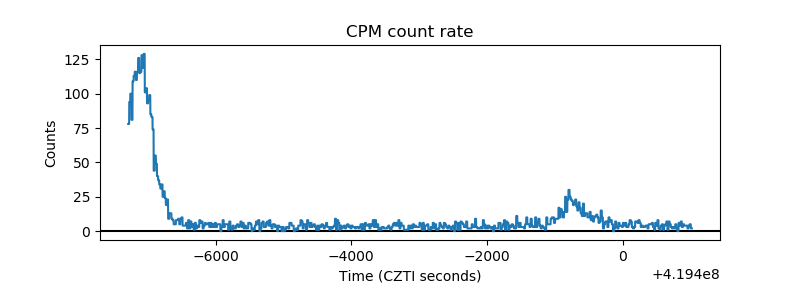 |
| CZT Counter | 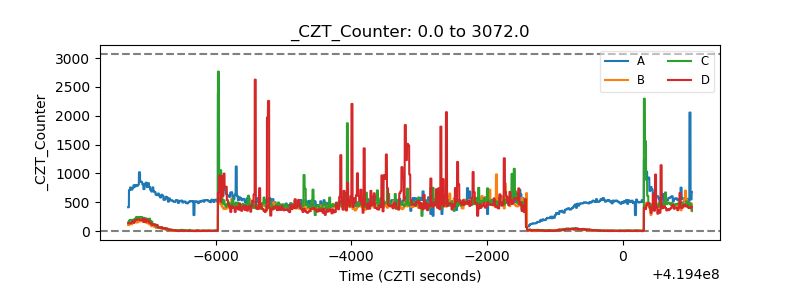 |
| +2.5 Volts monitor | 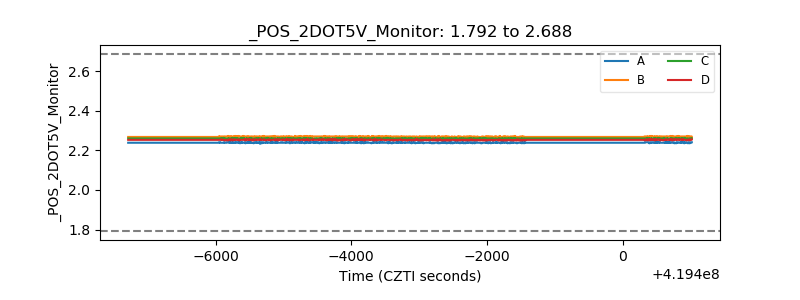 |
| +5 Volts monitor |  |
| _ROLL_ROT | 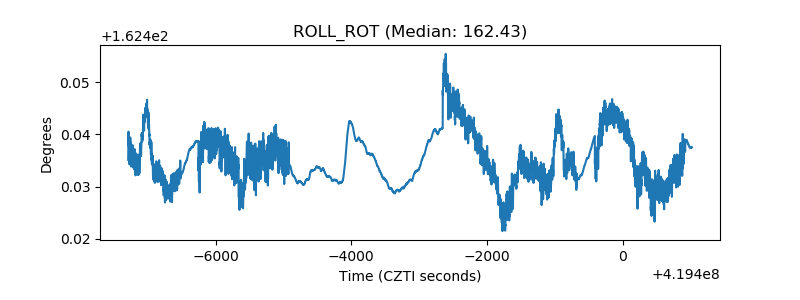 |
| _Roll_DEC | 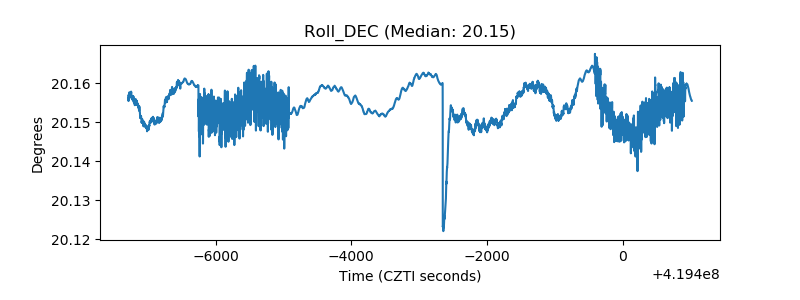 |
| _Roll_RA | 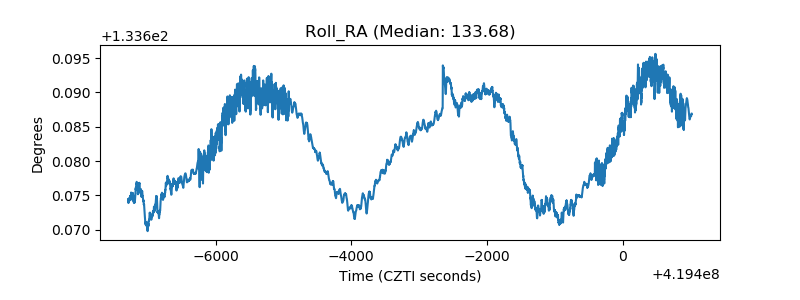 |
| Veto Counter | 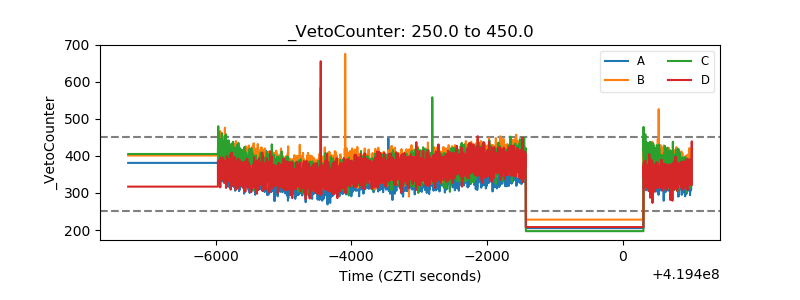 |