| Param | Original file | Final file |
|---|---|---|
| Filename | modeM0/AS1A12_104T02_9000005572_40828cztM0_level2.fits | modeM0/AS1A12_104T02_9000005572_40828cztM0_level2_quad_clean.evt |
| Size (bytes) | 338,734,080 | 98,536,320 |
| Size | 323.0 MB | 94.0 MB |
| Events in quadrant A | 3,295,448 | 655,032 |
| Events in quadrant B | 2,724,181 | 675,754 |
| Events in quadrant C | 3,014,309 | 640,882 |
| Events in quadrant D | 3,029,081 | 585,525 |
| Mode M9 | |||
|---|---|---|---|
| Quadrant | BADHDUFLAG | Total packets | Discarded packets |
| A | 0 | 27 | 0 |
| B | 0 | 27 | 0 |
| C | 0 | 27 | 0 |
| D | 0 | 27 | 0 |
| Mode M0 | |||
|---|---|---|---|
| Quadrant | BADHDUFLAG | Total packets | Discarded packets |
| A | 0 | 13342 | 2 |
| B | 0 | 12305 | 1 |
| C | 0 | 12738 | 1 |
| D | 0 | 13314 | 1 |
| Mode SS | |||
|---|---|---|---|
| Quadrant | BADHDUFLAG | Total packets | Discarded packets |
| A | 0 | 126 | 0 |
| B | 0 | 126 | 0 |
| C | 0 | 126 | 0 |
| D | 0 | 126 | 0 |
| Quadrant | Total seconds | Saturated seconds | Saturation percentage |
|---|---|---|---|
| A | 6107 | 41 | 0.671361% |
| B | 6107 | 5 | 0.081873% |
| C | 6107 | 51 | 0.835107% |
| D | 6107 | 67 | 1.097102% |
Noise dominated data is calculated using 1-second bins in cleaned event files. If a bin has >2000 counts, and if more than 50% of those come from <1% of pixels, then it is considered to be noise-dominated and hence unusable.
| Quadrant | # 1 sec bins | Bins with >0 counts | Bins with >2000 counts | High rate bins dominated by noise | Noise dominated (total time) | Noise dominated (detector-on time) | Marked lightcurve |
|---|---|---|---|---|---|---|---|
| A | 8790 | 6109 | 25 | 25 | 0.28% | 0.41% | 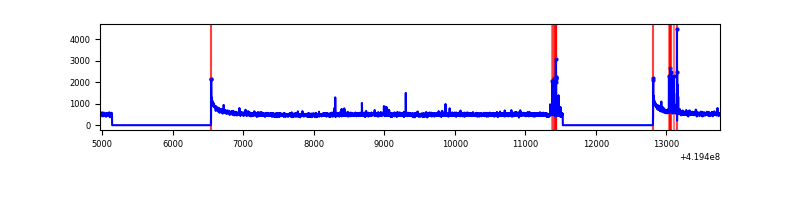 |
| B | 8790 | 6109 | 1 | 1 | 0.01% | 0.02% | 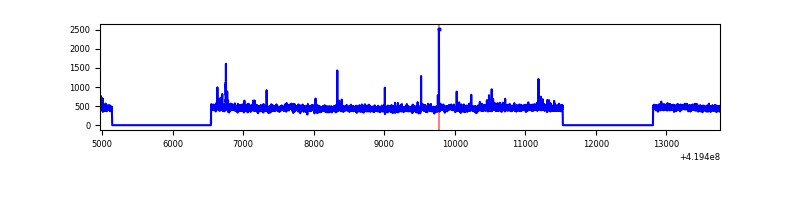 |
| C | 8790 | 6109 | 40 | 40 | 0.46% | 0.65% | 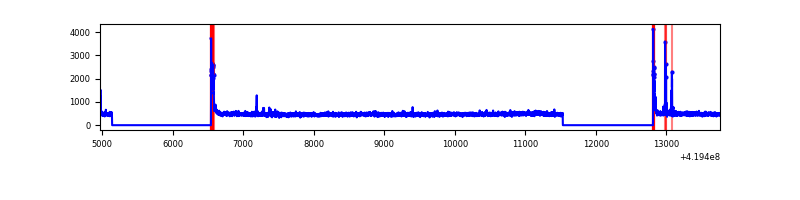 |
| D | 8790 | 6109 | 41 | 41 | 0.47% | 0.67% | 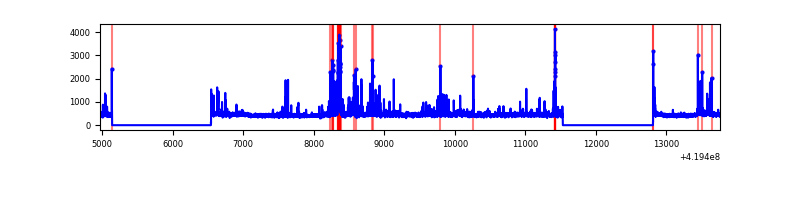 |
Top three noisy pixels from each quadrant. If the there are fewer than three noisy pixels in the level2.evt file, extra rows are filled as -1
| Pixel properties | Quadrant properties | ||||||
|---|---|---|---|---|---|---|---|
| Quadrant | DetID | PixID | Counts | Sigma | Mean | Median | Sigma |
| A | 10 | 83 | 542832 | 3888.61 | 673 | 659 | 139.4 |
| A | 13 | 248 | 124623 | 889.1 | 673 | 659 | 139.4 |
| A | 13 | 6 | 13474 | 91.91 | 673 | 659 | 139.4 |
| B | 0 | 230 | 37877 | 282.73 | 670 | 651 | 131.7 |
| B | 0 | 190 | 31200 | 232.02 | 670 | 651 | 131.7 |
| B | 12 | 111 | 16825 | 122.84 | 670 | 651 | 131.7 |
| C | 15 | 214 | 261259 | 1691.67 | 656 | 660 | 154.0 |
| C | 0 | 10 | 129725 | 837.82 | 656 | 660 | 154.0 |
| C | 14 | 254 | 42991 | 274.79 | 656 | 660 | 154.0 |
| D | 2 | 249 | 224821 | 1381.63 | 654 | 634 | 162.3 |
| D | 13 | 249 | 101260 | 620.14 | 654 | 634 | 162.3 |
| D | 1 | 47 | 64045 | 390.79 | 654 | 634 | 162.3 |
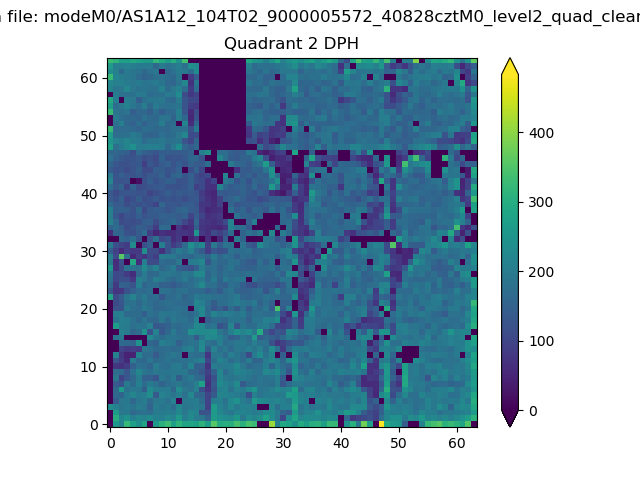
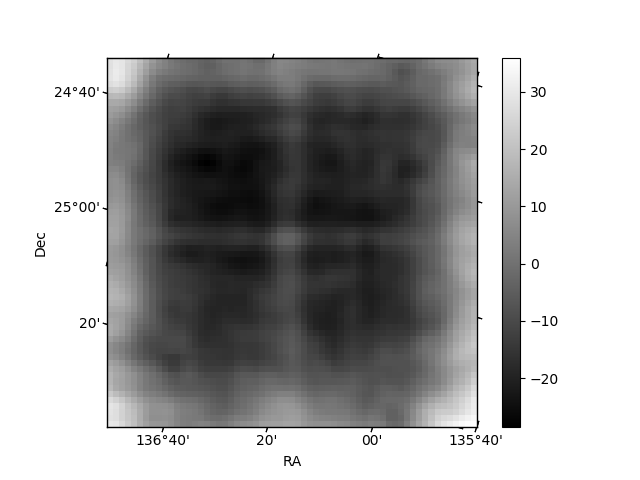
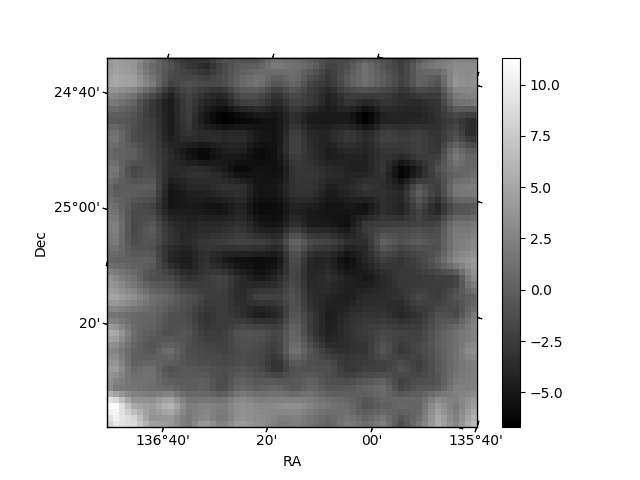
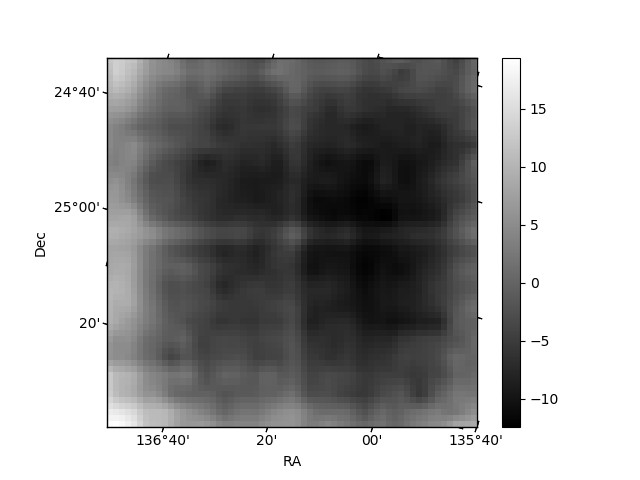
Histogram calculated using DETX and DETY for each event in the final _common_clean file
| Quadrant A | 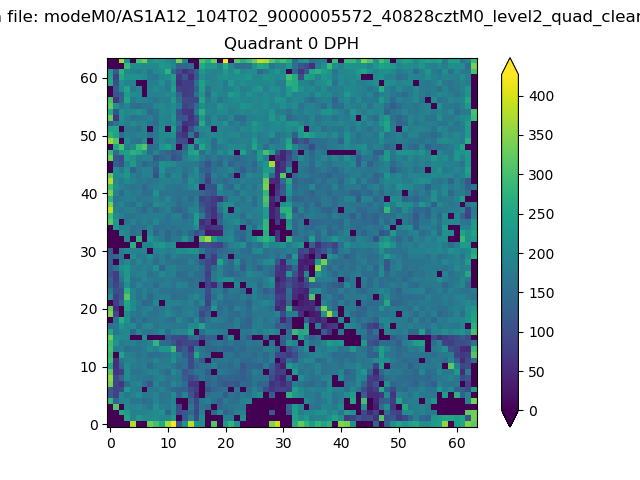 |
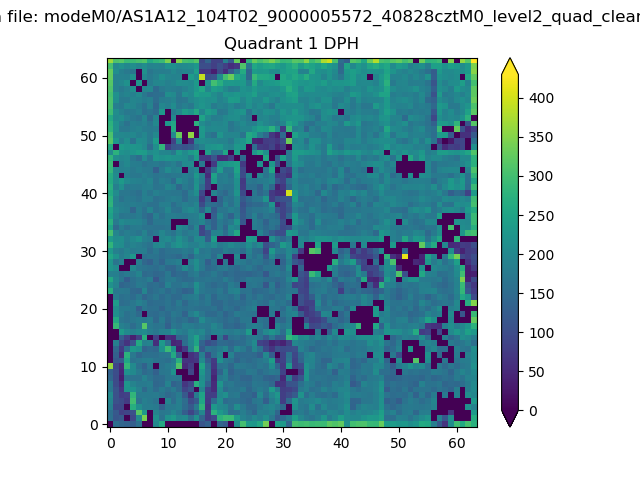 |
Quadrant B |
|---|---|---|---|
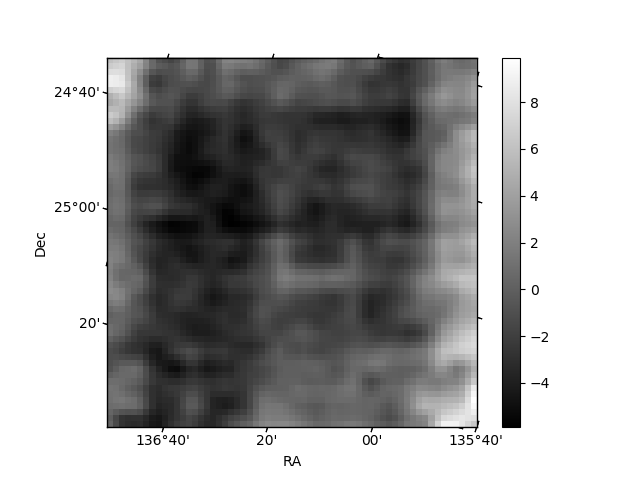
| Quadrant D | 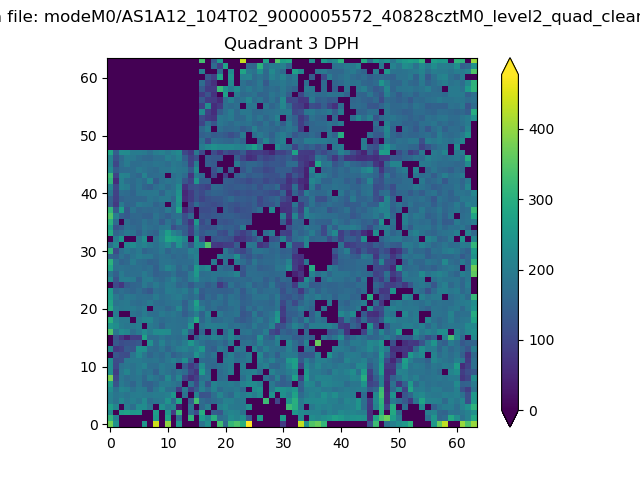 |
 |
Quadrant C |
| Plot type | Count rate plots | Images |
|---|---|---|
| Comparison with Poisson distribution Blue bars denote a histogram of data divided into 1 sec bins. Red curve is a Poisson curve with rate = median count rate of data. |
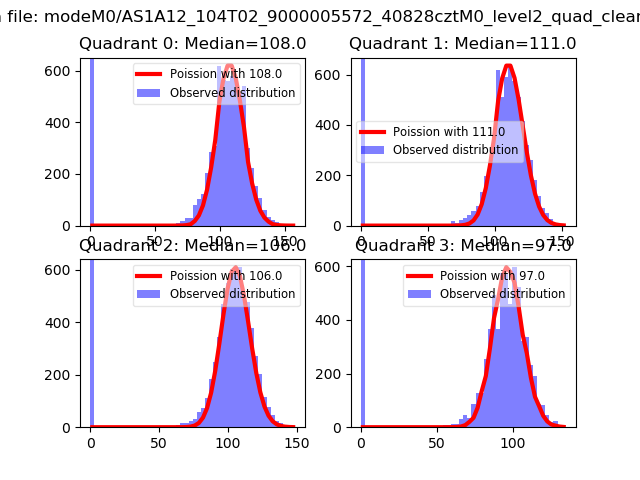 |
 |
| Quadrant-wise count rates Data is divided into 100 sec bins |
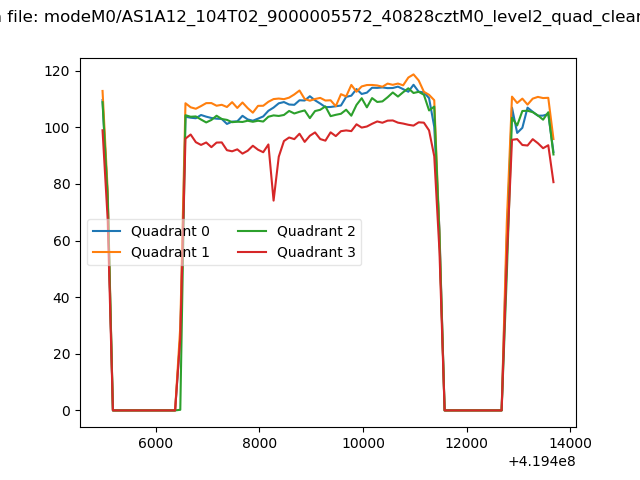 |
|
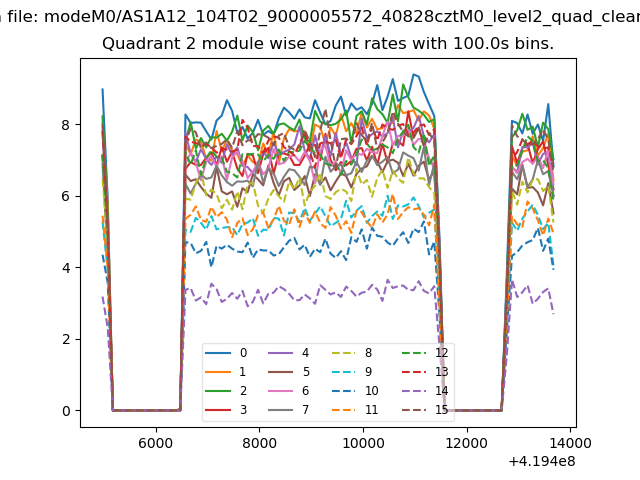
| Module-wise count rates for Quadrant A Data is divided into 100 sec bins |
 |
 |
| Module-wise count rates for Quadrant B Data is divided into 100 sec bins |
 |
 |
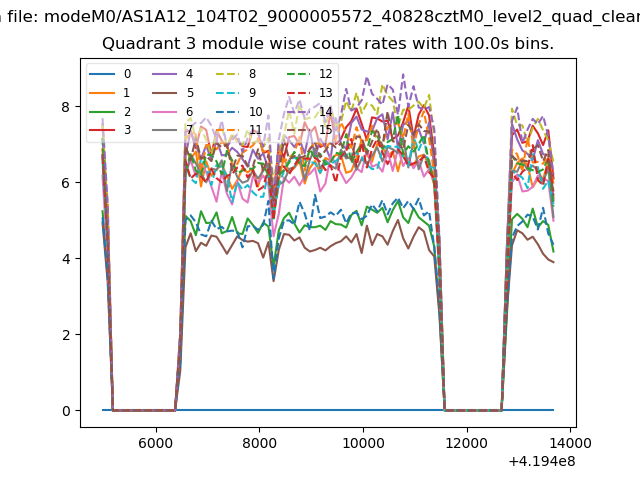
| Module-wise count rates for Quadrant C Data is divided into 100 sec bins |
 |
 |
| Module-wise count rates for Quadrant D Data is divided into 100 sec bins |
 |
 |
| Parameter | Plot |
|---|---|
| CZT HV Monitor | 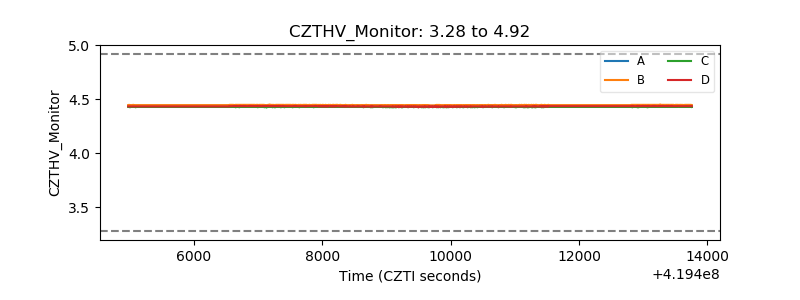 |
| D_VDD | 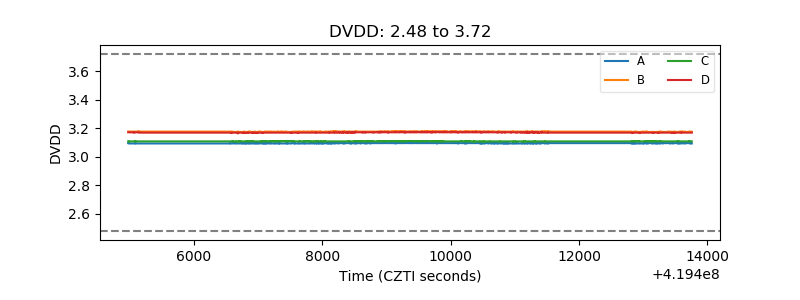 |
| Temperature 1 | 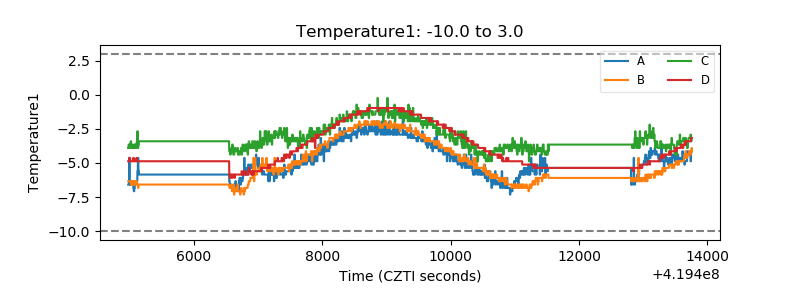 |
| Veto HV Monitor | 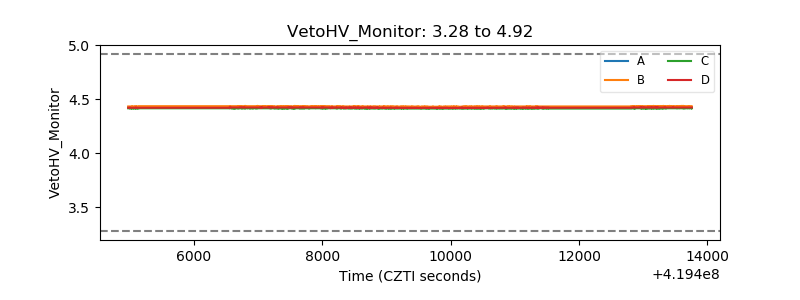 |
| Veto LLD | 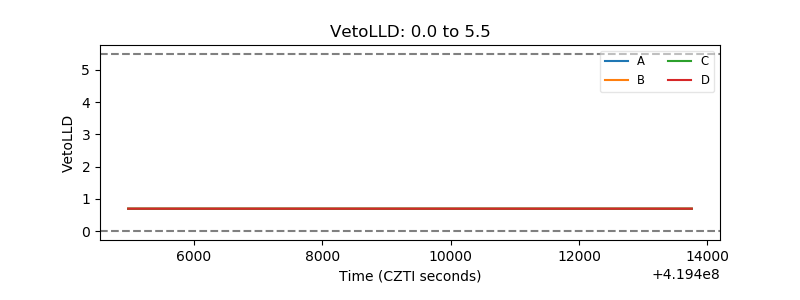 |
| Alpha Counter |  |
| _CPM_Rate |  |
| CZT Counter | 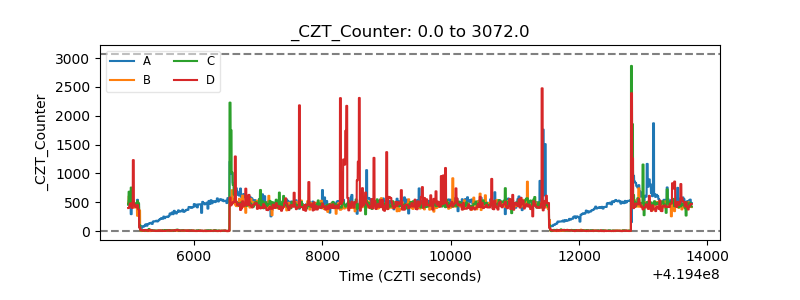 |
| +2.5 Volts monitor | 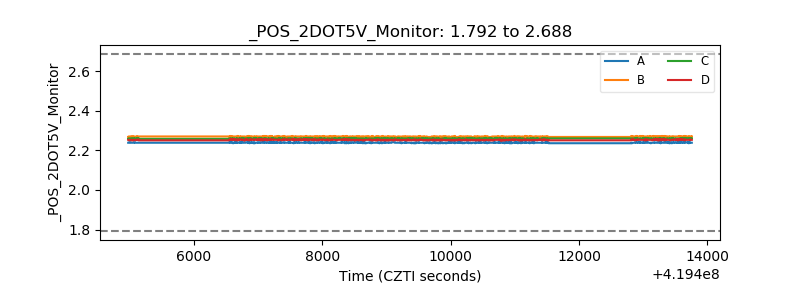 |
| +5 Volts monitor | 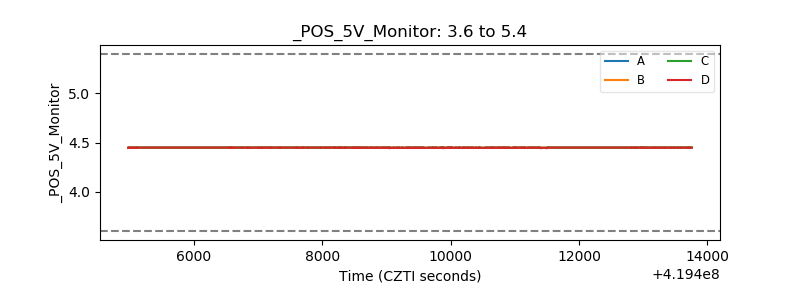 |
| _ROLL_ROT | 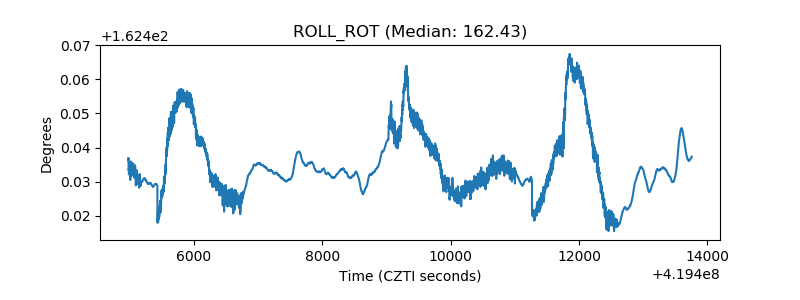 |
| _Roll_DEC | 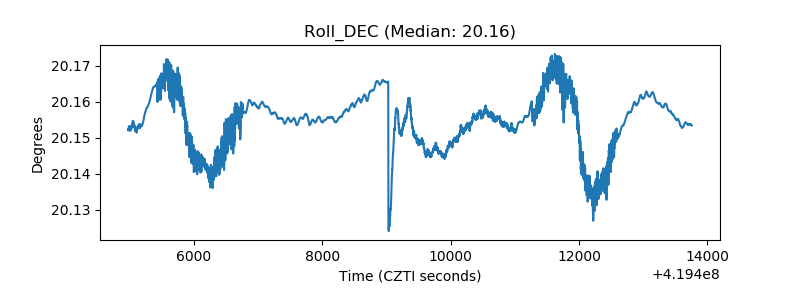 |
| _Roll_RA | 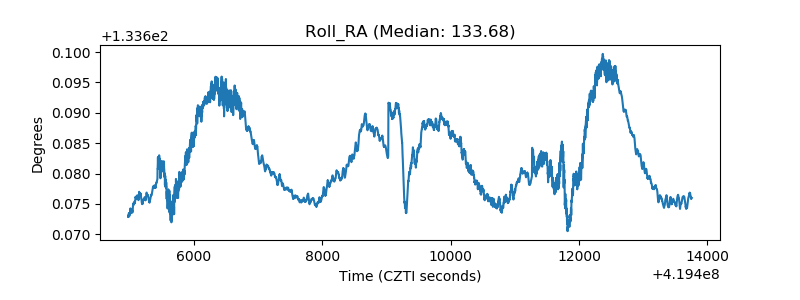 |
| Veto Counter | 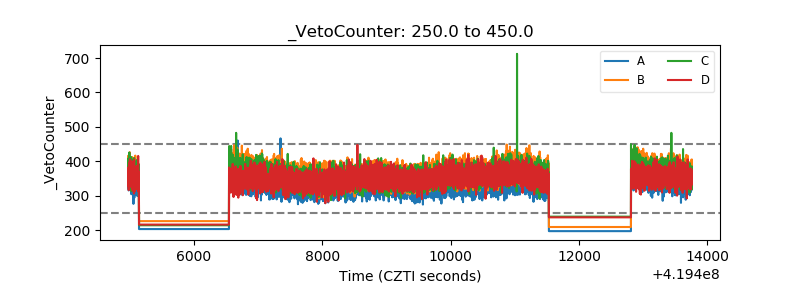 |