| Param | Original file | Final file |
|---|---|---|
| Filename | modeM0/AS1A12_104T02_9000005572_40831cztM0_level2.fits | modeM0/AS1A12_104T02_9000005572_40831cztM0_level2_quad_clean.evt |
| Size (bytes) | 926,176,320 | 250,254,720 |
| Size | 883.3 MB | 238.7 MB |
| Events in quadrant A | 8,437,969 | 1,678,880 |
| Events in quadrant B | 7,139,600 | 1,723,169 |
| Events in quadrant C | 7,494,381 | 1,637,726 |
| Events in quadrant D | 9,994,800 | 1,453,937 |
| Mode M9 | |||
|---|---|---|---|
| Quadrant | BADHDUFLAG | Total packets | Discarded packets |
| A | 0 | 48 | 0 |
| B | 0 | 48 | 0 |
| C | 0 | 48 | 0 |
| D | 0 | 49 | 0 |
| Mode M0 | |||
|---|---|---|---|
| Quadrant | BADHDUFLAG | Total packets | Discarded packets |
| A | 0 | 34356 | 4 |
| B | 0 | 32176 | 3 |
| C | 0 | 32217 | 3 |
| D | 0 | 40575 | 3 |
| Mode SS | |||
|---|---|---|---|
| Quadrant | BADHDUFLAG | Total packets | Discarded packets |
| A | 0 | 318 | 0 |
| B | 0 | 318 | 0 |
| C | 0 | 318 | 0 |
| D | 0 | 318 | 0 |
| Quadrant | Total seconds | Saturated seconds | Saturation percentage |
|---|---|---|---|
| A | 15706 | 67 | 0.426589% |
| B | 15706 | 44 | 0.280148% |
| C | 15706 | 67 | 0.426589% |
| D | 15706 | 720 | 4.584235% |
Noise dominated data is calculated using 1-second bins in cleaned event files. If a bin has >2000 counts, and if more than 50% of those come from <1% of pixels, then it is considered to be noise-dominated and hence unusable.
| Quadrant | # 1 sec bins | Bins with >0 counts | Bins with >2000 counts | High rate bins dominated by noise | Noise dominated (total time) | Noise dominated (detector-on time) | Marked lightcurve |
|---|---|---|---|---|---|---|---|
| A | 19884 | 15709 | 32 | 32 | 0.16% | 0.20% | 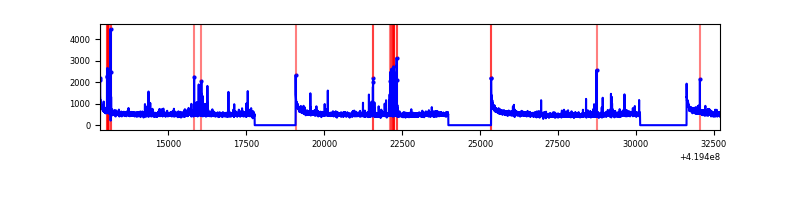 |
| B | 19884 | 15709 | 18 | 18 | 0.09% | 0.11% | 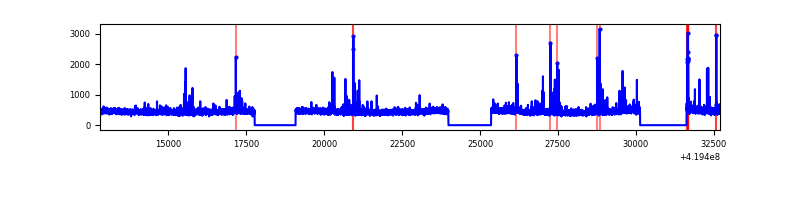 |
| C | 19884 | 15709 | 44 | 44 | 0.22% | 0.28% | 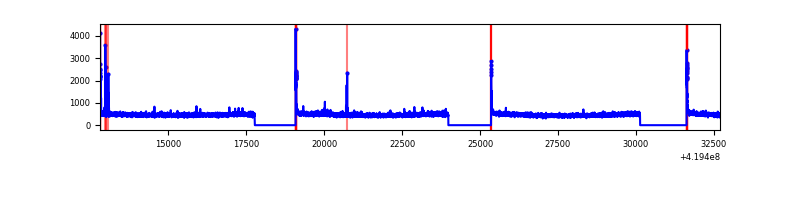 |
| D | 19884 | 15709 | 577 | 577 | 2.90% | 3.67% | 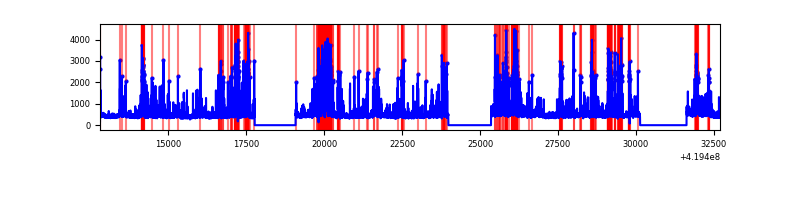 |
Top three noisy pixels from each quadrant. If the there are fewer than three noisy pixels in the level2.evt file, extra rows are filled as -1
| Pixel properties | Quadrant properties | ||||||
|---|---|---|---|---|---|---|---|
| Quadrant | DetID | PixID | Counts | Sigma | Mean | Median | Sigma |
| A | 10 | 83 | 1342909 | 3808.7 | 1722 | 1686 | 352.1 |
| A | 13 | 248 | 217333 | 612.38 | 1722 | 1686 | 352.1 |
| A | 2 | 79 | 112458 | 314.56 | 1722 | 1686 | 352.1 |
| B | 0 | 190 | 206646 | 621.44 | 1709 | 1660 | 329.9 |
| B | 5 | 255 | 78807 | 233.88 | 1709 | 1660 | 329.9 |
| B | 0 | 230 | 70907 | 209.93 | 1709 | 1660 | 329.9 |
| C | 15 | 214 | 662047 | 1685.57 | 1681 | 1690 | 391.8 |
| C | 0 | 10 | 176578 | 446.4 | 1681 | 1690 | 391.8 |
| C | 14 | 254 | 55822 | 138.17 | 1681 | 1690 | 391.8 |
| D | 13 | 249 | 1737041 | 4299.57 | 1648 | 1598 | 403.6 |
| D | 2 | 249 | 985754 | 2438.25 | 1648 | 1598 | 403.6 |
| D | 2 | 16 | 263228 | 648.19 | 1648 | 1598 | 403.6 |
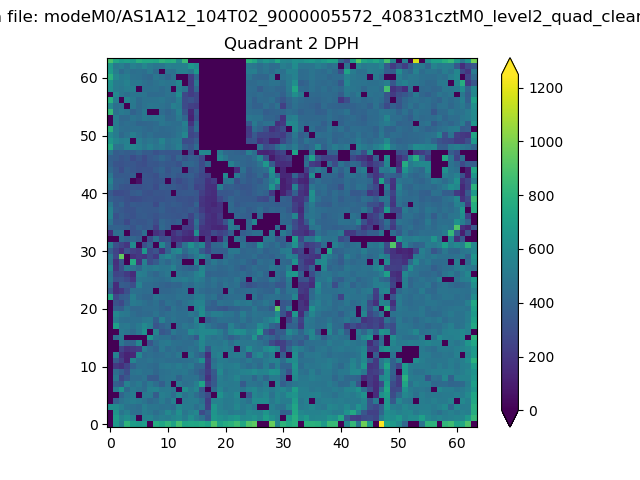
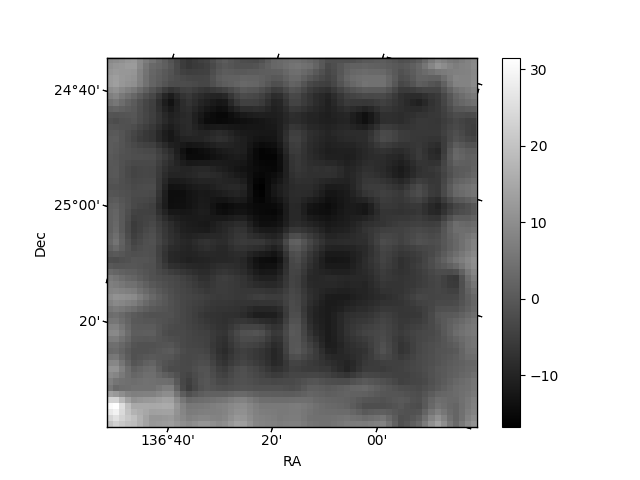
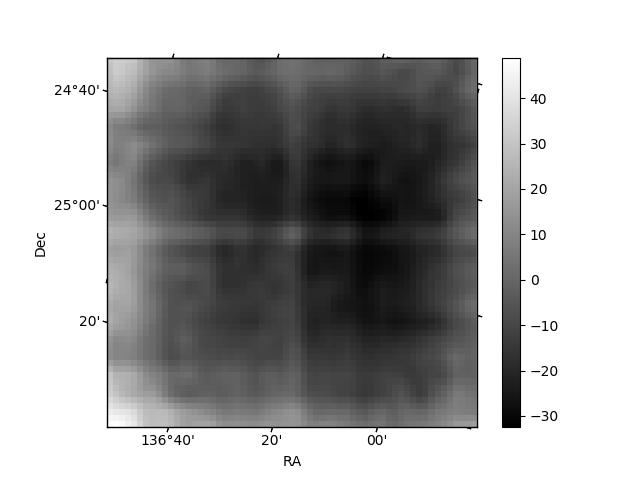
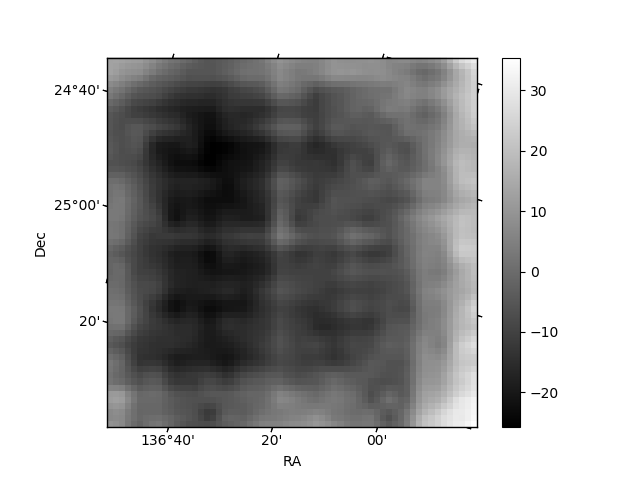
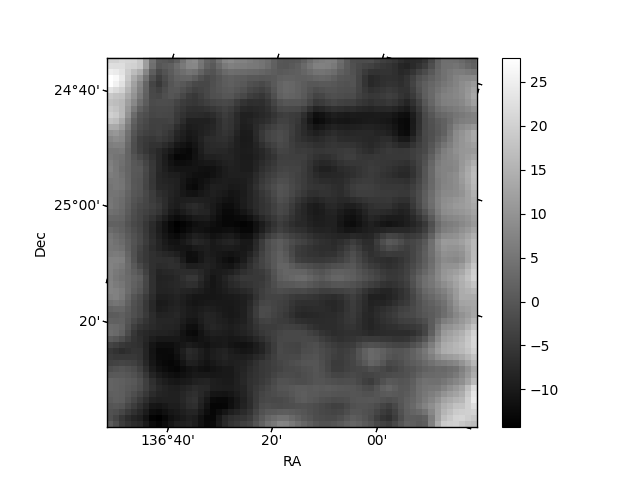
Histogram calculated using DETX and DETY for each event in the final _common_clean file
| Quadrant A | 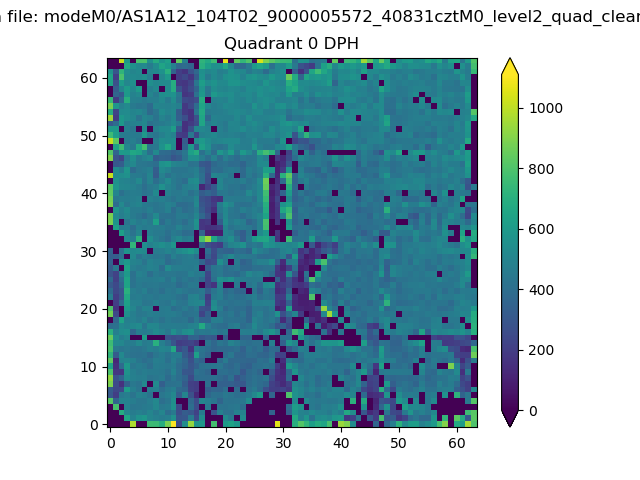 |
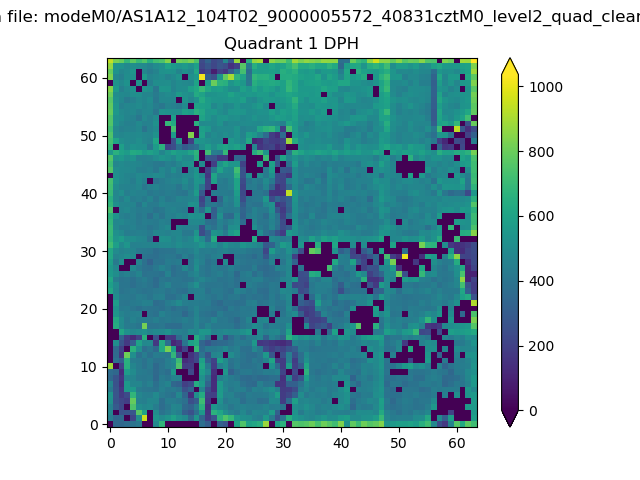 |
Quadrant B |
|---|---|---|---|
| Quadrant D | 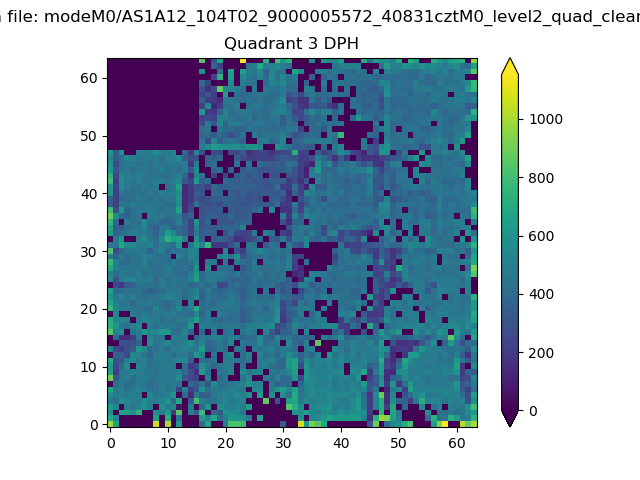 |
 |
Quadrant C |
| Plot type | Count rate plots | Images |
|---|---|---|
| Comparison with Poisson distribution Blue bars denote a histogram of data divided into 1 sec bins. Red curve is a Poisson curve with rate = median count rate of data. |
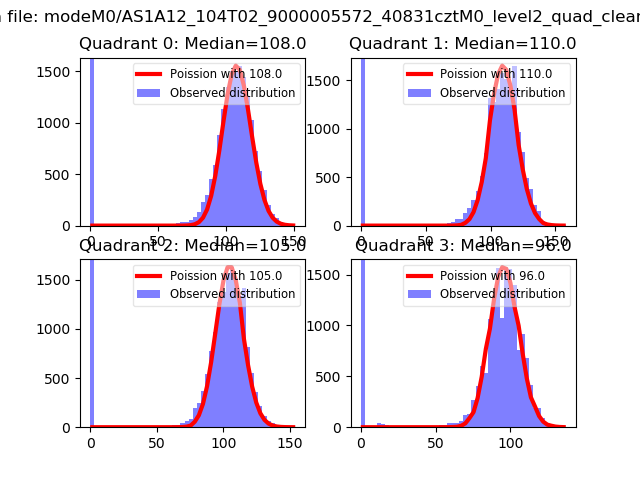 |
 |
| Quadrant-wise count rates Data is divided into 100 sec bins |
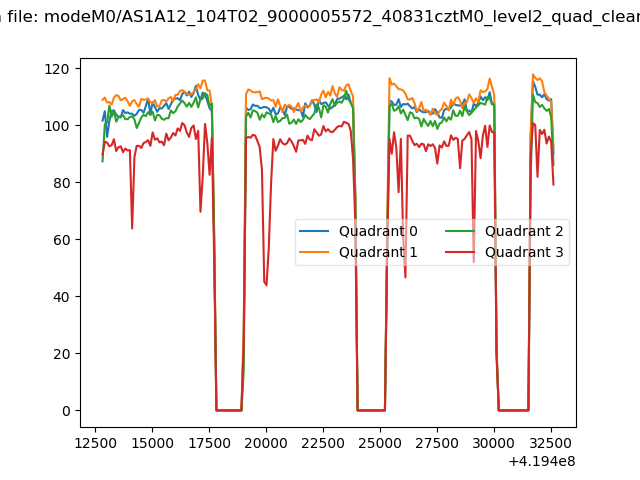 |
|
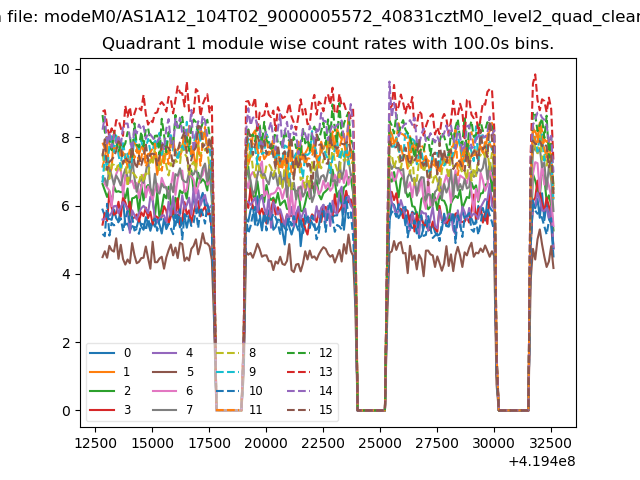
| Module-wise count rates for Quadrant A Data is divided into 100 sec bins |
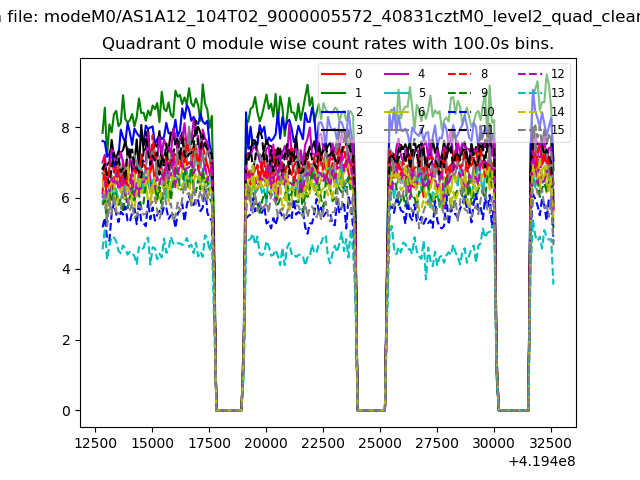 |
 |
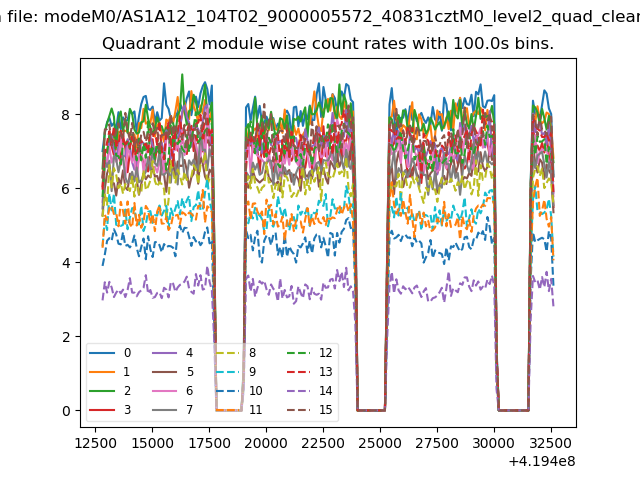
| Module-wise count rates for Quadrant B Data is divided into 100 sec bins |
 |
 |
| Module-wise count rates for Quadrant C Data is divided into 100 sec bins |
 |
 |
| Module-wise count rates for Quadrant D Data is divided into 100 sec bins |
 |
 |
| Parameter | Plot |
|---|---|
| CZT HV Monitor | 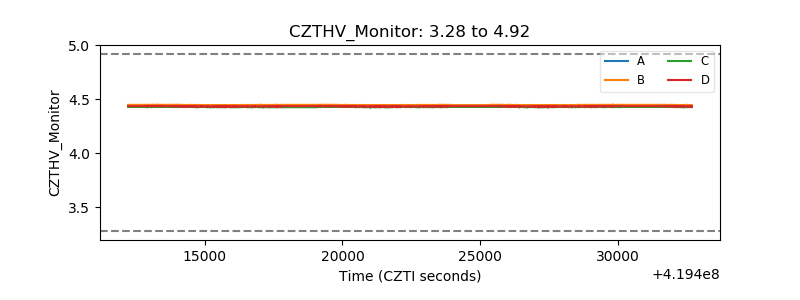 |
| D_VDD | 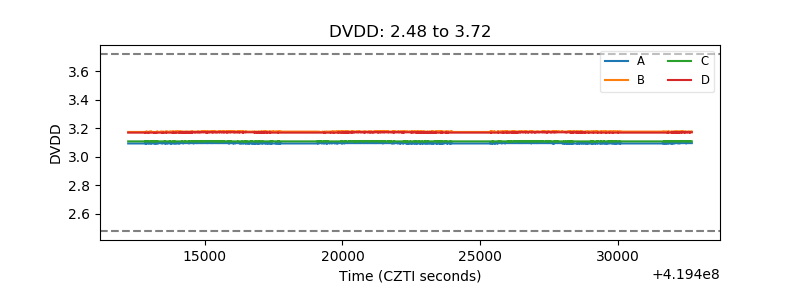 |
| Temperature 1 | 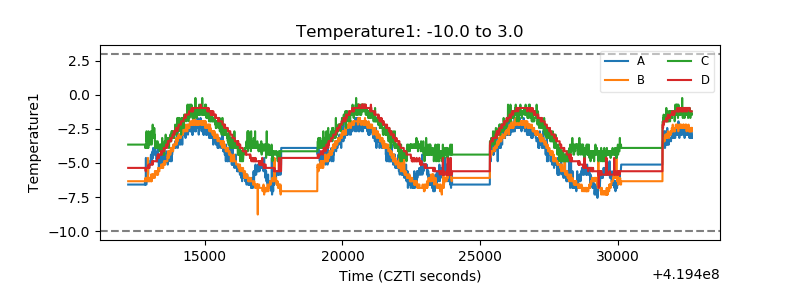 |
| Veto HV Monitor | 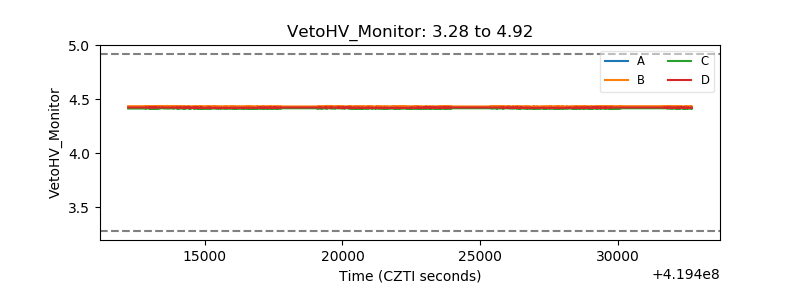 |
| Veto LLD | 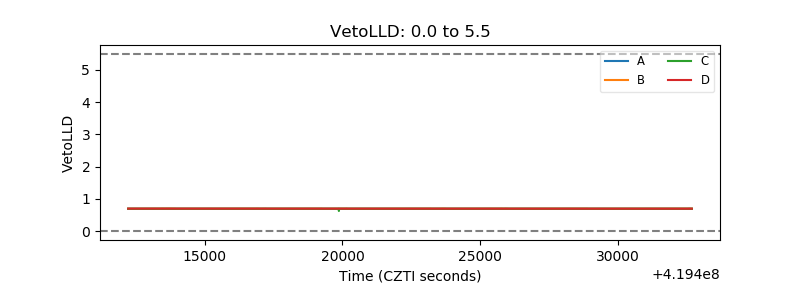 |
| Alpha Counter |  |
| _CPM_Rate | 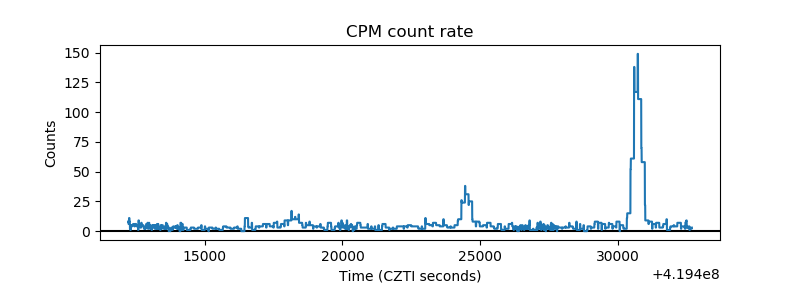 |
| CZT Counter | 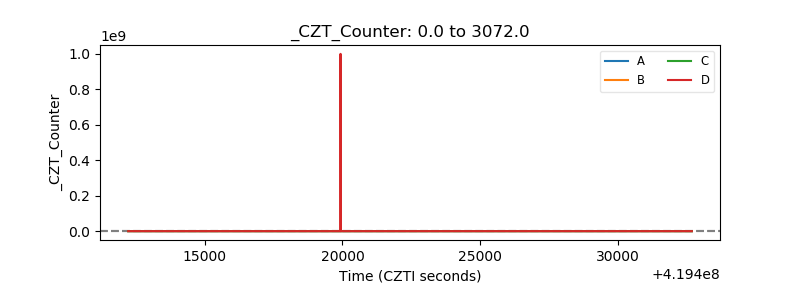 |
| +2.5 Volts monitor | 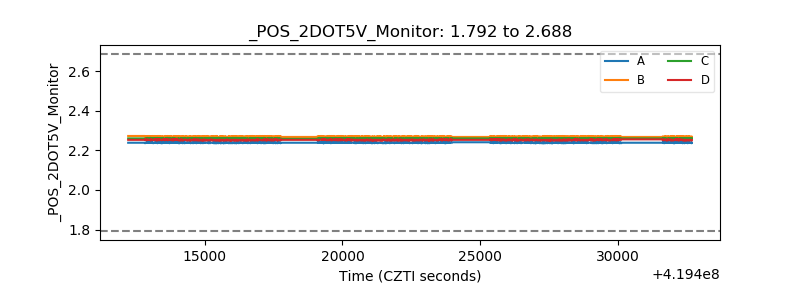 |
| +5 Volts monitor |  |
| _ROLL_ROT | 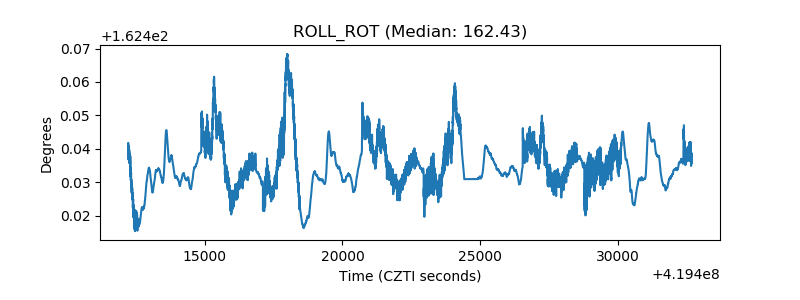 |
| _Roll_DEC | 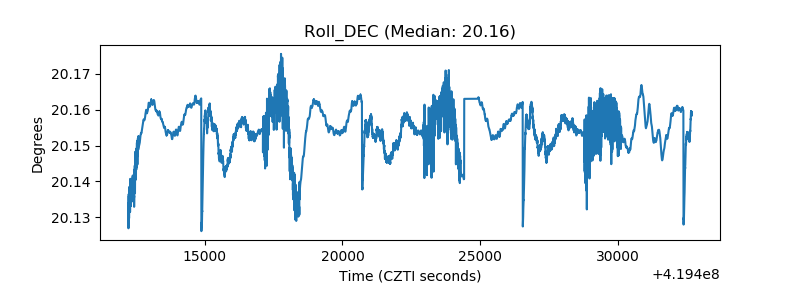 |
| _Roll_RA | 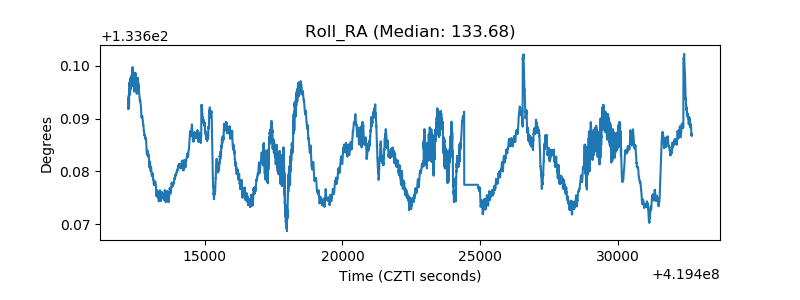 |
| Veto Counter | 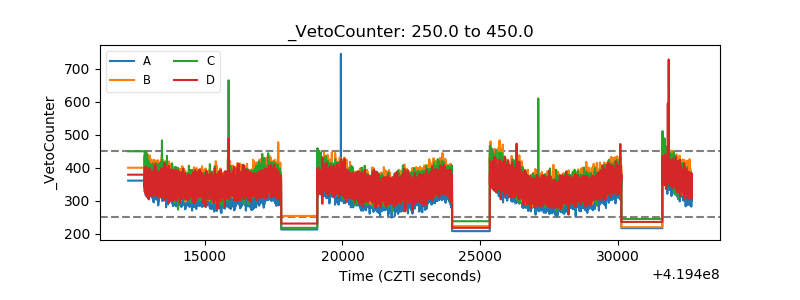 |