| Param | Original file | Final file |
|---|---|---|
| Filename | modeM0/AS1A12_104T02_9000005572_40832cztM0_level2.fits | modeM0/AS1A12_104T02_9000005572_40832cztM0_level2_quad_clean.evt |
| Size (bytes) | 309,706,560 | 89,282,880 |
| Size | 295.4 MB | 85.1 MB |
| Events in quadrant A | 2,944,066 | 597,050 |
| Events in quadrant B | 2,484,844 | 608,882 |
| Events in quadrant C | 2,635,940 | 580,583 |
| Events in quadrant D | 2,971,856 | 532,931 |
| Mode M9 | |||
|---|---|---|---|
| Quadrant | BADHDUFLAG | Total packets | Discarded packets |
| A | 0 | 20 | 0 |
| B | 0 | 20 | 0 |
| C | 0 | 20 | 0 |
| D | 0 | 21 | 0 |
| Mode M0 | |||
|---|---|---|---|
| Quadrant | BADHDUFLAG | Total packets | Discarded packets |
| A | 0 | 12262 | 3 |
| B | 0 | 11219 | 2 |
| C | 0 | 11323 | 2 |
| D | 0 | 12718 | 2 |
| Mode SS | |||
|---|---|---|---|
| Quadrant | BADHDUFLAG | Total packets | Discarded packets |
| A | 0 | 112 | 0 |
| B | 0 | 112 | 0 |
| C | 0 | 112 | 0 |
| D | 0 | 112 | 0 |
| Quadrant | Total seconds | Saturated seconds | Saturation percentage |
|---|---|---|---|
| A | 5484 | 24 | 0.437637% |
| B | 5484 | 24 | 0.437637% |
| C | 5484 | 24 | 0.437637% |
| D | 5484 | 102 | 1.859956% |
Noise dominated data is calculated using 1-second bins in cleaned event files. If a bin has >2000 counts, and if more than 50% of those come from <1% of pixels, then it is considered to be noise-dominated and hence unusable.
| Quadrant | # 1 sec bins | Bins with >0 counts | Bins with >2000 counts | High rate bins dominated by noise | Noise dominated (total time) | Noise dominated (detector-on time) | Marked lightcurve |
|---|---|---|---|---|---|---|---|
| A | 7127 | 5485 | 8 | 8 | 0.11% | 0.15% | 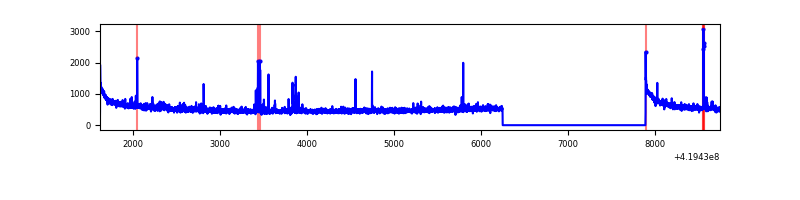 |
| B | 7127 | 5485 | 10 | 10 | 0.14% | 0.18% | 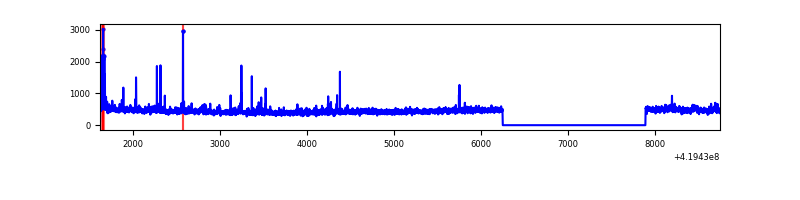 |
| C | 7127 | 5485 | 14 | 14 | 0.20% | 0.26% | 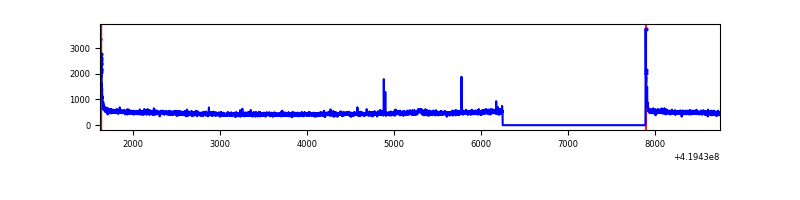 |
| D | 7127 | 5485 | 83 | 83 | 1.16% | 1.51% | 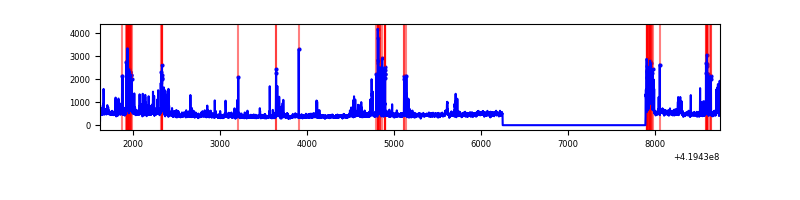 |
Top three noisy pixels from each quadrant. If the there are fewer than three noisy pixels in the level2.evt file, extra rows are filled as -1
| Pixel properties | Quadrant properties | ||||||
|---|---|---|---|---|---|---|---|
| Quadrant | DetID | PixID | Counts | Sigma | Mean | Median | Sigma |
| A | 10 | 83 | 522065 | 4218.78 | 599 | 587 | 123.6 |
| A | 2 | 79 | 59409 | 475.87 | 599 | 587 | 123.6 |
| A | 13 | 248 | 23547 | 185.75 | 599 | 587 | 123.6 |
| B | 0 | 190 | 54528 | 465.81 | 594 | 577 | 115.8 |
| B | 5 | 255 | 44408 | 378.44 | 594 | 577 | 115.8 |
| B | 0 | 230 | 35528 | 301.77 | 594 | 577 | 115.8 |
| C | 15 | 214 | 234715 | 1707.24 | 583 | 587 | 137.1 |
| C | 0 | 10 | 76408 | 552.88 | 583 | 587 | 137.1 |
| C | 10 | 70 | 26020 | 185.46 | 583 | 587 | 137.1 |
| D | 13 | 249 | 247699 | 1736.31 | 583 | 565 | 142.3 |
| D | 2 | 16 | 126151 | 882.34 | 583 | 565 | 142.3 |
| D | 1 | 47 | 117458 | 821.27 | 583 | 565 | 142.3 |
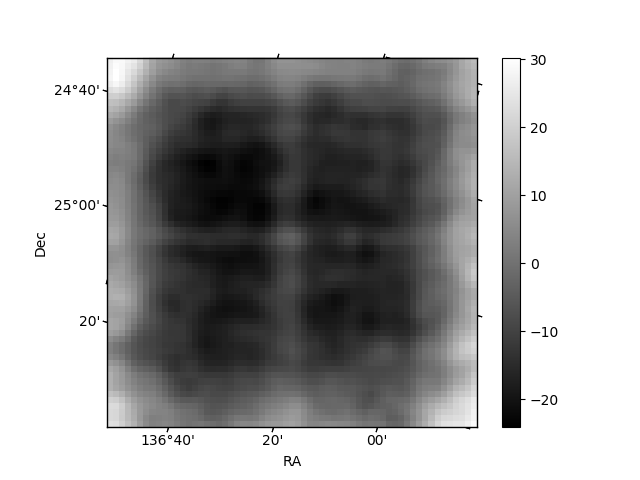
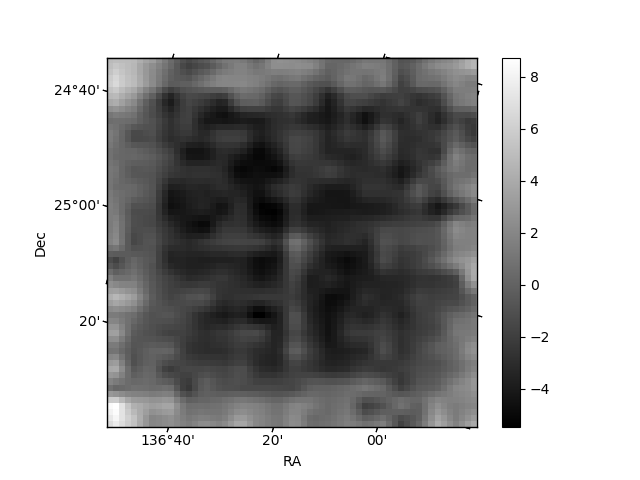
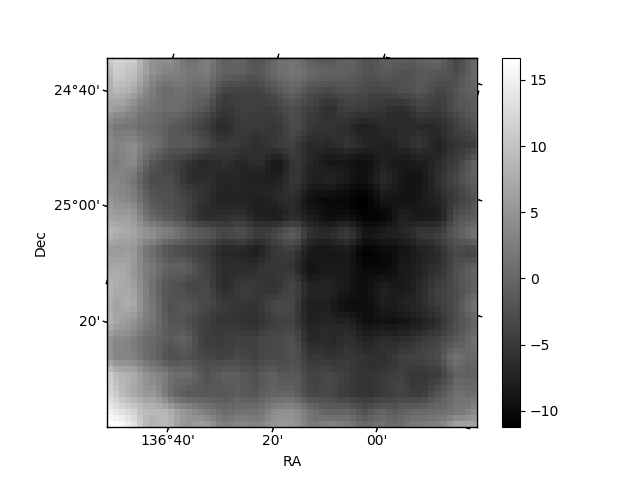
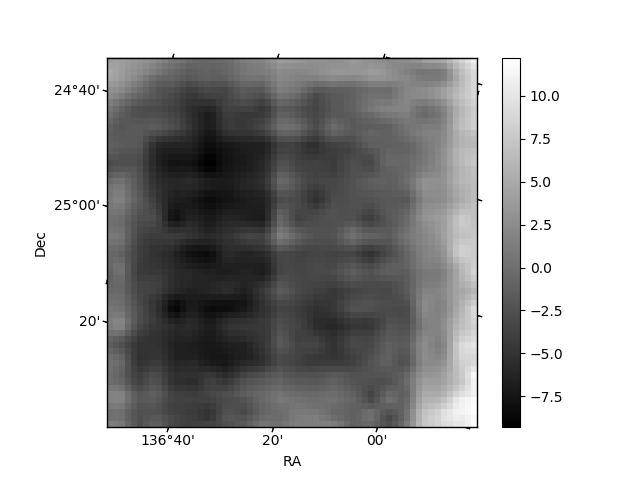
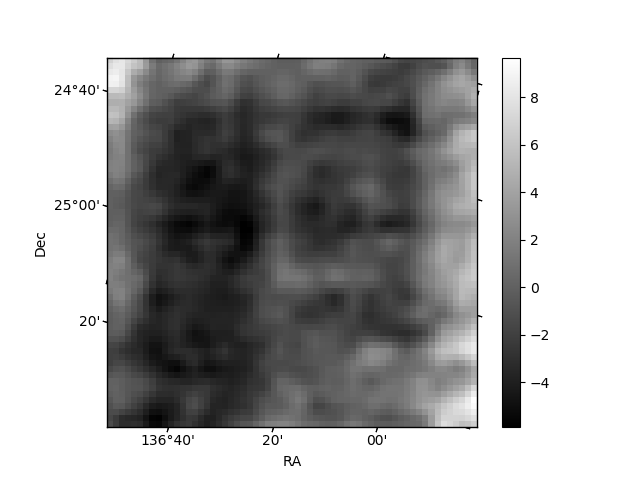
Histogram calculated using DETX and DETY for each event in the final _common_clean file
| Quadrant A | 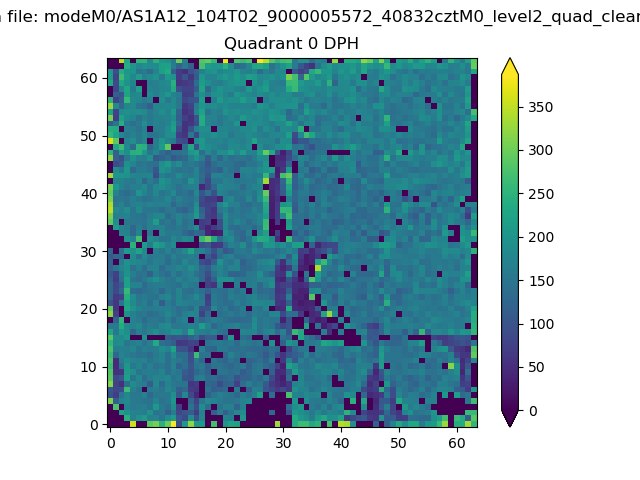 |
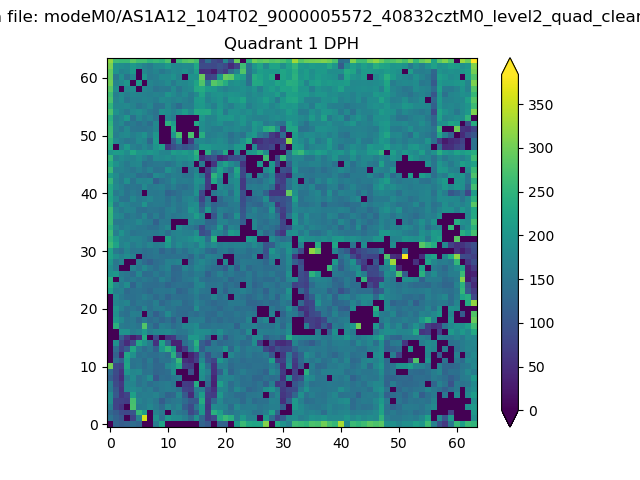 |
Quadrant B |
|---|---|---|---|
| Quadrant D | 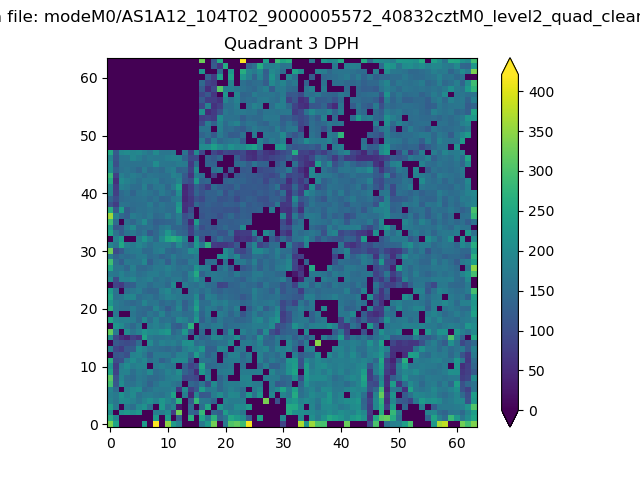 |
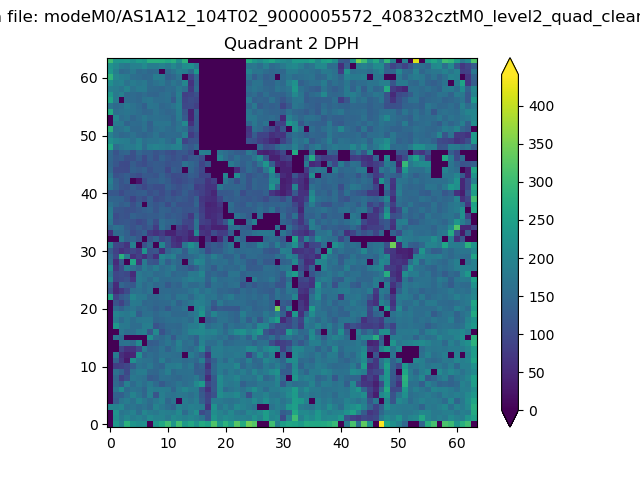 |
Quadrant C |
| Plot type | Count rate plots | Images |
|---|---|---|
| Comparison with Poisson distribution Blue bars denote a histogram of data divided into 1 sec bins. Red curve is a Poisson curve with rate = median count rate of data. |
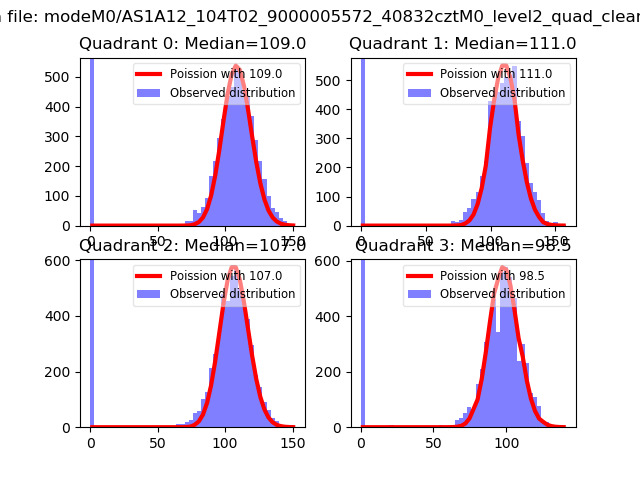 |
 |
| Quadrant-wise count rates Data is divided into 100 sec bins |
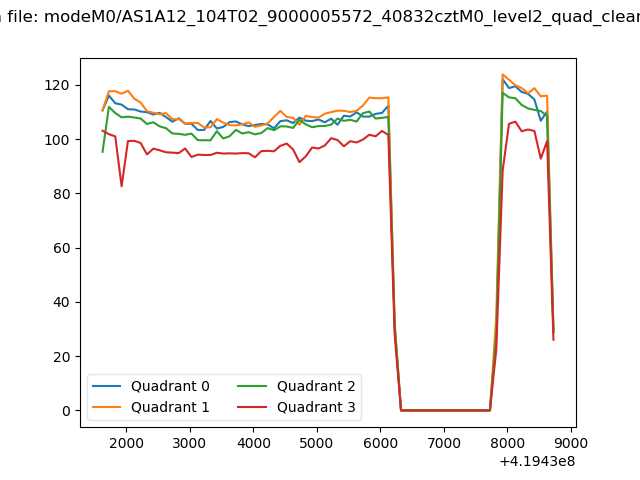 |
|
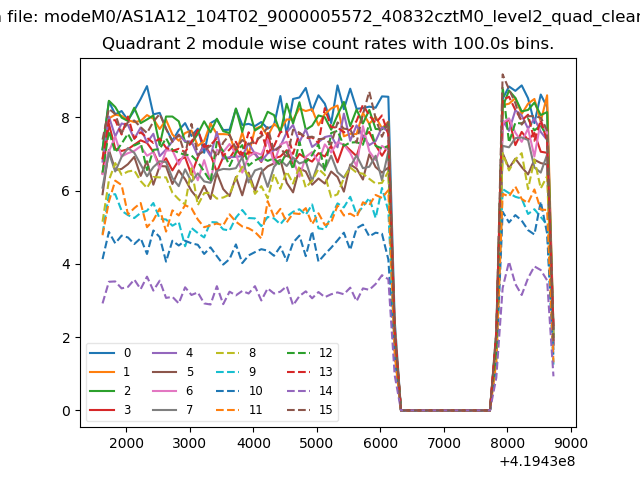
| Module-wise count rates for Quadrant A Data is divided into 100 sec bins |
 |
 |
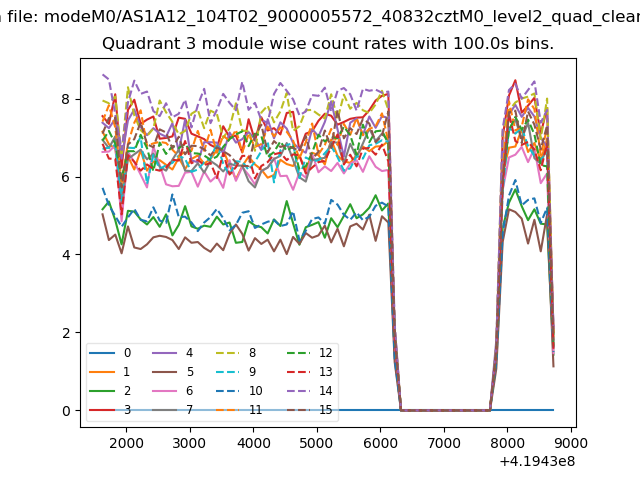
| Module-wise count rates for Quadrant B Data is divided into 100 sec bins |
 |
 |
| Module-wise count rates for Quadrant C Data is divided into 100 sec bins |
 |
 |
| Module-wise count rates for Quadrant D Data is divided into 100 sec bins |
 |
 |
| Parameter | Plot |
|---|---|
| CZT HV Monitor | 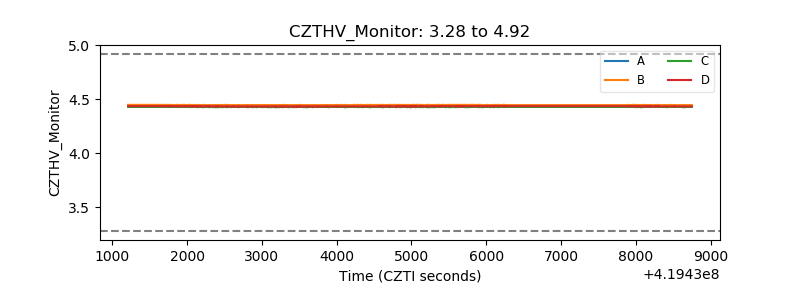 |
| D_VDD | 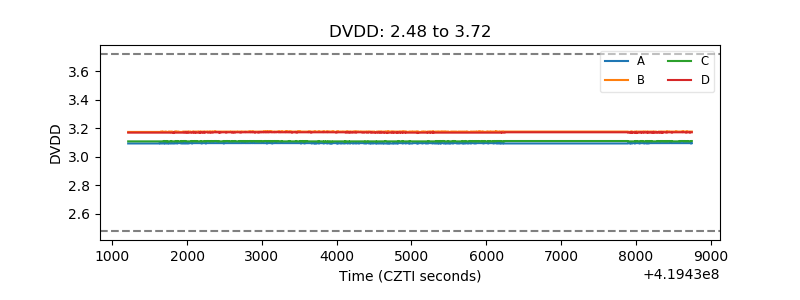 |
| Temperature 1 | 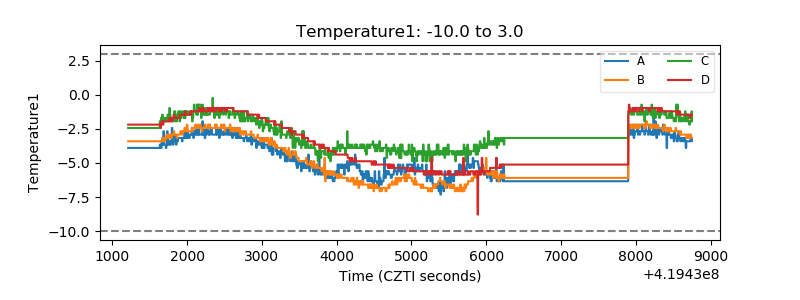 |
| Veto HV Monitor | 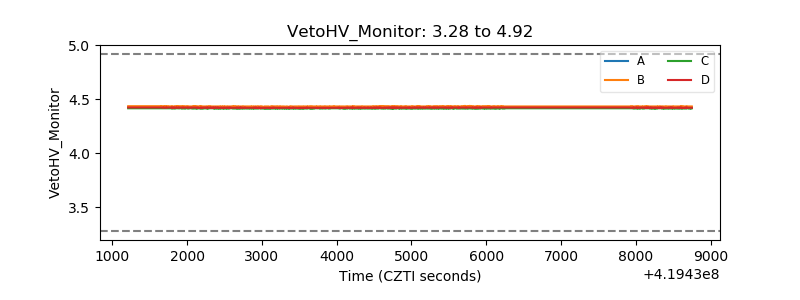 |
| Veto LLD | 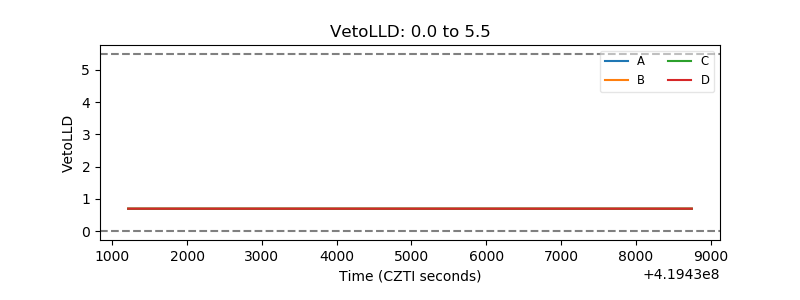 |
| Alpha Counter |  |
| _CPM_Rate |  |
| CZT Counter | 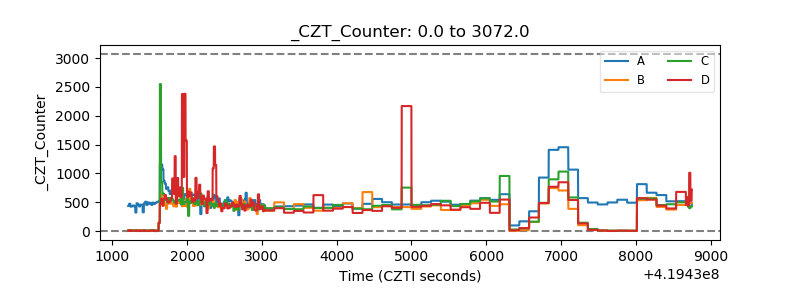 |
| +2.5 Volts monitor | 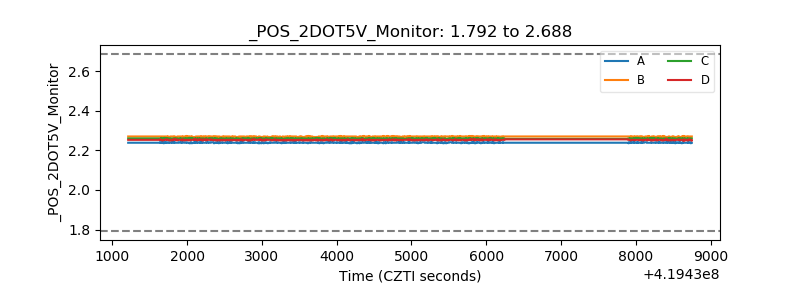 |
| +5 Volts monitor | 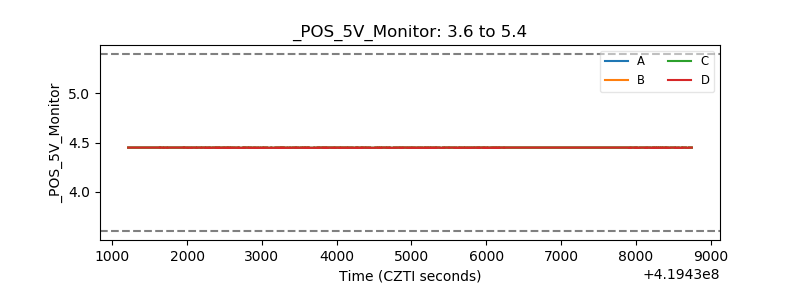 |
| _ROLL_ROT | 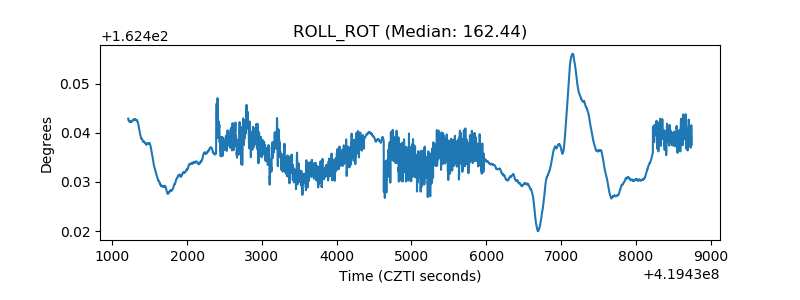 |
| _Roll_DEC | 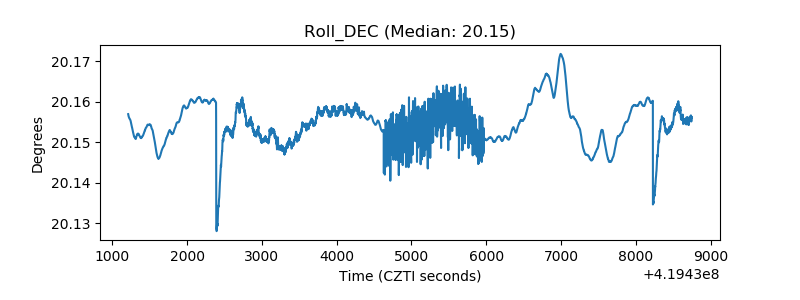 |
| _Roll_RA | 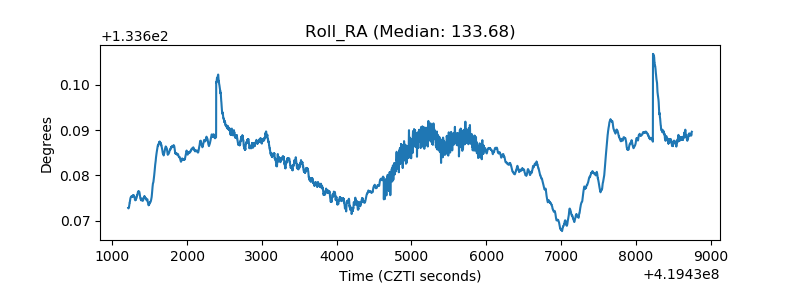 |
| Veto Counter | 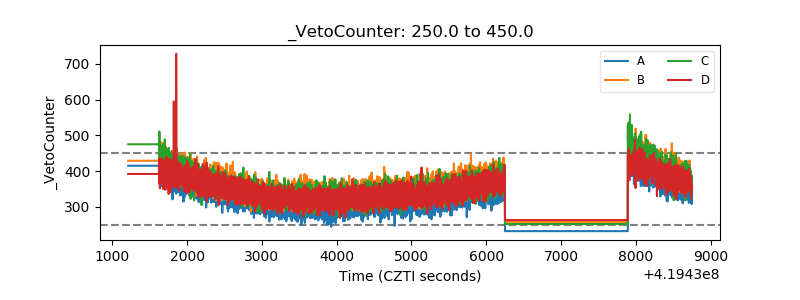 |