| Param | Original file | Final file |
|---|---|---|
| Filename | modeM0/AS1A12_104T02_9000005572_40834cztM0_level2.fits | modeM0/AS1A12_104T02_9000005572_40834cztM0_level2_quad_clean.evt |
| Size (bytes) | 319,239,360 | 89,144,640 |
| Size | 304.5 MB | 85.0 MB |
| Events in quadrant A | 2,900,946 | 600,253 |
| Events in quadrant B | 2,603,899 | 609,685 |
| Events in quadrant C | 2,601,530 | 583,283 |
| Events in quadrant D | 3,292,445 | 530,645 |
| Mode M9 | |||
|---|---|---|---|
| Quadrant | BADHDUFLAG | Total packets | Discarded packets |
| A | 0 | 19 | 0 |
| B | 0 | 19 | 0 |
| C | 0 | 19 | 0 |
| D | 0 | 20 | 0 |
| Mode M0 | |||
|---|---|---|---|
| Quadrant | BADHDUFLAG | Total packets | Discarded packets |
| A | 0 | 12040 | 3 |
| B | 0 | 11523 | 2 |
| C | 0 | 11179 | 2 |
| D | 0 | 13428 | 2 |
| Mode SS | |||
|---|---|---|---|
| Quadrant | BADHDUFLAG | Total packets | Discarded packets |
| A | 0 | 108 | 0 |
| B | 0 | 108 | 0 |
| C | 0 | 108 | 0 |
| D | 0 | 108 | 0 |
| Quadrant | Total seconds | Saturated seconds | Saturation percentage |
|---|---|---|---|
| A | 5367 | 24 | 0.447177% |
| B | 5367 | 55 | 1.024781% |
| C | 5367 | 27 | 0.503074% |
| D | 5367 | 186 | 3.465623% |
Noise dominated data is calculated using 1-second bins in cleaned event files. If a bin has >2000 counts, and if more than 50% of those come from <1% of pixels, then it is considered to be noise-dominated and hence unusable.
| Quadrant | # 1 sec bins | Bins with >0 counts | Bins with >2000 counts | High rate bins dominated by noise | Noise dominated (total time) | Noise dominated (detector-on time) | Marked lightcurve |
|---|---|---|---|---|---|---|---|
| A | 7100 | 5368 | 11 | 11 | 0.15% | 0.20% |  |
| B | 7100 | 5368 | 29 | 29 | 0.41% | 0.54% | 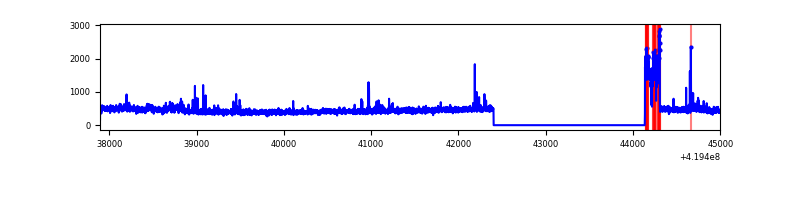 |
| C | 7100 | 5368 | 19 | 19 | 0.27% | 0.35% | 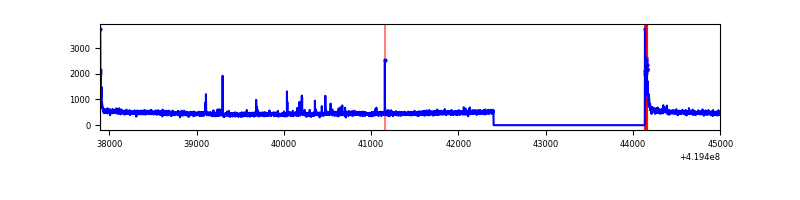 |
| D | 7100 | 5368 | 154 | 154 | 2.17% | 2.87% | 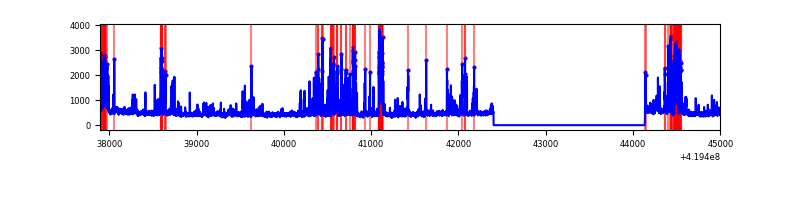 |
Top three noisy pixels from each quadrant. If the there are fewer than three noisy pixels in the level2.evt file, extra rows are filled as -1
| Pixel properties | Quadrant properties | ||||||
|---|---|---|---|---|---|---|---|
| Quadrant | DetID | PixID | Counts | Sigma | Mean | Median | Sigma |
| A | 10 | 83 | 514070 | 4171.36 | 589 | 576 | 123.1 |
| A | 2 | 79 | 53865 | 432.89 | 589 | 576 | 123.1 |
| A | 13 | 248 | 25519 | 202.62 | 589 | 576 | 123.1 |
| B | 7 | 202 | 201920 | 1778.05 | 584 | 567 | 113.2 |
| B | 0 | 190 | 63297 | 553.94 | 584 | 567 | 113.2 |
| B | 0 | 230 | 25919 | 223.87 | 584 | 567 | 113.2 |
| C | 15 | 214 | 226151 | 1682.38 | 574 | 578 | 134.1 |
| C | 0 | 10 | 89786 | 665.33 | 574 | 578 | 134.1 |
| C | 14 | 254 | 33624 | 246.46 | 574 | 578 | 134.1 |
| D | 1 | 47 | 311162 | 2207.68 | 569 | 552 | 140.7 |
| D | 2 | 249 | 253341 | 1796.71 | 569 | 552 | 140.7 |
| D | 13 | 249 | 228130 | 1617.52 | 569 | 552 | 140.7 |
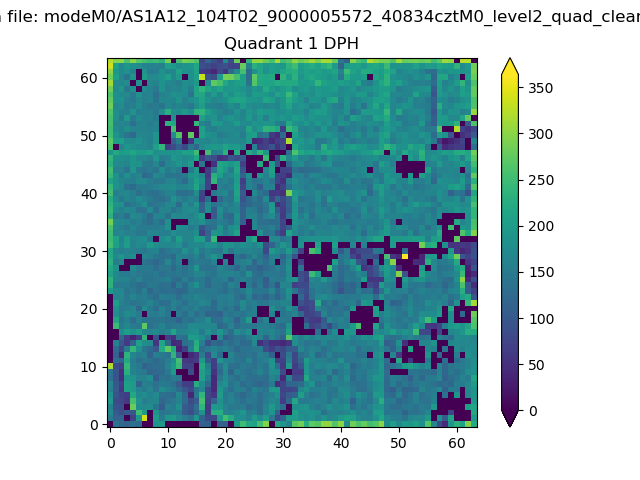
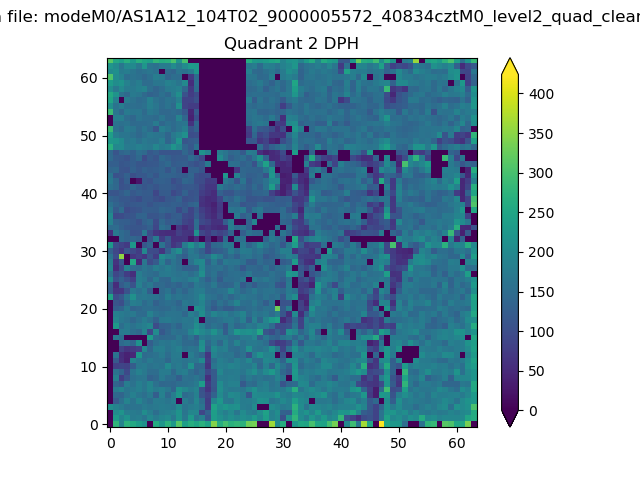
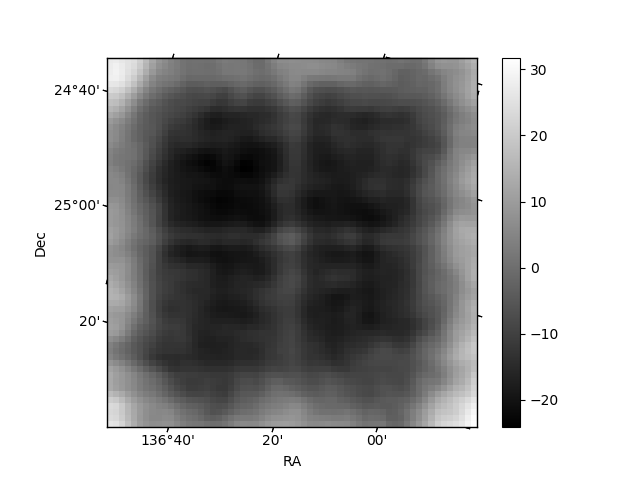
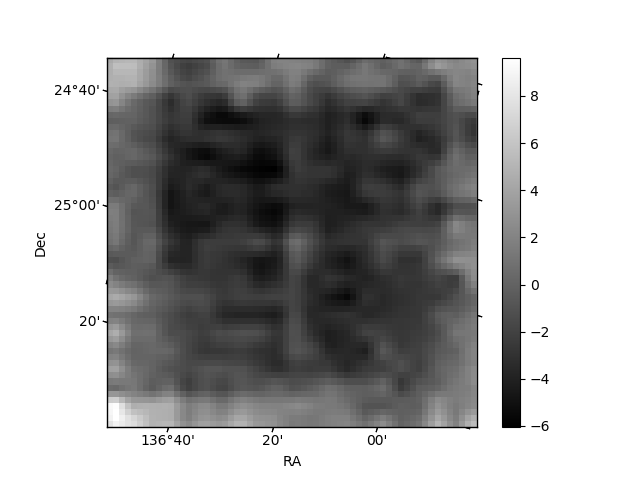
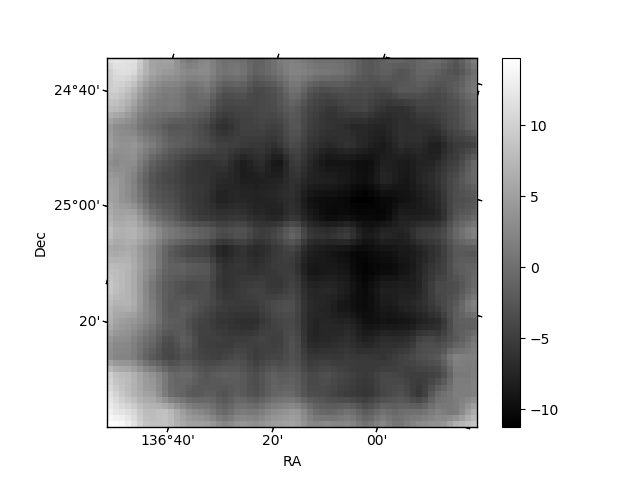
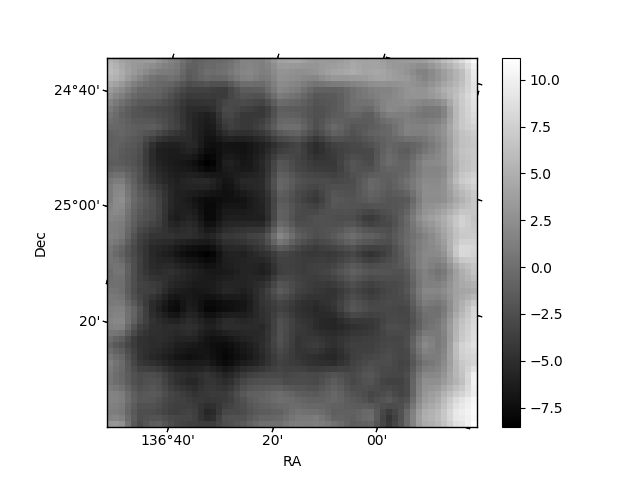
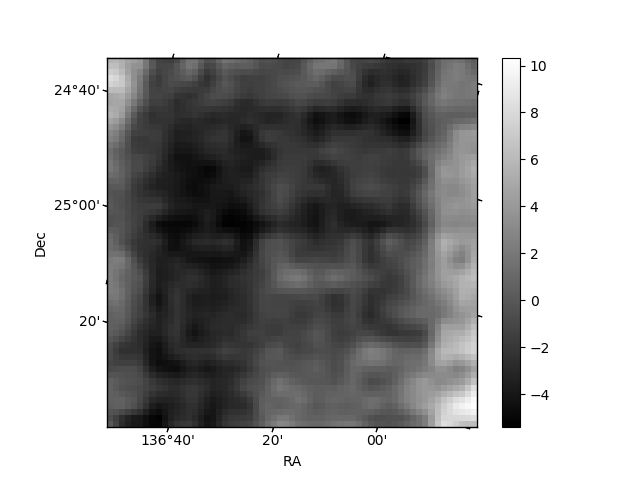
Histogram calculated using DETX and DETY for each event in the final _common_clean file
| Quadrant A | 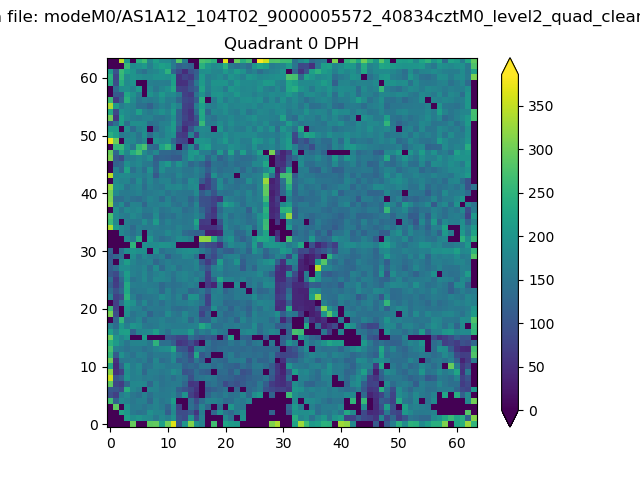 |
 |
Quadrant B |
|---|---|---|---|
| Quadrant D | 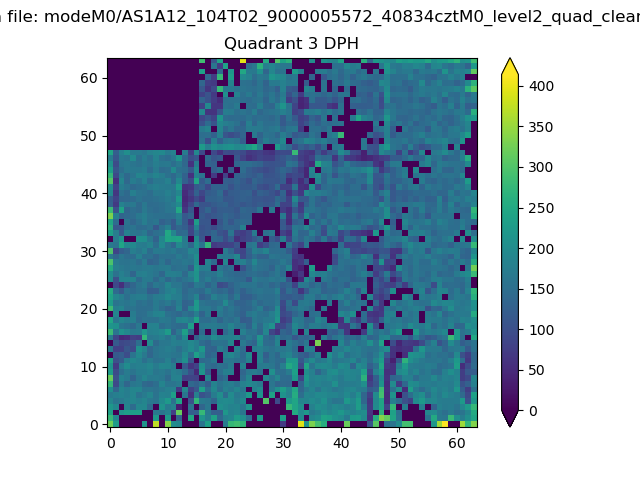 |
 |
Quadrant C |
| Plot type | Count rate plots | Images |
|---|---|---|
| Comparison with Poisson distribution Blue bars denote a histogram of data divided into 1 sec bins. Red curve is a Poisson curve with rate = median count rate of data. |
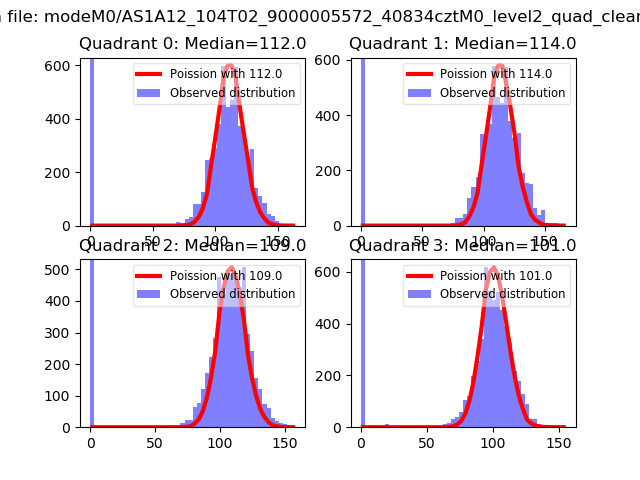 |
 |
| Quadrant-wise count rates Data is divided into 100 sec bins |
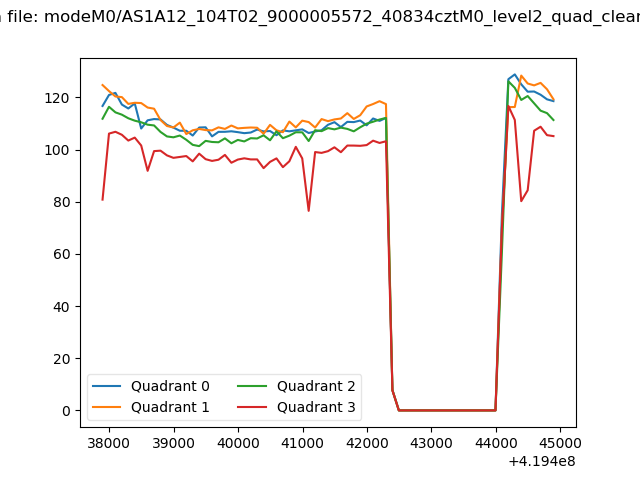 |
|
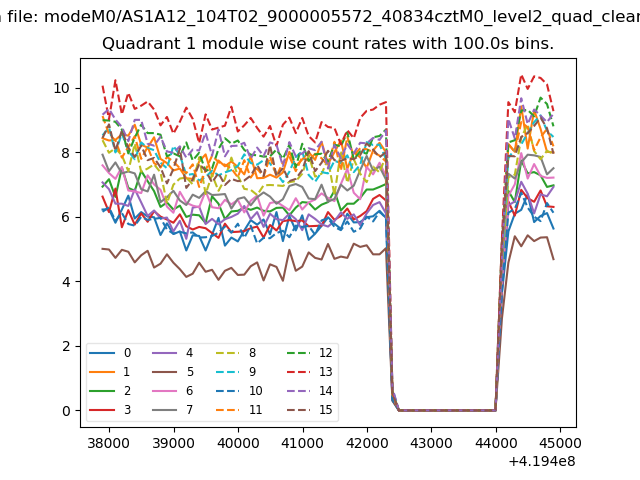
| Module-wise count rates for Quadrant A Data is divided into 100 sec bins |
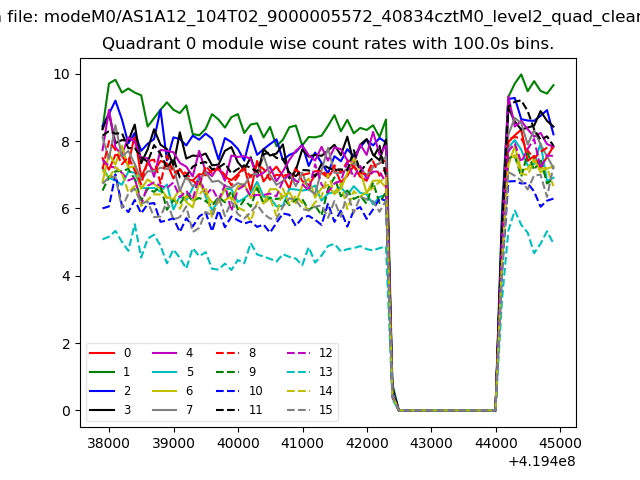 |
 |
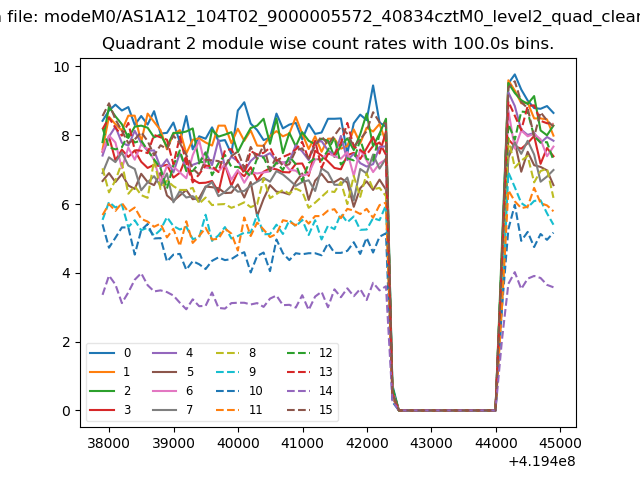
| Module-wise count rates for Quadrant B Data is divided into 100 sec bins |
 |
 |
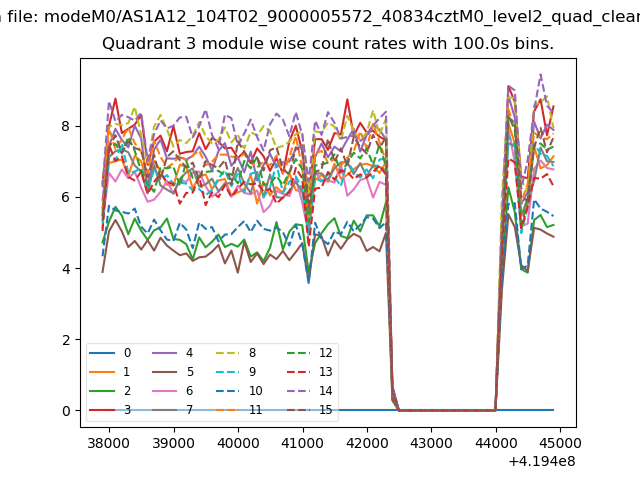
| Module-wise count rates for Quadrant C Data is divided into 100 sec bins |
 |
 |
| Module-wise count rates for Quadrant D Data is divided into 100 sec bins |
 |
 |
| Parameter | Plot |
|---|---|
| CZT HV Monitor | 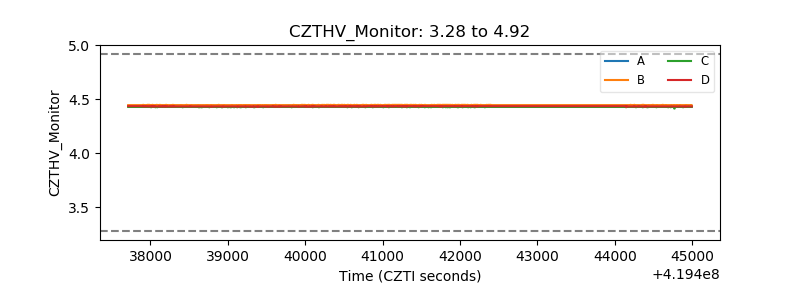 |
| D_VDD | 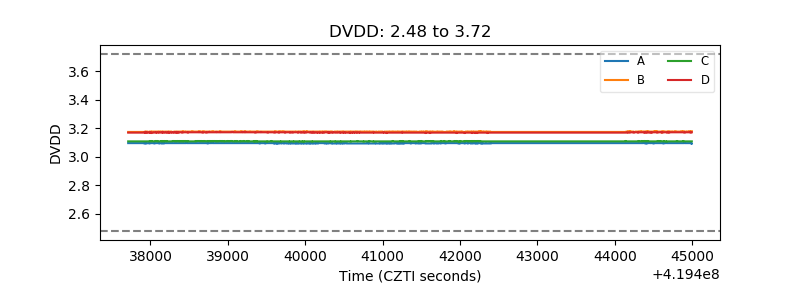 |
| Temperature 1 | 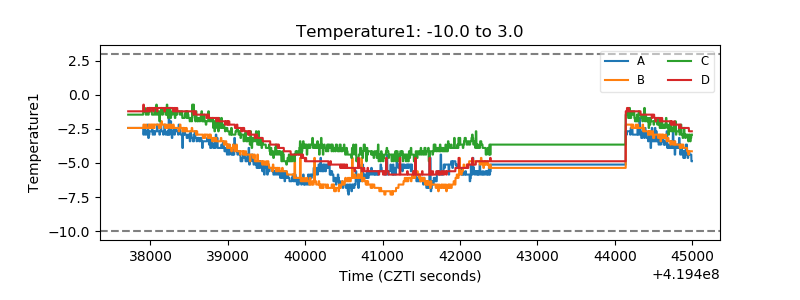 |
| Veto HV Monitor | 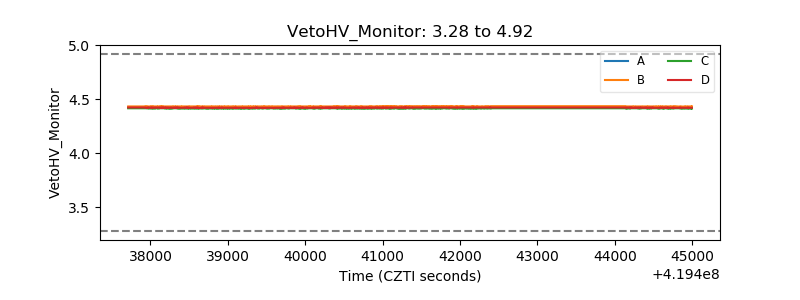 |
| Veto LLD | 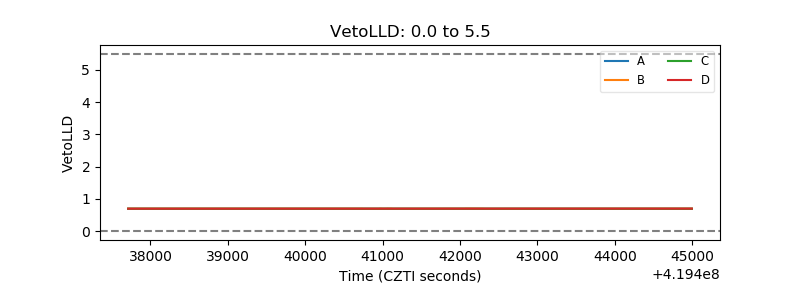 |
| Alpha Counter |  |
| _CPM_Rate |  |
| CZT Counter | 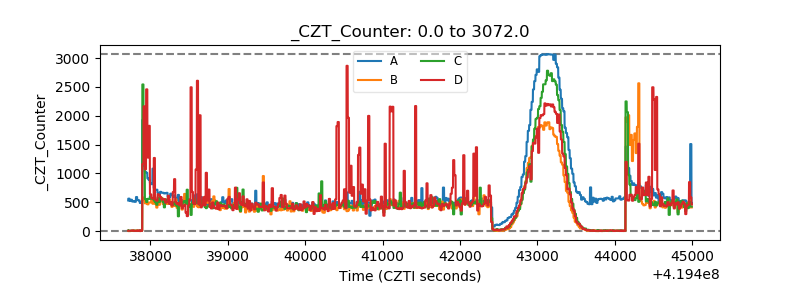 |
| +2.5 Volts monitor |  |
| +5 Volts monitor |  |
| _ROLL_ROT | 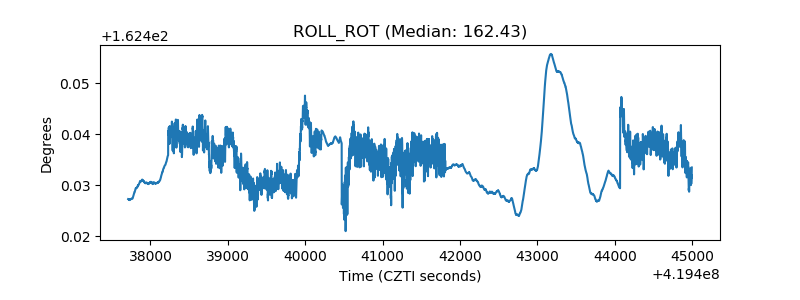 |
| _Roll_DEC | 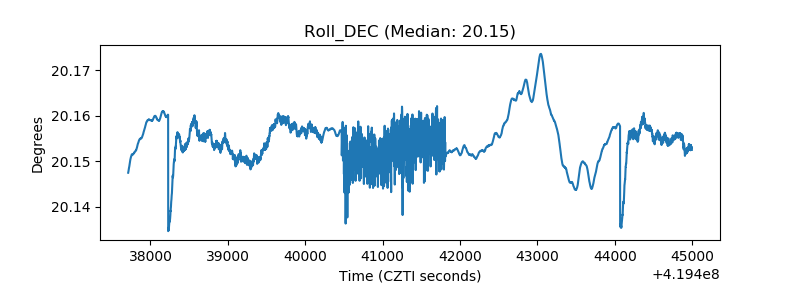 |
| _Roll_RA | 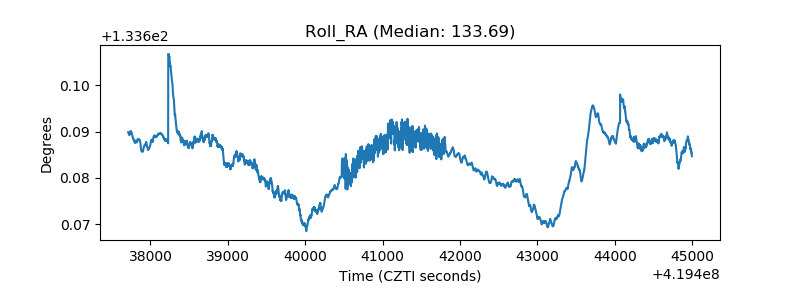 |
| Veto Counter | 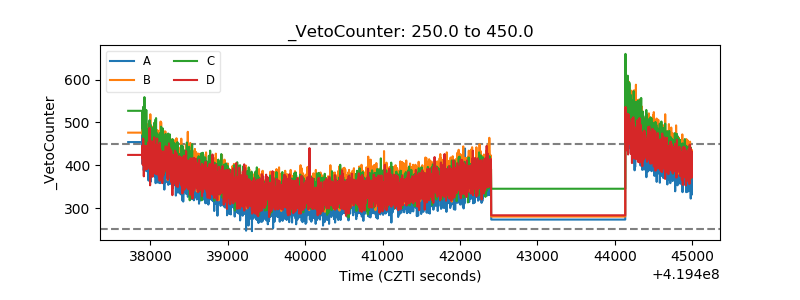 |