| Param | Original file | Final file |
|---|---|---|
| Filename | modeM0/AS1A12_104T02_9000005572_40835cztM0_level2.fits | modeM0/AS1A12_104T02_9000005572_40835cztM0_level2_quad_clean.evt |
| Size (bytes) | 316,863,360 | 87,672,960 |
| Size | 302.2 MB | 83.6 MB |
| Events in quadrant A | 3,083,252 | 585,174 |
| Events in quadrant B | 2,591,725 | 605,912 |
| Events in quadrant C | 2,555,783 | 576,963 |
| Events in quadrant D | 3,097,742 | 526,194 |
| Mode M9 | |||
|---|---|---|---|
| Quadrant | BADHDUFLAG | Total packets | Discarded packets |
| A | 0 | 27 | 0 |
| B | 0 | 27 | 0 |
| C | 0 | 27 | 0 |
| D | 0 | 28 | 0 |
| Mode M0 | |||
|---|---|---|---|
| Quadrant | BADHDUFLAG | Total packets | Discarded packets |
| A | 0 | 12404 | 3 |
| B | 0 | 11231 | 2 |
| C | 0 | 10838 | 2 |
| D | 0 | 12814 | 2 |
| Mode SS | |||
|---|---|---|---|
| Quadrant | BADHDUFLAG | Total packets | Discarded packets |
| A | 0 | 106 | 0 |
| B | 0 | 106 | 0 |
| C | 0 | 106 | 0 |
| D | 0 | 106 | 0 |
| Quadrant | Total seconds | Saturated seconds | Saturation percentage |
|---|---|---|---|
| A | 5140 | 115 | 2.237354% |
| B | 5140 | 66 | 1.284047% |
| C | 5140 | 37 | 0.719844% |
| D | 5140 | 163 | 3.171206% |
Noise dominated data is calculated using 1-second bins in cleaned event files. If a bin has >2000 counts, and if more than 50% of those come from <1% of pixels, then it is considered to be noise-dominated and hence unusable.
| Quadrant | # 1 sec bins | Bins with >0 counts | Bins with >2000 counts | High rate bins dominated by noise | Noise dominated (total time) | Noise dominated (detector-on time) | Marked lightcurve |
|---|---|---|---|---|---|---|---|
| A | 7023 | 5141 | 79 | 79 | 1.12% | 1.54% | 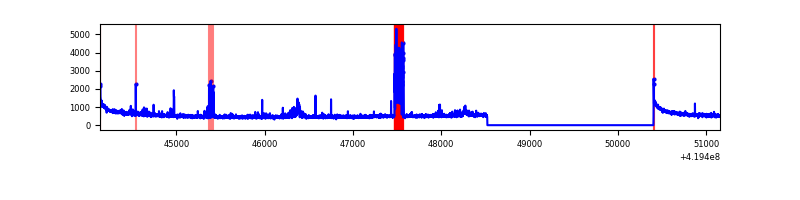 |
| B | 7023 | 5141 | 37 | 37 | 0.53% | 0.72% | 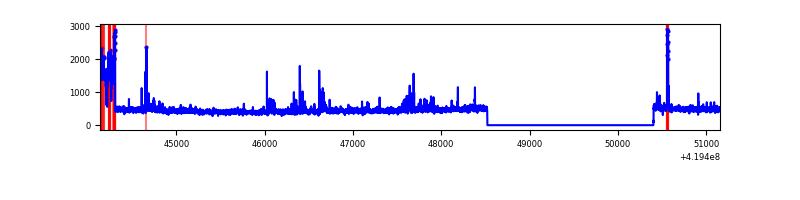 |
| C | 7023 | 5141 | 29 | 29 | 0.41% | 0.56% | 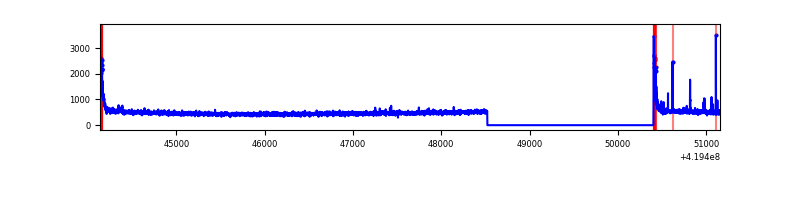 |
| D | 7023 | 5141 | 121 | 121 | 1.72% | 2.35% | 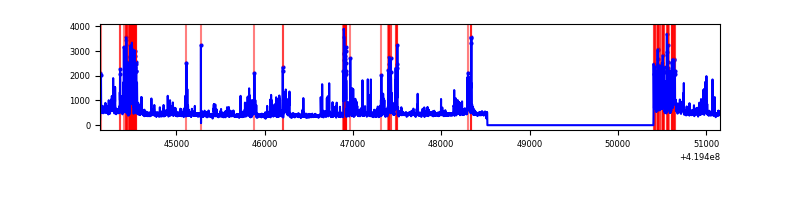 |
Top three noisy pixels from each quadrant. If the there are fewer than three noisy pixels in the level2.evt file, extra rows are filled as -1
| Pixel properties | Quadrant properties | ||||||
|---|---|---|---|---|---|---|---|
| Quadrant | DetID | PixID | Counts | Sigma | Mean | Median | Sigma |
| A | 10 | 83 | 491263 | 4216.25 | 563 | 552 | 116.4 |
| A | 13 | 248 | 313198 | 2686.29 | 563 | 552 | 116.4 |
| A | 2 | 79 | 56018 | 476.57 | 563 | 552 | 116.4 |
| B | 7 | 202 | 202287 | 1844.1 | 569 | 552 | 109.4 |
| B | 0 | 190 | 100822 | 916.59 | 569 | 552 | 109.4 |
| B | 4 | 170 | 28613 | 256.51 | 569 | 552 | 109.4 |
| C | 15 | 214 | 217254 | 1653.96 | 560 | 562 | 131.0 |
| C | 0 | 10 | 115228 | 875.22 | 560 | 562 | 131.0 |
| C | 14 | 254 | 29520 | 221.03 | 560 | 562 | 131.0 |
| D | 1 | 47 | 364436 | 2699.98 | 551 | 534 | 134.8 |
| D | 2 | 249 | 231273 | 1711.97 | 551 | 534 | 134.8 |
| D | 13 | 249 | 166876 | 1234.18 | 551 | 534 | 134.8 |
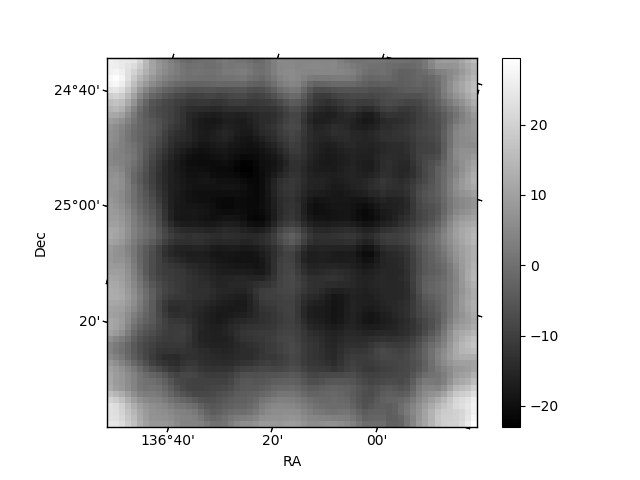
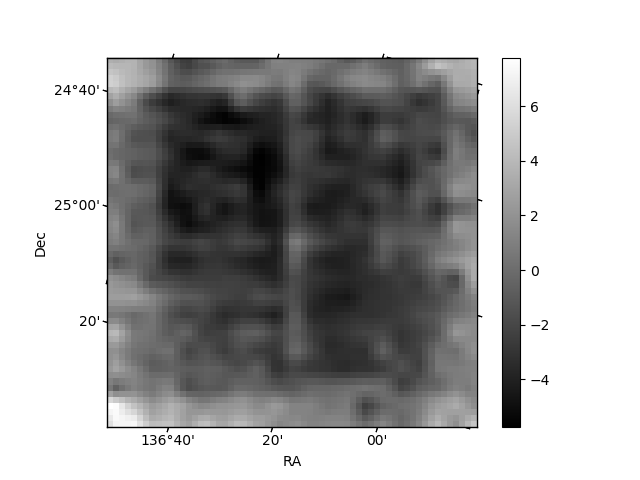
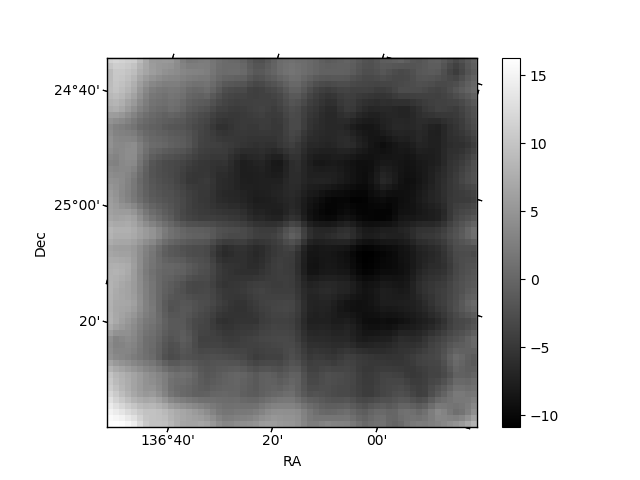
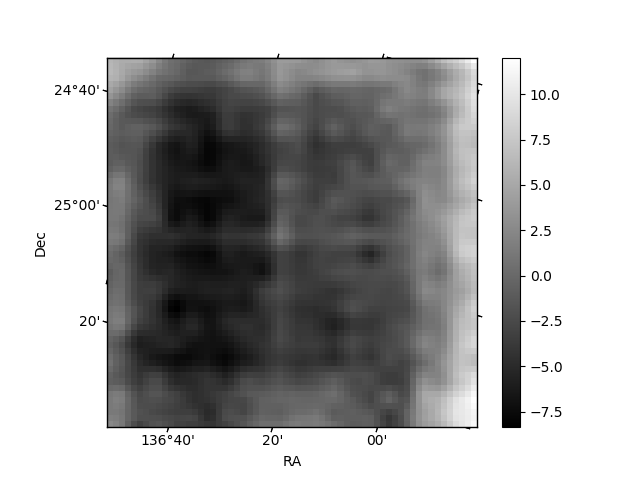
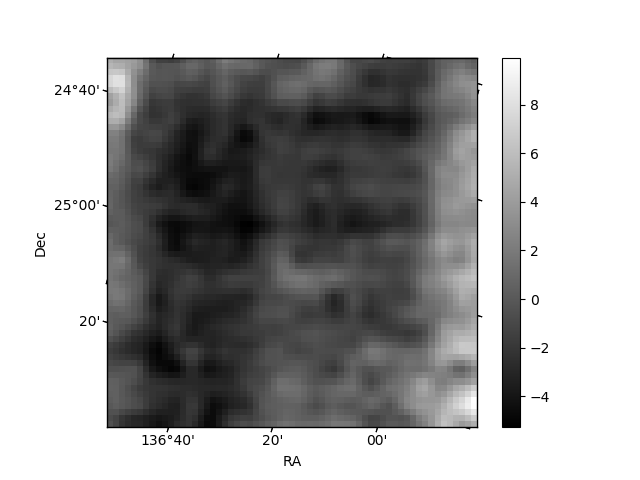
Histogram calculated using DETX and DETY for each event in the final _common_clean file
| Quadrant A | 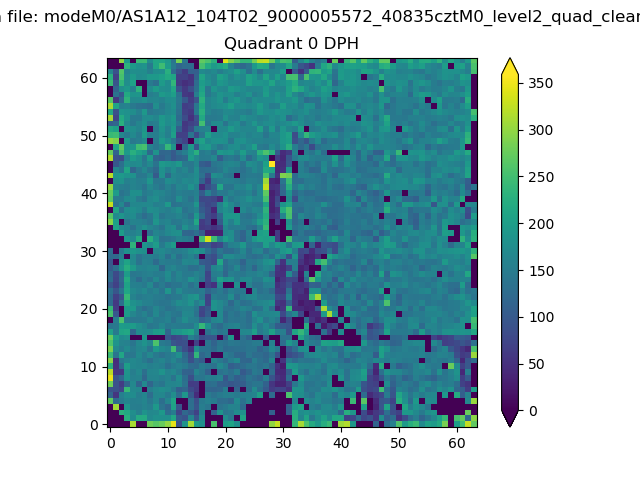 |
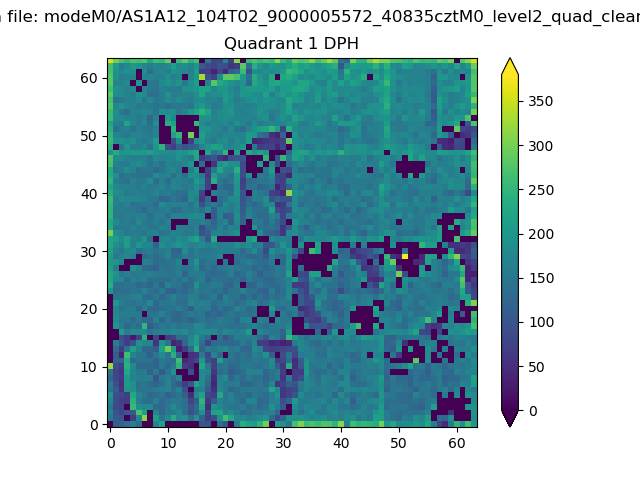 |
Quadrant B |
|---|---|---|---|
| Quadrant D | 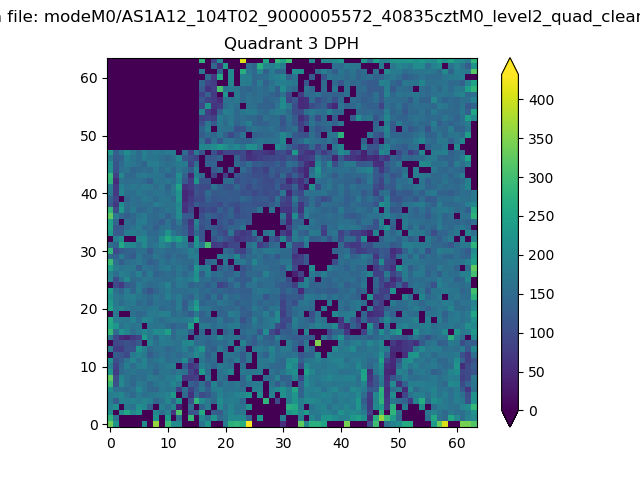 |
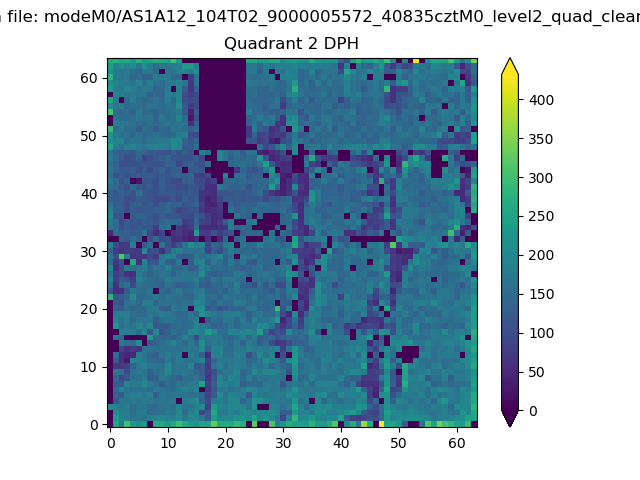 |
Quadrant C |
| Plot type | Count rate plots | Images |
|---|---|---|
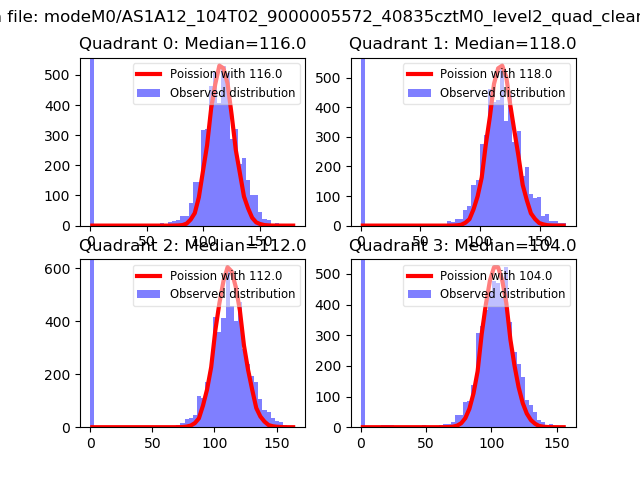
| Comparison with Poisson distribution Blue bars denote a histogram of data divided into 1 sec bins. Red curve is a Poisson curve with rate = median count rate of data. |
 |
 |
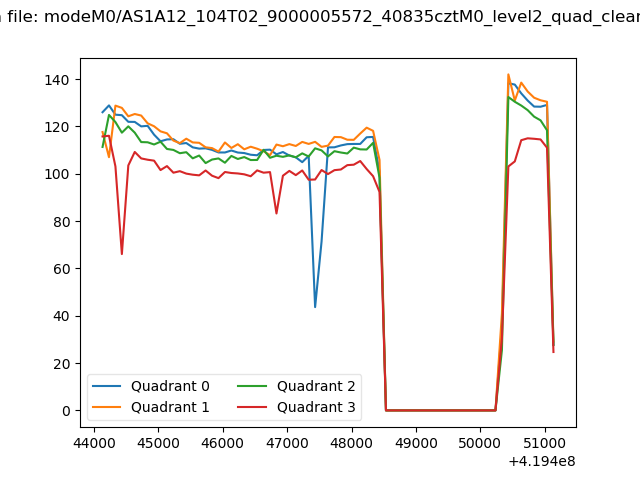
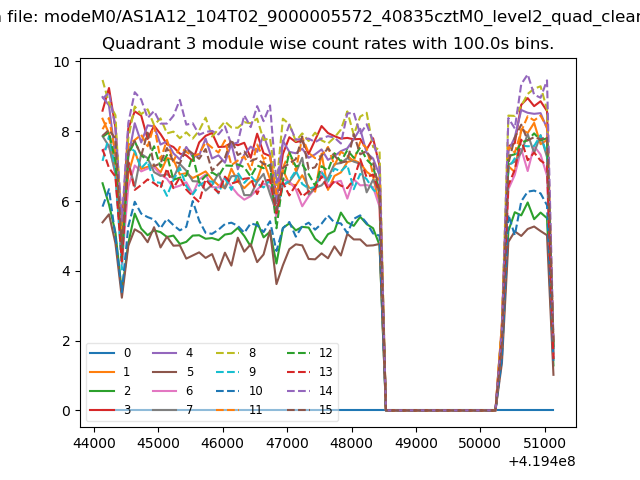
| Quadrant-wise count rates Data is divided into 100 sec bins |
 |
|
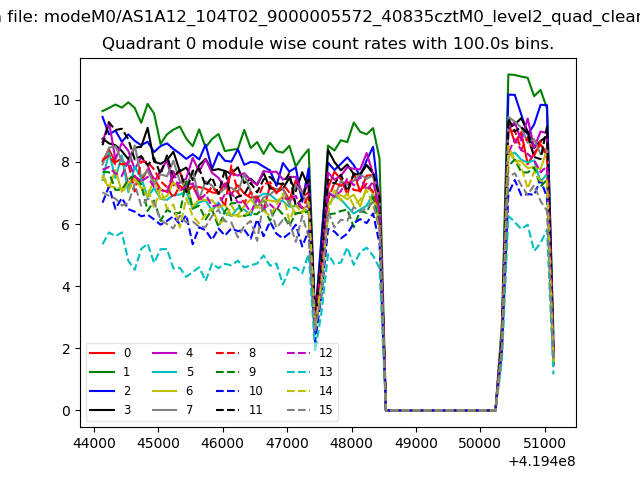
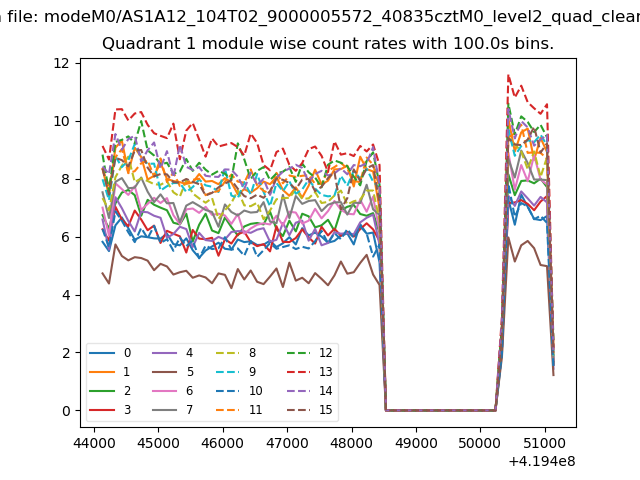
| Module-wise count rates for Quadrant A Data is divided into 100 sec bins |
 |
 |
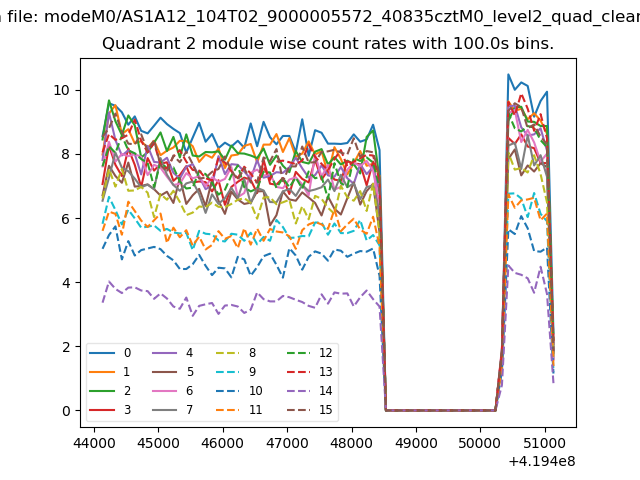
| Module-wise count rates for Quadrant B Data is divided into 100 sec bins |
 |
 |
| Module-wise count rates for Quadrant C Data is divided into 100 sec bins |
 |
 |
| Module-wise count rates for Quadrant D Data is divided into 100 sec bins |
 |
 |
| Parameter | Plot |
|---|---|
| CZT HV Monitor | 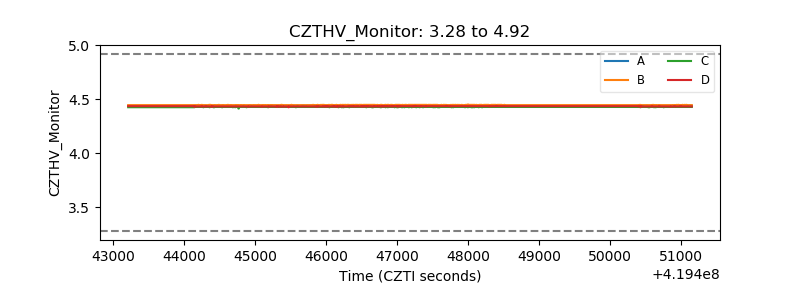 |
| D_VDD | 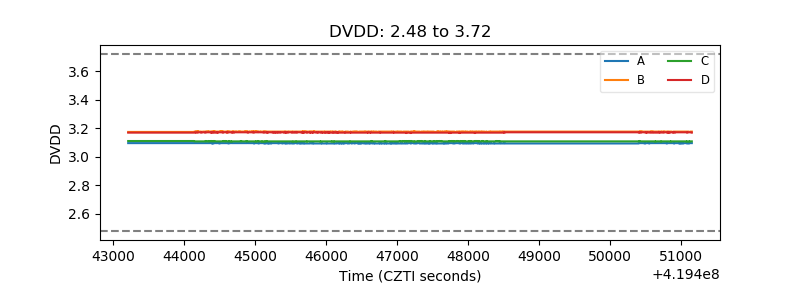 |
| Temperature 1 | 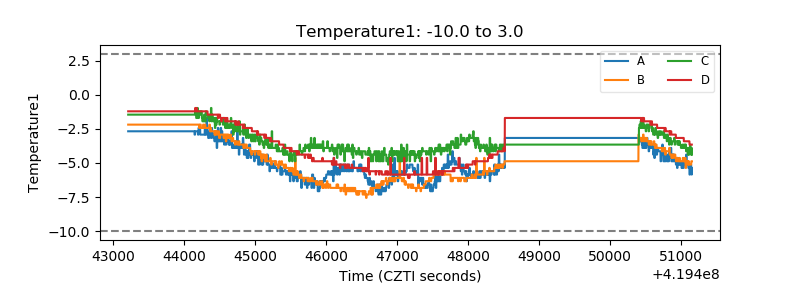 |
| Veto HV Monitor | 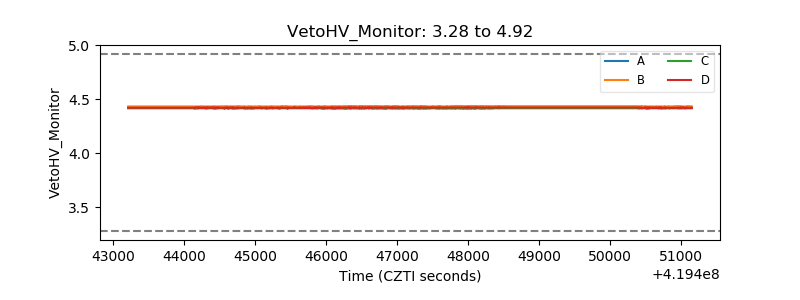 |
| Veto LLD | 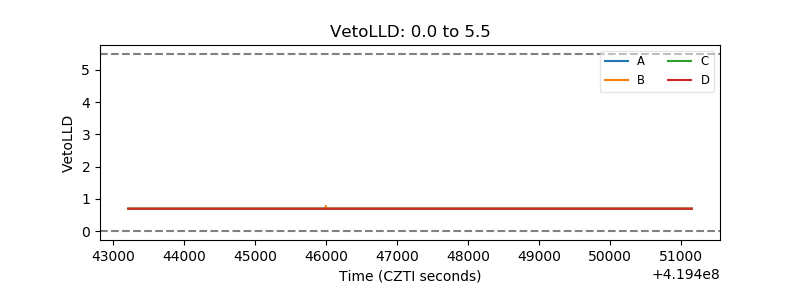 |
| Alpha Counter |  |
| _CPM_Rate |  |
| CZT Counter | 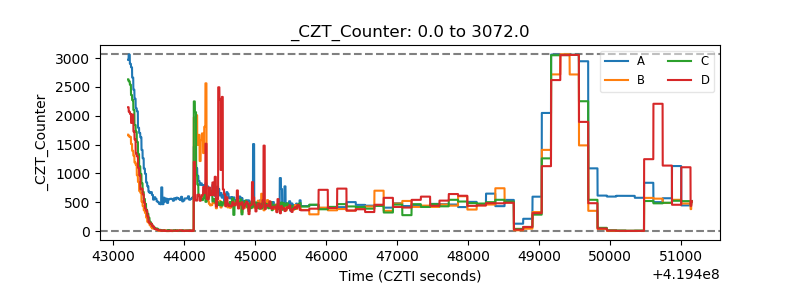 |
| +2.5 Volts monitor |  |
| +5 Volts monitor |  |
| _ROLL_ROT | 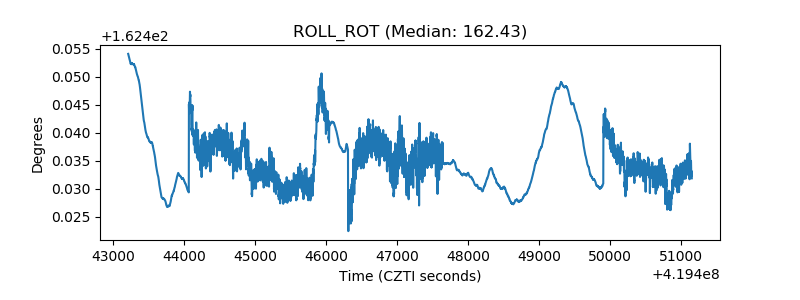 |
| _Roll_DEC | 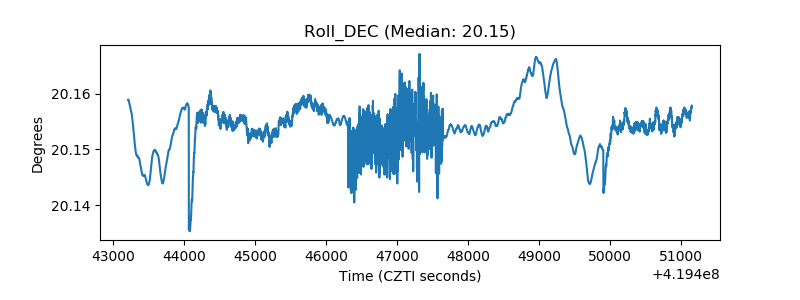 |
| _Roll_RA | 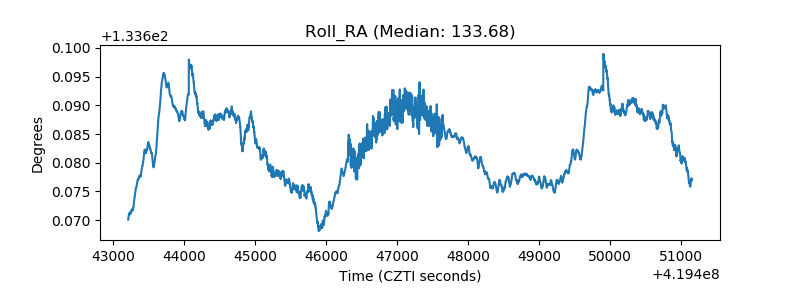 |
| Veto Counter | 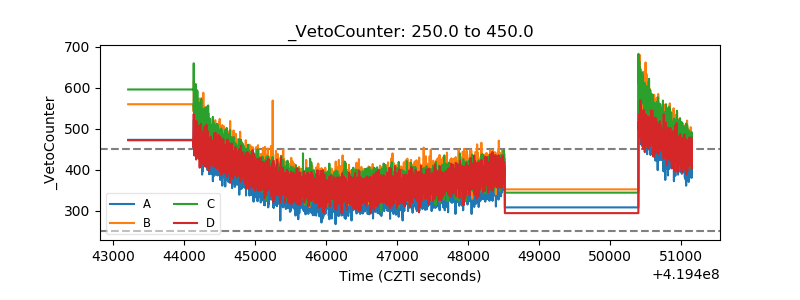 |