| Param | Original file | Final file |
|---|---|---|
| Filename | modeM0/AS1A12_104T02_9000005572_40837cztM0_level2.fits | modeM0/AS1A12_104T02_9000005572_40837cztM0_level2_quad_clean.evt |
| Size (bytes) | 435,121,920 | 81,169,920 |
| Size | 415.0 MB | 77.4 MB |
| Events in quadrant A | 2,836,397 | 597,356 |
| Events in quadrant B | 2,422,509 | 622,933 |
| Events in quadrant C | 2,534,338 | 579,634 |
| Events in quadrant D | 7,929,126 | 312,148 |
| Mode M9 | |||
|---|---|---|---|
| Quadrant | BADHDUFLAG | Total packets | Discarded packets |
| A | 0 | 35 | 0 |
| B | 0 | 35 | 0 |
| C | 0 | 35 | 0 |
| D | 0 | 36 | 0 |
| Mode M0 | |||
|---|---|---|---|
| Quadrant | BADHDUFLAG | Total packets | Discarded packets |
| A | 0 | 11377 | 3 |
| B | 0 | 10395 | 2 |
| C | 0 | 10440 | 2 |
| D | 0 | 26989 | 2 |
| Mode SS | |||
|---|---|---|---|
| Quadrant | BADHDUFLAG | Total packets | Discarded packets |
| A | 0 | 100 | 0 |
| B | 0 | 100 | 0 |
| C | 0 | 100 | 0 |
| D | 0 | 100 | 0 |
| Quadrant | Total seconds | Saturated seconds | Saturation percentage |
|---|---|---|---|
| A | 4933 | 50 | 1.013582% |
| B | 4933 | 30 | 0.608149% |
| C | 4933 | 43 | 0.871681% |
| D | 4933 | 2201 | 44.617880% |
Noise dominated data is calculated using 1-second bins in cleaned event files. If a bin has >2000 counts, and if more than 50% of those come from <1% of pixels, then it is considered to be noise-dominated and hence unusable.
| Quadrant | # 1 sec bins | Bins with >0 counts | Bins with >2000 counts | High rate bins dominated by noise | Noise dominated (total time) | Noise dominated (detector-on time) | Marked lightcurve |
|---|---|---|---|---|---|---|---|
| A | 7026 | 4934 | 40 | 40 | 0.57% | 0.81% | 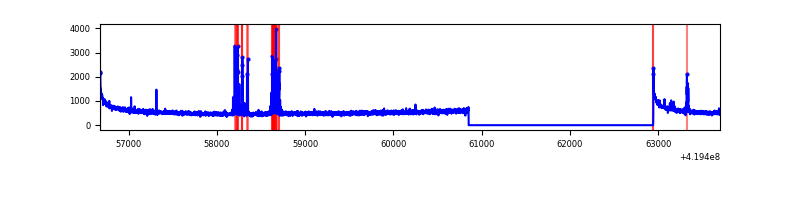 |
| B | 7026 | 4934 | 18 | 18 | 0.26% | 0.36% |  |
| C | 7026 | 4934 | 38 | 38 | 0.54% | 0.77% | 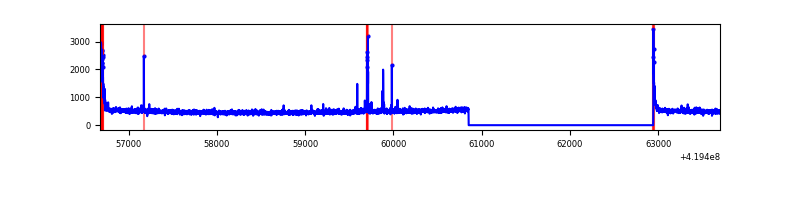 |
| D | 7026 | 4934 | 2156 | 2156 | 30.69% | 43.70% | 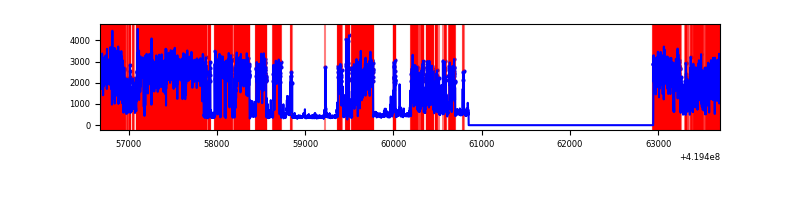 |
Top three noisy pixels from each quadrant. If the there are fewer than three noisy pixels in the level2.evt file, extra rows are filled as -1
| Pixel properties | Quadrant properties | ||||||
|---|---|---|---|---|---|---|---|
| Quadrant | DetID | PixID | Counts | Sigma | Mean | Median | Sigma |
| A | 10 | 83 | 463082 | 4009.22 | 564 | 555 | 115.4 |
| A | 13 | 248 | 173302 | 1497.38 | 564 | 555 | 115.4 |
| A | 12 | 189 | 12315 | 101.94 | 564 | 555 | 115.4 |
| B | 5 | 255 | 179248 | 1659.52 | 568 | 554 | 107.7 |
| B | 12 | 111 | 13459 | 119.84 | 568 | 554 | 107.7 |
| B | 11 | 111 | 12516 | 111.09 | 568 | 554 | 107.7 |
| C | 15 | 214 | 212650 | 1642.54 | 553 | 557 | 129.1 |
| C | 0 | 10 | 115588 | 890.85 | 553 | 557 | 129.1 |
| C | 14 | 254 | 42532 | 325.07 | 553 | 557 | 129.1 |
| D | 12 | 79 | 4858516 | 44895.81 | 443 | 432 | 108.2 |
| D | 13 | 171 | 913629 | 8439.28 | 443 | 432 | 108.2 |
| D | 13 | 249 | 176477 | 1626.91 | 443 | 432 | 108.2 |
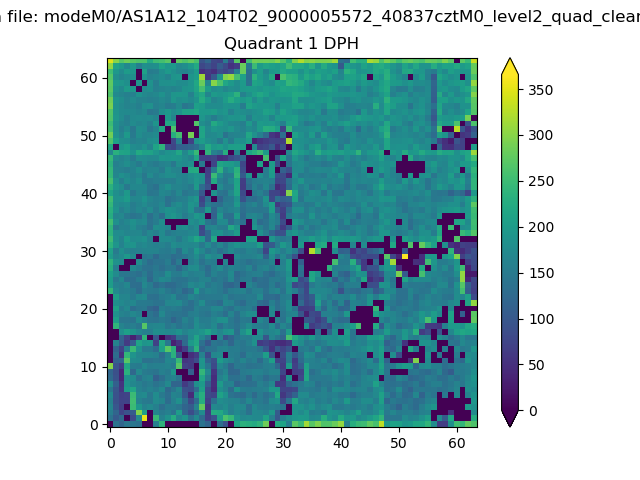
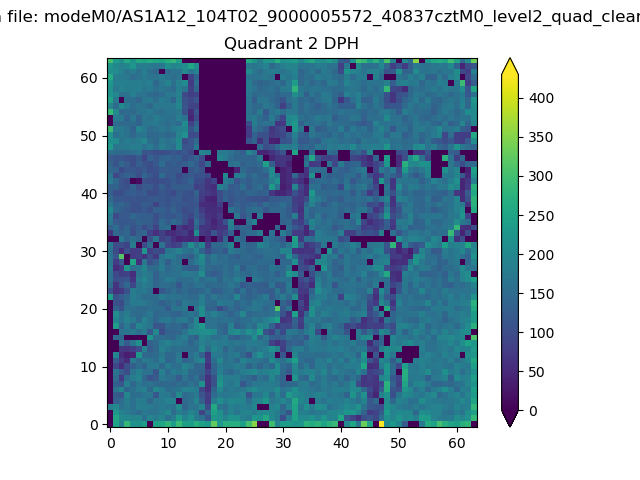
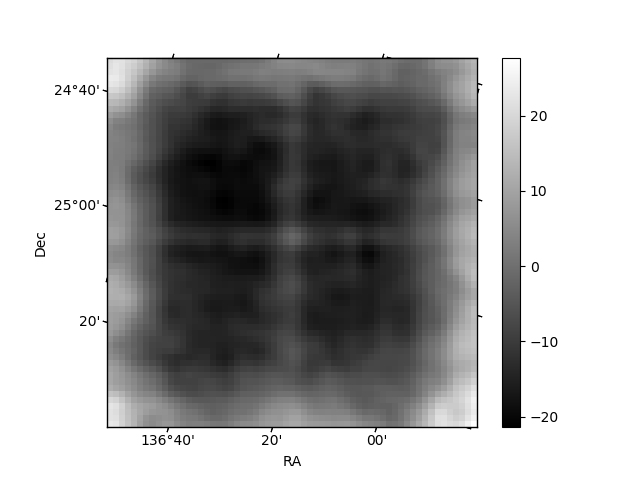
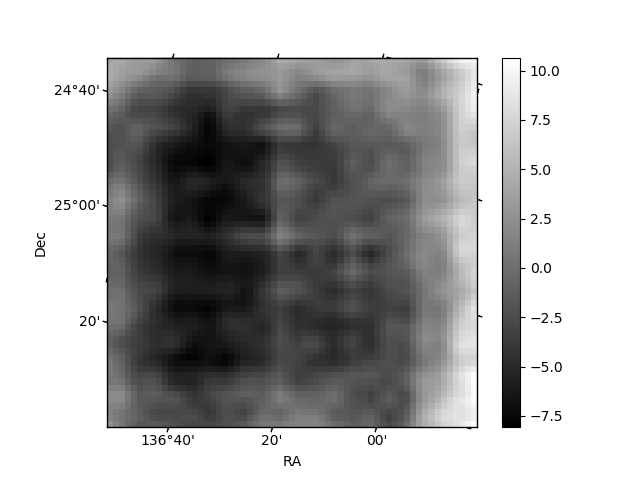
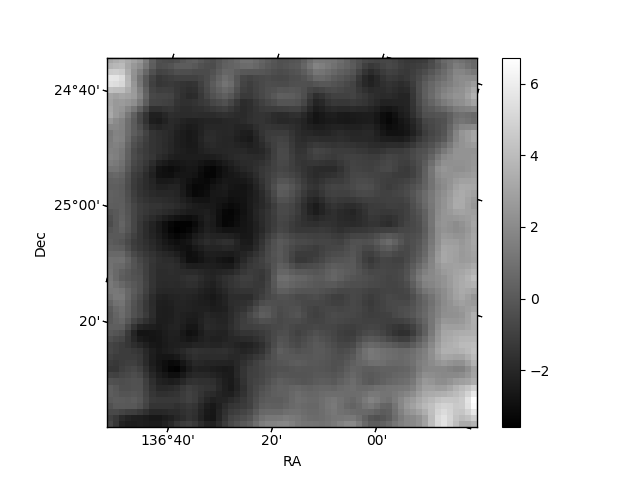
Histogram calculated using DETX and DETY for each event in the final _common_clean file
| Quadrant A | 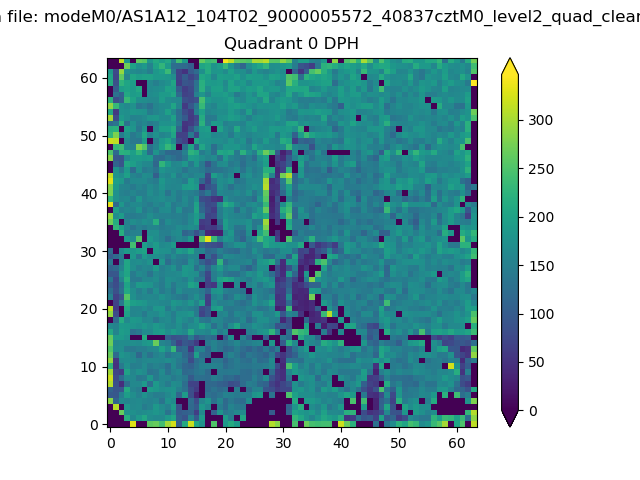 |
 |
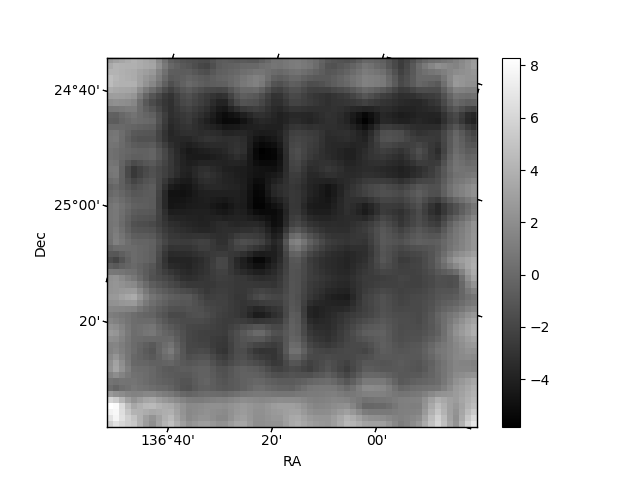
Quadrant B |
|---|---|---|---|
| Quadrant D | 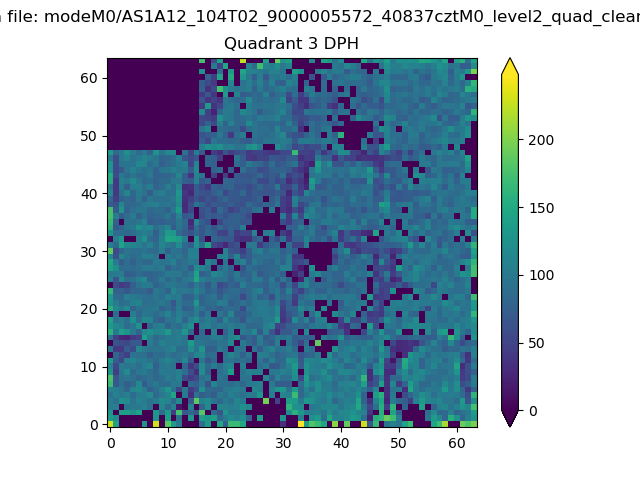 |
 |
Quadrant C |
| Plot type | Count rate plots | Images |
|---|---|---|
| Comparison with Poisson distribution Blue bars denote a histogram of data divided into 1 sec bins. Red curve is a Poisson curve with rate = median count rate of data. |
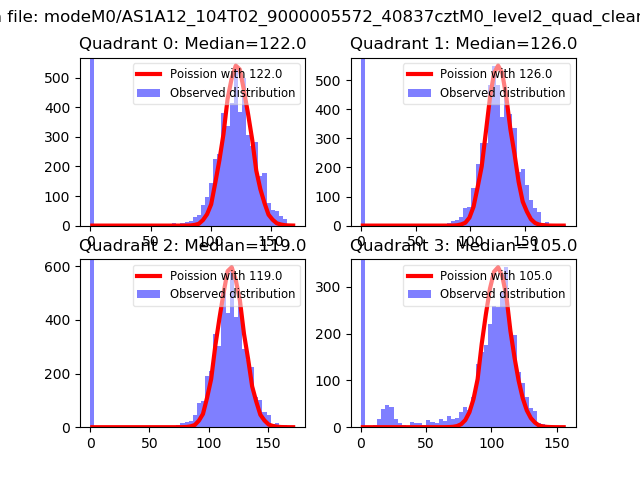 |
 |
| Quadrant-wise count rates Data is divided into 100 sec bins |
 |
|
| Module-wise count rates for Quadrant A Data is divided into 100 sec bins |
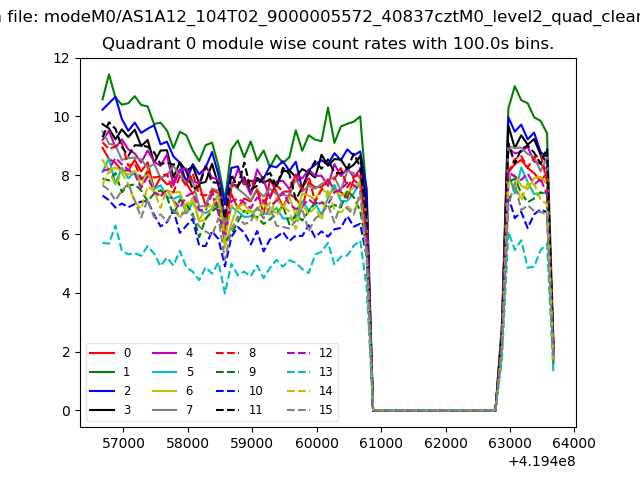 |
 |
| Module-wise count rates for Quadrant B Data is divided into 100 sec bins |
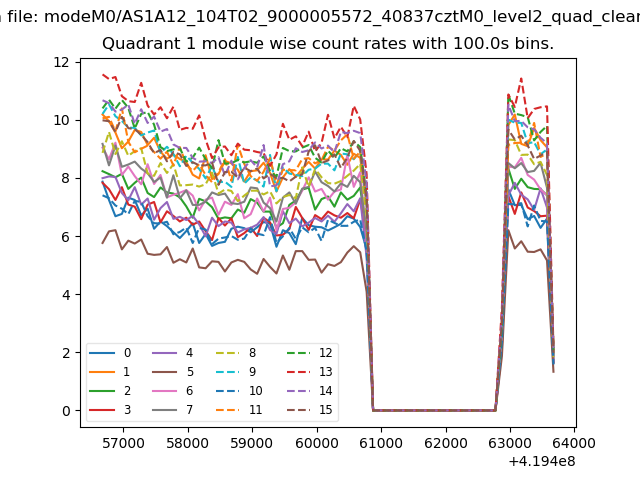 |
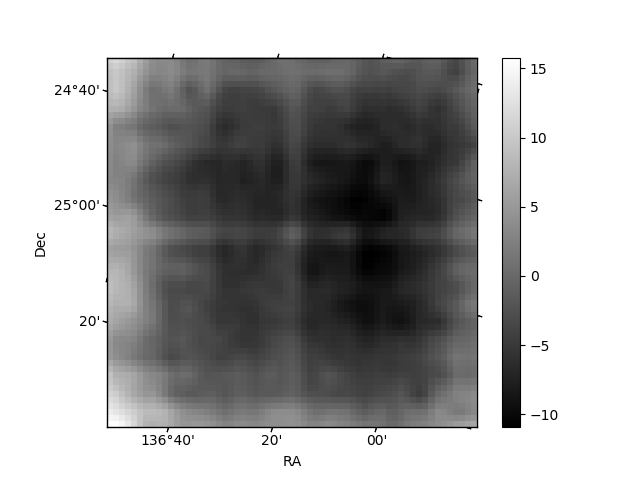 |
| Module-wise count rates for Quadrant C Data is divided into 100 sec bins |
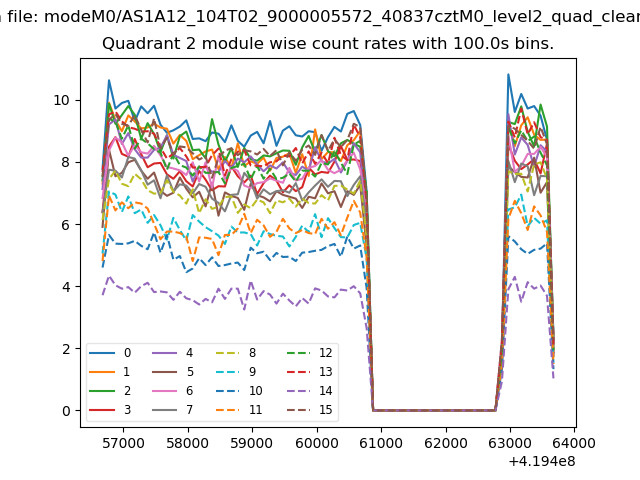 |
 |
| Module-wise count rates for Quadrant D Data is divided into 100 sec bins |
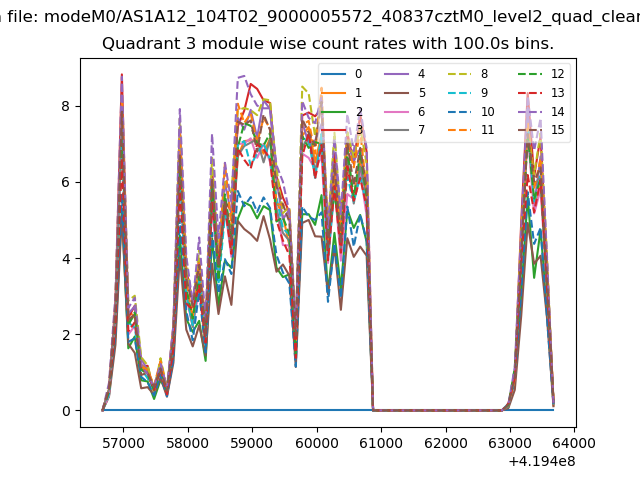 |
 |
| Parameter | Plot |
|---|---|
| CZT HV Monitor | 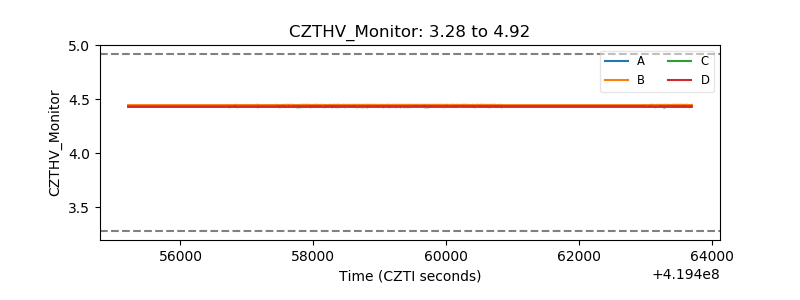 |
| D_VDD | 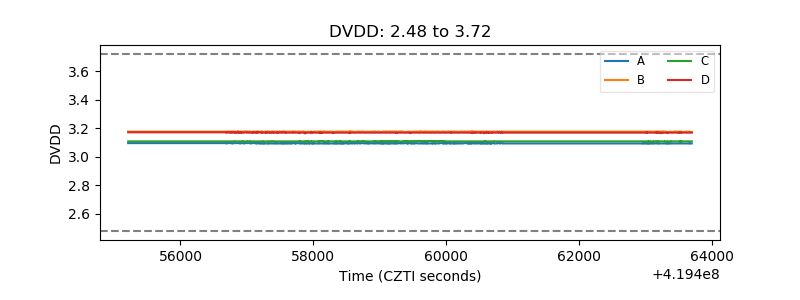 |
| Temperature 1 | 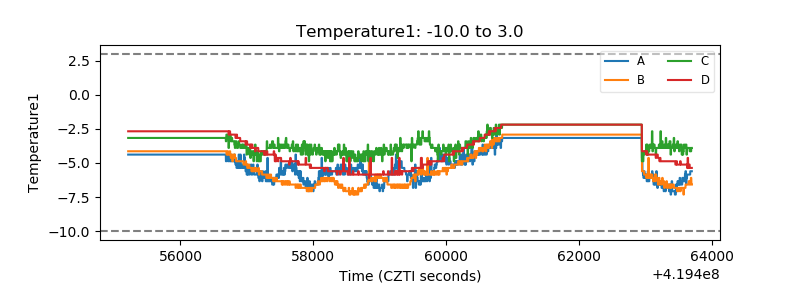 |
| Veto HV Monitor | 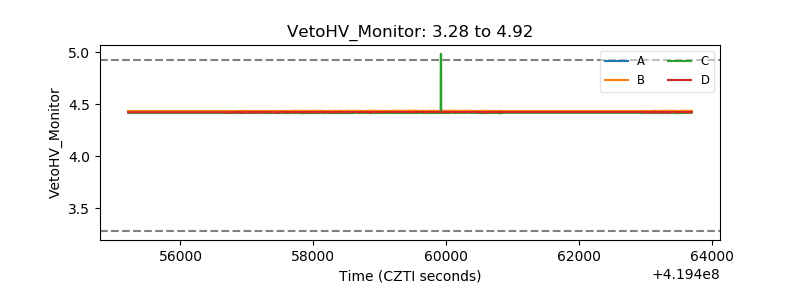 |
| Veto LLD | 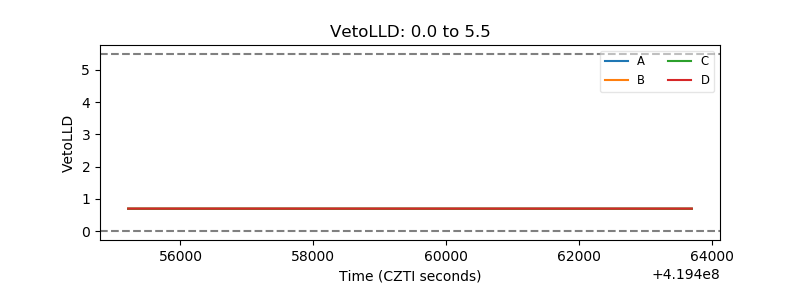 |
| Alpha Counter | 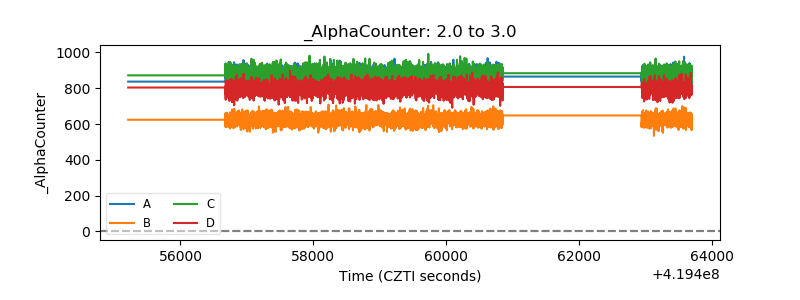 |
| _CPM_Rate | 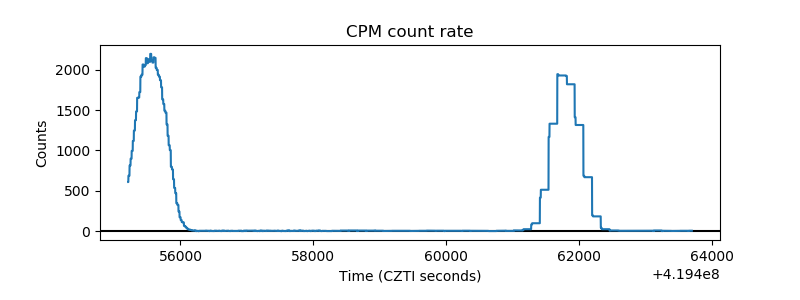 |
| CZT Counter | 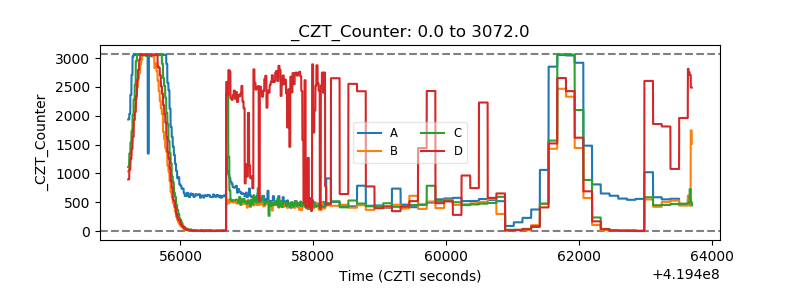 |
| +2.5 Volts monitor |  |
| +5 Volts monitor | 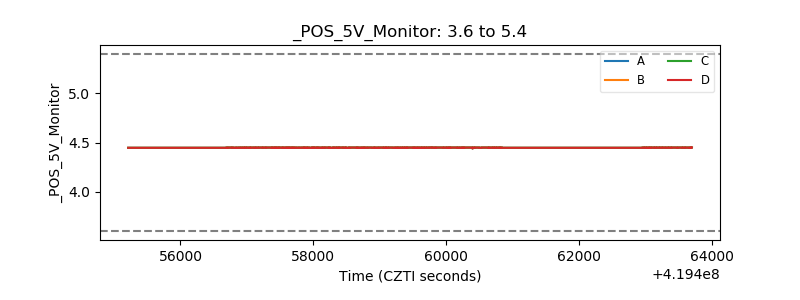 |
| _ROLL_ROT |  |
| _Roll_DEC | 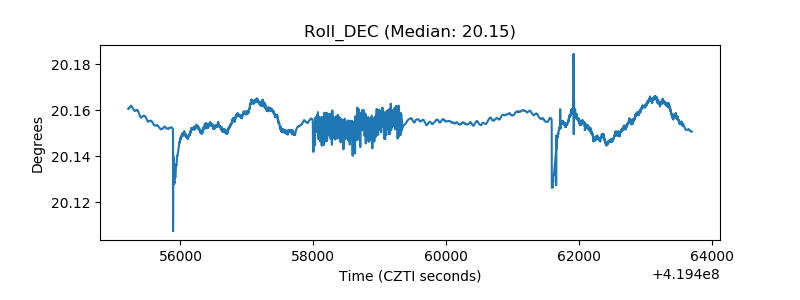 |
| _Roll_RA | 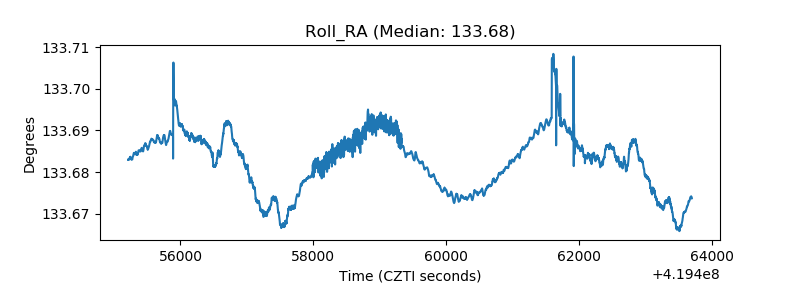 |
| Veto Counter | 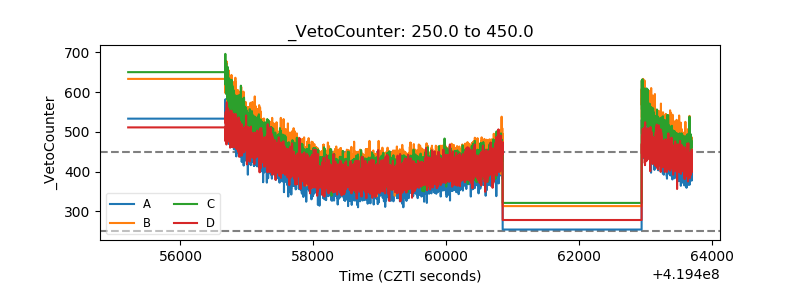 |