| Param | Original file | Final file |
|---|---|---|
| Filename | modeM0/AS1A12_104T02_9000005572_40838cztM0_level2.fits | modeM0/AS1A12_104T02_9000005572_40838cztM0_level2_quad_clean.evt |
| Size (bytes) | 460,054,080 | 78,554,880 |
| Size | 438.7 MB | 74.9 MB |
| Events in quadrant A | 2,749,073 | 580,403 |
| Events in quadrant B | 2,395,580 | 603,663 |
| Events in quadrant C | 2,453,137 | 564,967 |
| Events in quadrant D | 9,050,674 | 286,634 |
| Mode M9 | |||
|---|---|---|---|
| Quadrant | BADHDUFLAG | Total packets | Discarded packets |
| A | 0 | 37 | 0 |
| B | 0 | 37 | 0 |
| C | 0 | 37 | 0 |
| D | 0 | 38 | 0 |
| Mode M0 | |||
|---|---|---|---|
| Quadrant | BADHDUFLAG | Total packets | Discarded packets |
| A | 0 | 11114 | 3 |
| B | 0 | 10321 | 2 |
| C | 0 | 10210 | 2 |
| D | 0 | 30282 | 2 |
| Mode SS | |||
|---|---|---|---|
| Quadrant | BADHDUFLAG | Total packets | Discarded packets |
| A | 0 | 98 | 0 |
| B | 0 | 98 | 0 |
| C | 0 | 98 | 0 |
| D | 0 | 98 | 0 |
| Quadrant | Total seconds | Saturated seconds | Saturation percentage |
|---|---|---|---|
| A | 4895 | 32 | 0.653728% |
| B | 4895 | 24 | 0.490296% |
| C | 4895 | 26 | 0.531154% |
| D | 4895 | 2474 | 50.541369% |
Noise dominated data is calculated using 1-second bins in cleaned event files. If a bin has >2000 counts, and if more than 50% of those come from <1% of pixels, then it is considered to be noise-dominated and hence unusable.
| Quadrant | # 1 sec bins | Bins with >0 counts | Bins with >2000 counts | High rate bins dominated by noise | Noise dominated (total time) | Noise dominated (detector-on time) | Marked lightcurve |
|---|---|---|---|---|---|---|---|
| A | 7048 | 4896 | 20 | 20 | 0.28% | 0.41% | 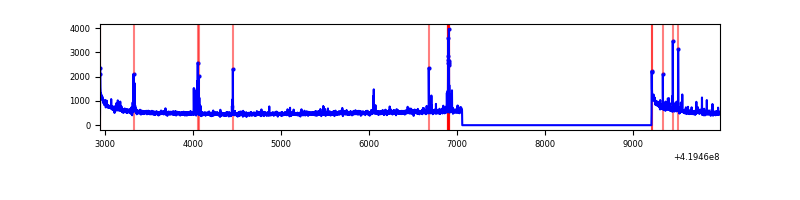 |
| B | 7048 | 4896 | 20 | 20 | 0.28% | 0.41% | 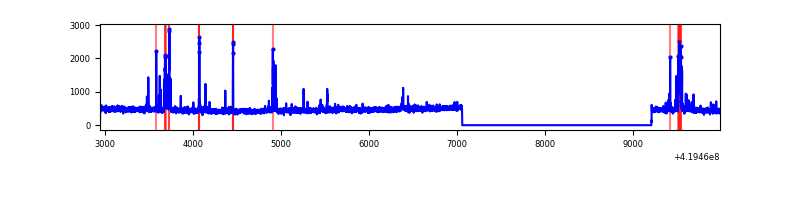 |
| C | 7048 | 4896 | 19 | 19 | 0.27% | 0.39% |  |
| D | 7048 | 4896 | 2396 | 2396 | 34.00% | 48.94% | 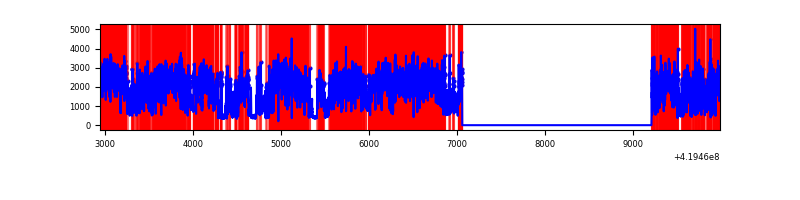 |
Top three noisy pixels from each quadrant. If the there are fewer than three noisy pixels in the level2.evt file, extra rows are filled as -1
| Pixel properties | Quadrant properties | ||||||
|---|---|---|---|---|---|---|---|
| Quadrant | DetID | PixID | Counts | Sigma | Mean | Median | Sigma |
| A | 10 | 83 | 454142 | 3983.12 | 554 | 546 | 113.9 |
| A | 13 | 248 | 117525 | 1027.22 | 554 | 546 | 113.9 |
| A | 2 | 79 | 20416 | 174.48 | 554 | 546 | 113.9 |
| B | 5 | 255 | 188735 | 1729.09 | 559 | 544 | 108.8 |
| B | 12 | 111 | 13785 | 121.66 | 559 | 544 | 108.8 |
| B | 11 | 111 | 12586 | 110.64 | 559 | 544 | 108.8 |
| C | 15 | 214 | 211597 | 1665.69 | 542 | 547 | 126.7 |
| C | 0 | 10 | 86913 | 681.63 | 542 | 547 | 126.7 |
| C | 14 | 254 | 34540 | 268.29 | 542 | 547 | 126.7 |
| D | 12 | 79 | 4019820 | 38389.15 | 421 | 410 | 104.7 |
| D | 13 | 171 | 2713010 | 25907.88 | 421 | 410 | 104.7 |
| D | 13 | 249 | 384631 | 3669.67 | 421 | 410 | 104.7 |
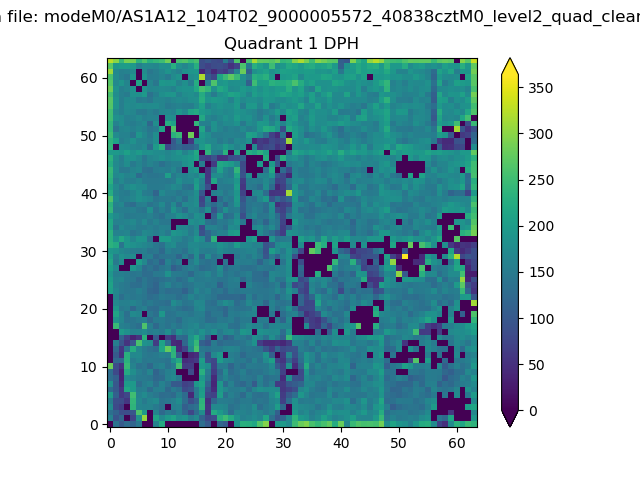
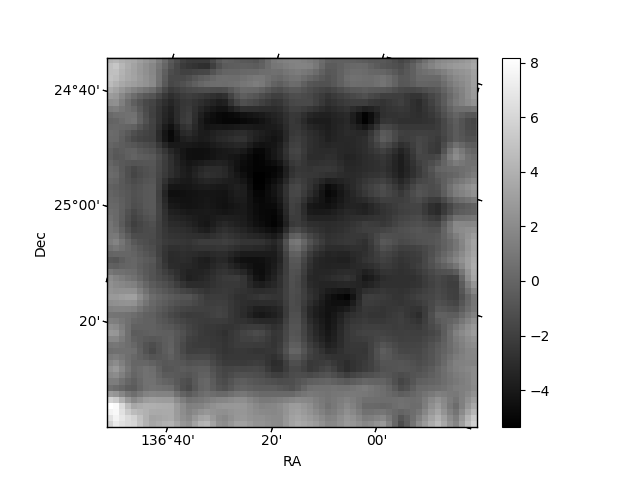
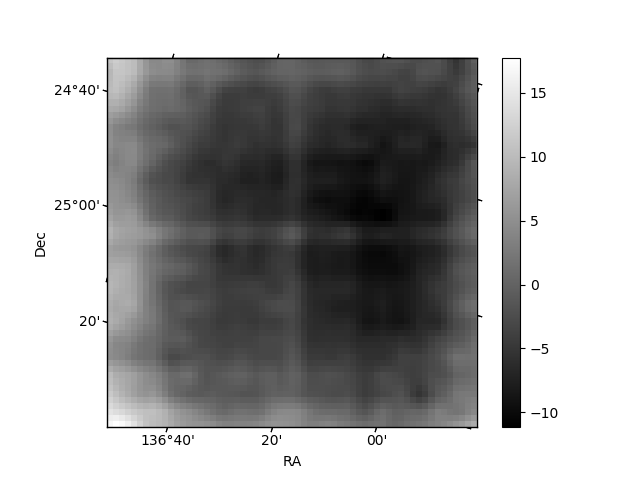
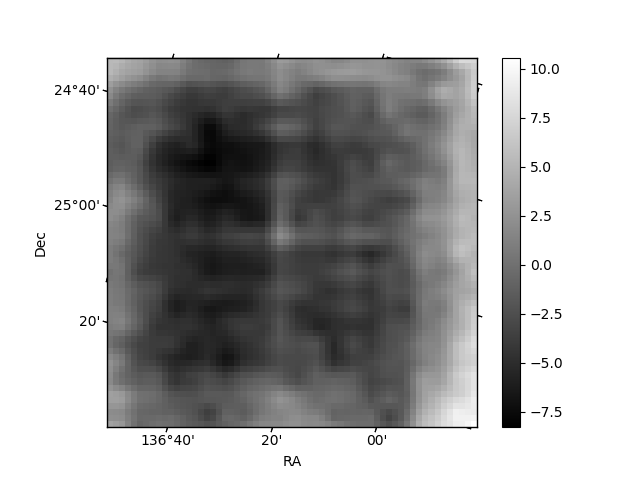
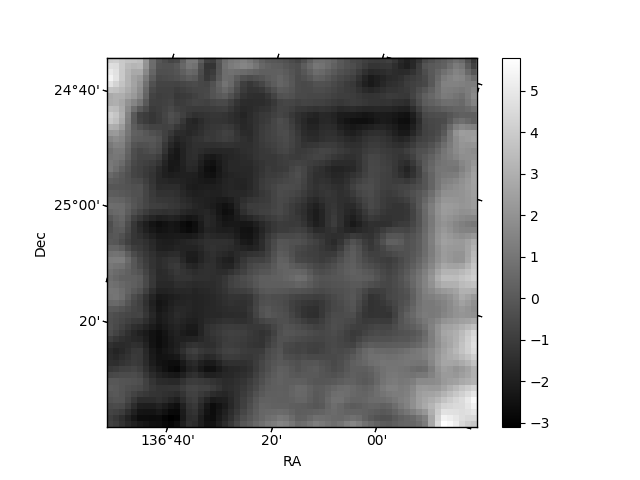
Histogram calculated using DETX and DETY for each event in the final _common_clean file
| Quadrant A | 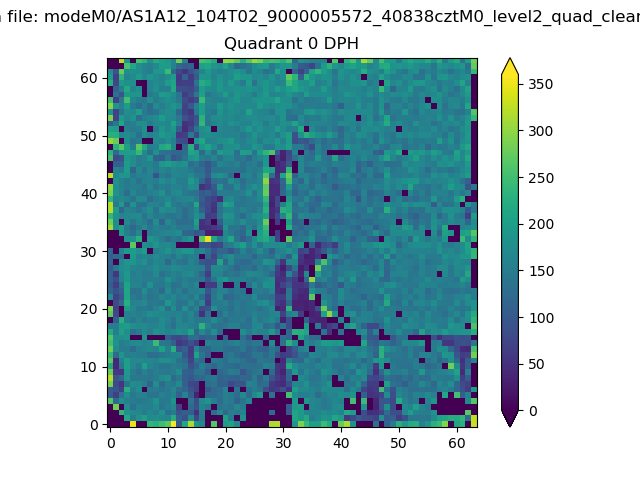 |
 |
Quadrant B |
|---|---|---|---|
| Quadrant D | 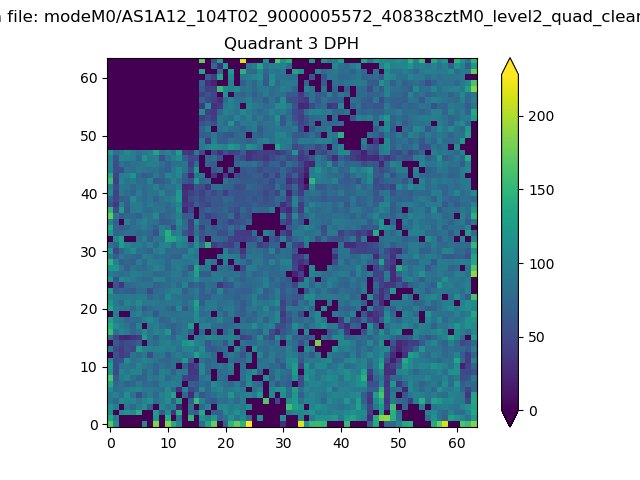 |
 |
Quadrant C |
| Plot type | Count rate plots | Images |
|---|---|---|
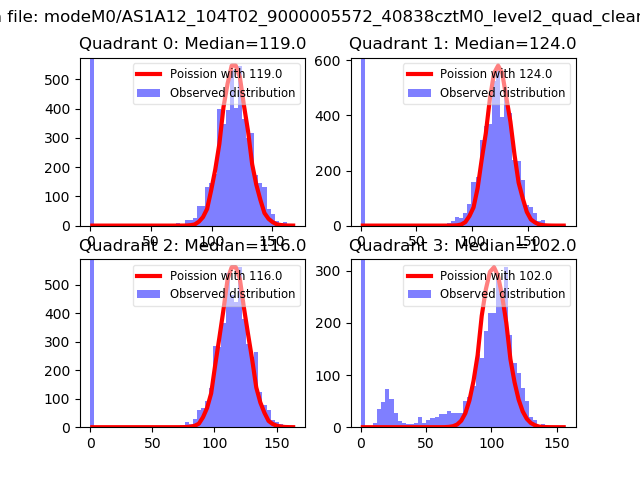
| Comparison with Poisson distribution Blue bars denote a histogram of data divided into 1 sec bins. Red curve is a Poisson curve with rate = median count rate of data. |
 |
 |
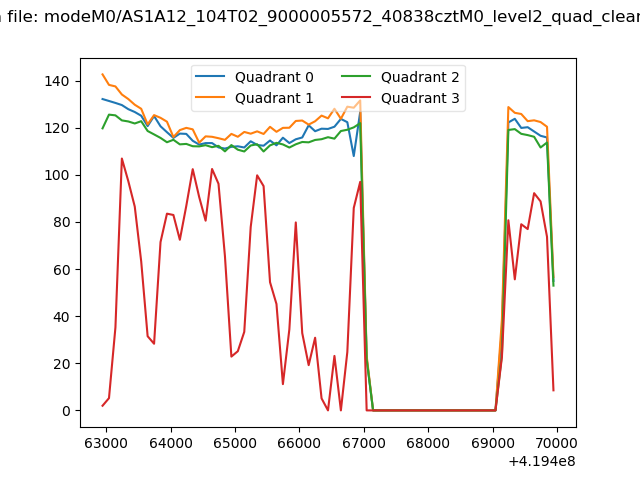
| Quadrant-wise count rates Data is divided into 100 sec bins |
 |
|
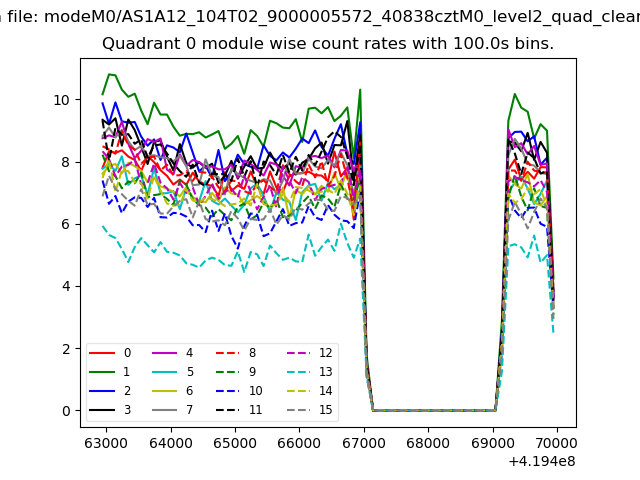
| Module-wise count rates for Quadrant A Data is divided into 100 sec bins |
 |
 |
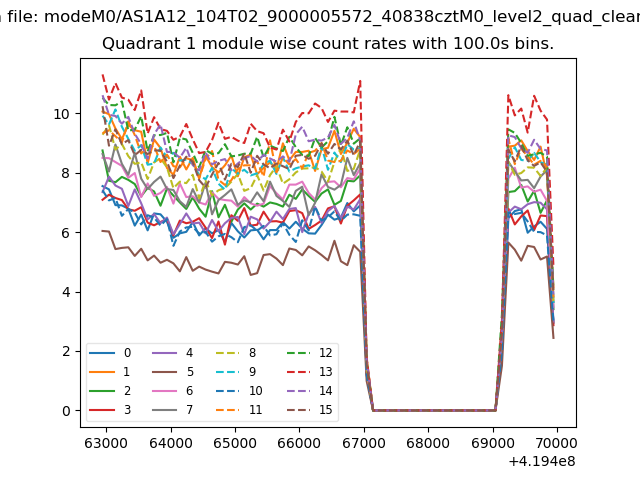
| Module-wise count rates for Quadrant B Data is divided into 100 sec bins |
 |
 |
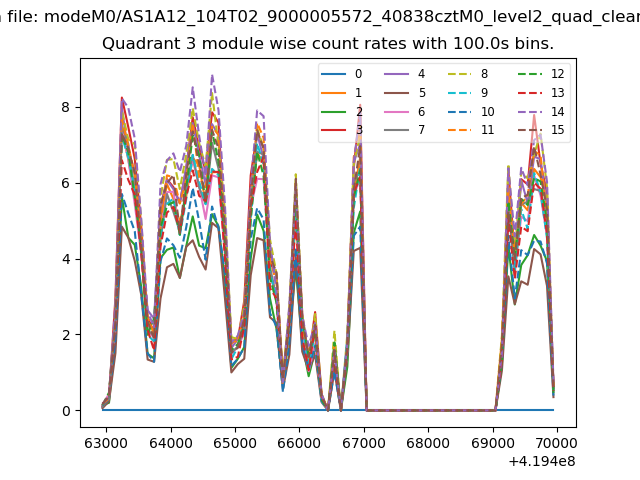
| Module-wise count rates for Quadrant C Data is divided into 100 sec bins |
 |
 |
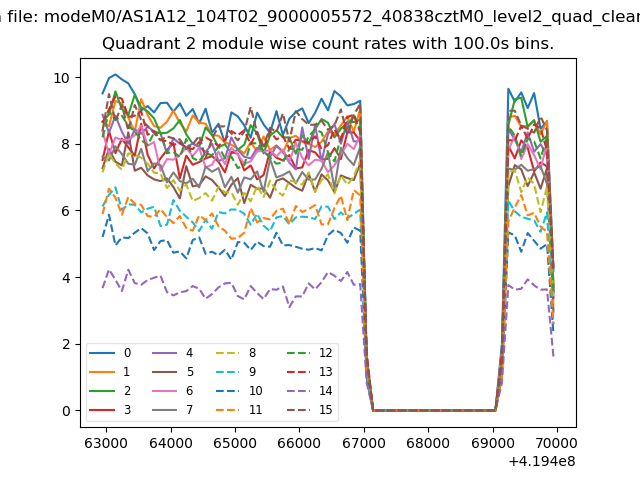
| Module-wise count rates for Quadrant D Data is divided into 100 sec bins |
 |
 |
| Parameter | Plot |
|---|---|
| CZT HV Monitor |  |
| D_VDD | 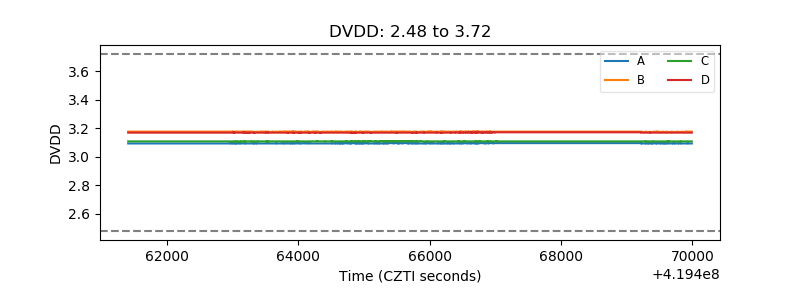 |
| Temperature 1 | 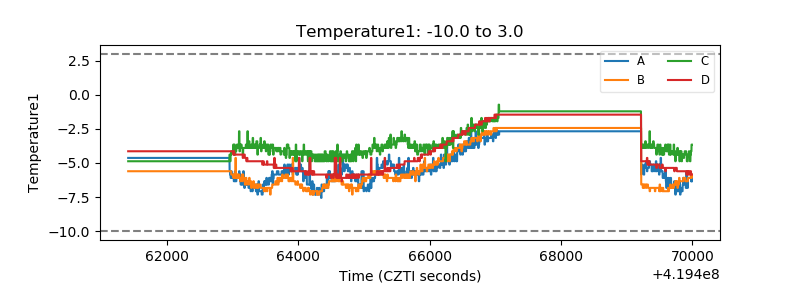 |
| Veto HV Monitor | 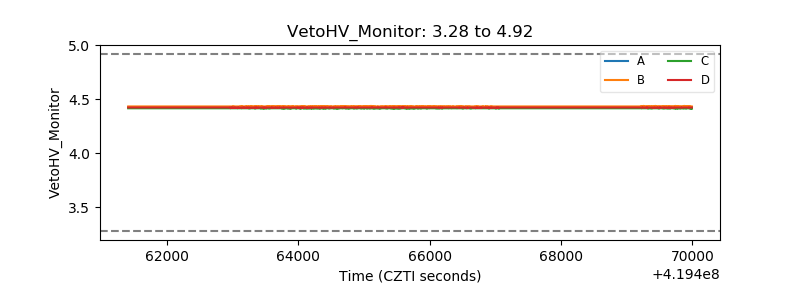 |
| Veto LLD | 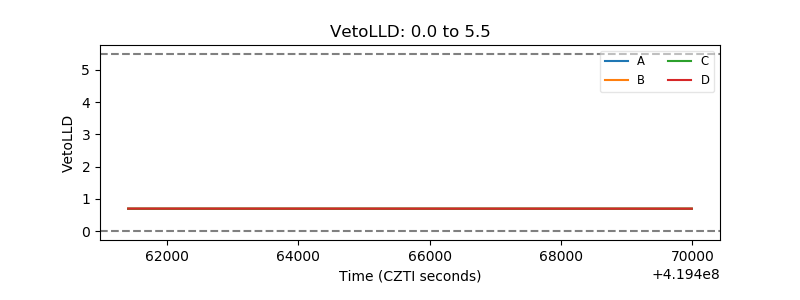 |
| Alpha Counter | 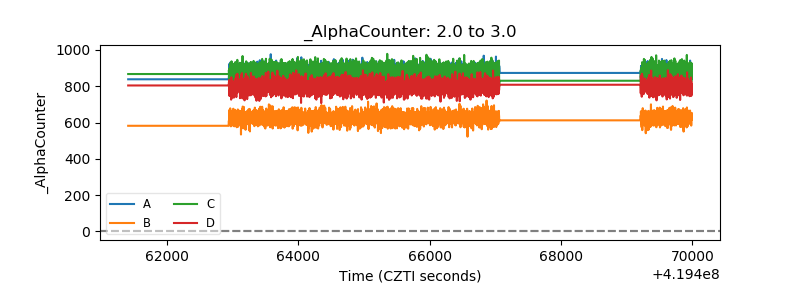 |
| _CPM_Rate |  |
| CZT Counter | 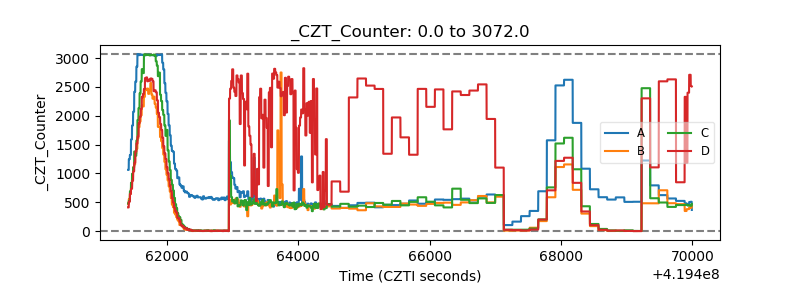 |
| +2.5 Volts monitor |  |
| +5 Volts monitor | 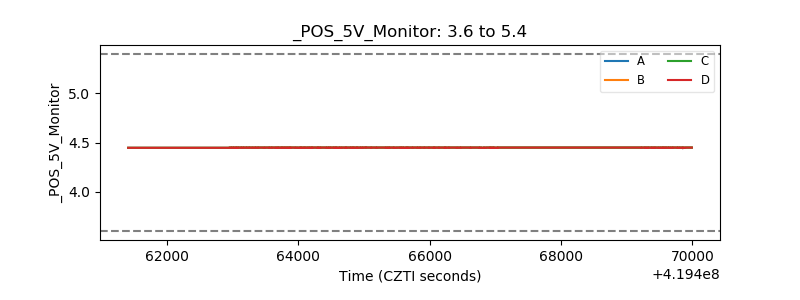 |
| _ROLL_ROT | 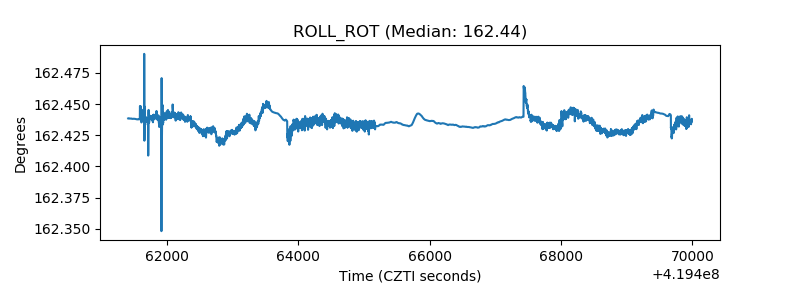 |
| _Roll_DEC | 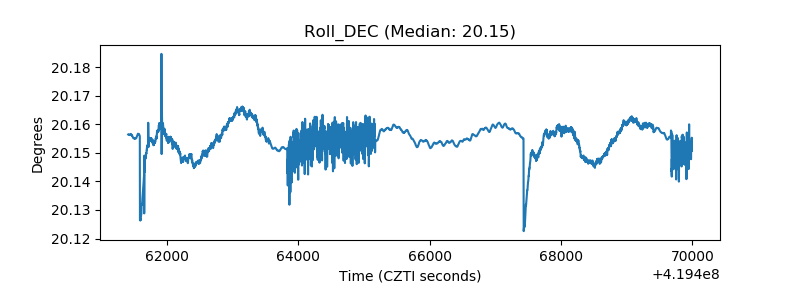 |
| _Roll_RA | 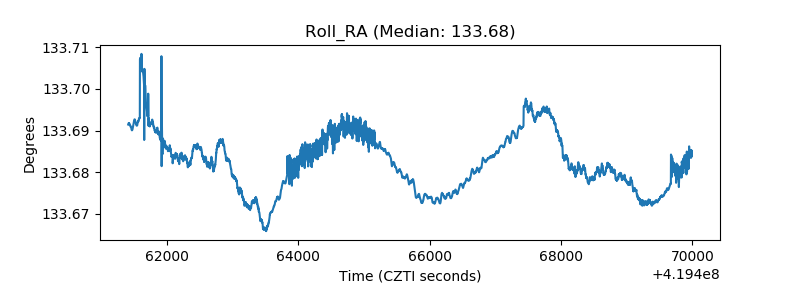 |
| Veto Counter | 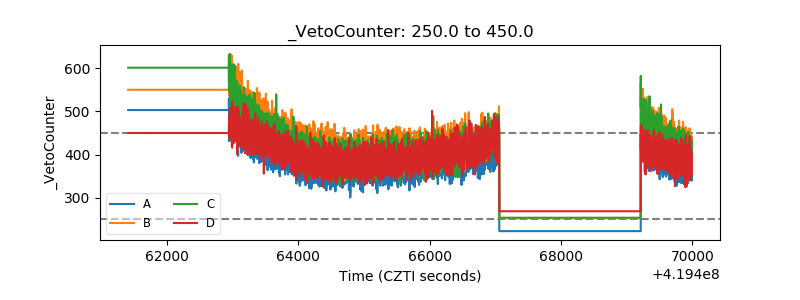 |