| Param | Original file | Final file |
|---|---|---|
| Filename | modeM0/AS1A12_104T02_9000005572_40839cztM0_level2.fits | modeM0/AS1A12_104T02_9000005572_40839cztM0_level2_quad_clean.evt |
| Size (bytes) | 399,784,320 | 80,916,480 |
| Size | 381.3 MB | 77.2 MB |
| Events in quadrant A | 2,816,241 | 560,307 |
| Events in quadrant B | 2,260,949 | 581,538 |
| Events in quadrant C | 2,622,107 | 545,163 |
| Events in quadrant D | 6,715,258 | 416,967 |
| Mode M9 | |||
|---|---|---|---|
| Quadrant | BADHDUFLAG | Total packets | Discarded packets |
| A | 0 | 42 | 0 |
| B | 0 | 42 | 0 |
| C | 0 | 42 | 0 |
| D | 0 | 42 | 0 |
| Mode M0 | |||
|---|---|---|---|
| Quadrant | BADHDUFLAG | Total packets | Discarded packets |
| A | 0 | 11338 | 3 |
| B | 0 | 10143 | 2 |
| C | 0 | 10819 | 2 |
| D | 0 | 23382 | 2 |
| Mode SS | |||
|---|---|---|---|
| Quadrant | BADHDUFLAG | Total packets | Discarded packets |
| A | 0 | 100 | 0 |
| B | 0 | 100 | 0 |
| C | 0 | 100 | 0 |
| D | 0 | 100 | 0 |
| Quadrant | Total seconds | Saturated seconds | Saturation percentage |
|---|---|---|---|
| A | 4937 | 24 | 0.486125% |
| B | 4937 | 9 | 0.182297% |
| C | 4937 | 63 | 1.276079% |
| D | 4937 | 1081 | 21.895888% |
Noise dominated data is calculated using 1-second bins in cleaned event files. If a bin has >2000 counts, and if more than 50% of those come from <1% of pixels, then it is considered to be noise-dominated and hence unusable.
| Quadrant | # 1 sec bins | Bins with >0 counts | Bins with >2000 counts | High rate bins dominated by noise | Noise dominated (total time) | Noise dominated (detector-on time) | Marked lightcurve |
|---|---|---|---|---|---|---|---|
| A | 7029 | 4938 | 18 | 18 | 0.26% | 0.36% | 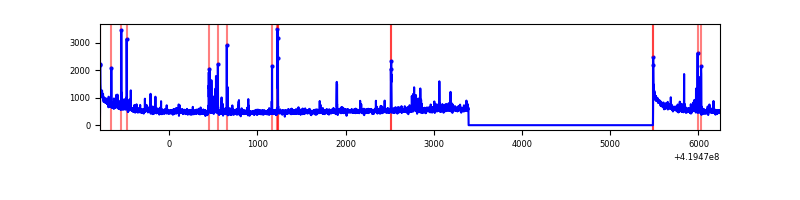 |
| B | 7029 | 4938 | 8 | 8 | 0.11% | 0.16% | 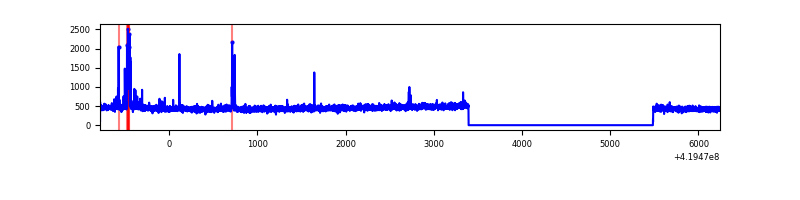 |
| C | 7029 | 4938 | 57 | 57 | 0.81% | 1.15% | 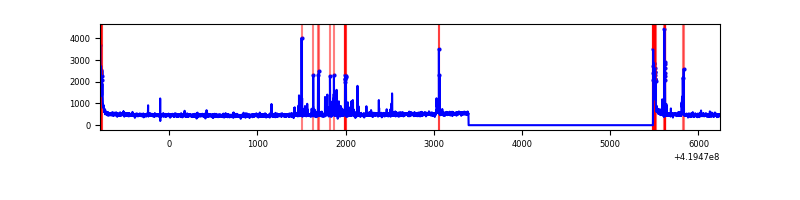 |
| D | 7029 | 4938 | 1189 | 1189 | 16.92% | 24.08% | 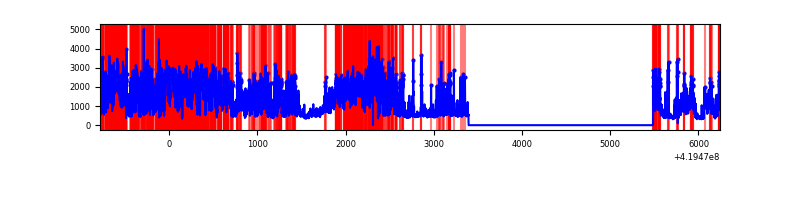 |
Top three noisy pixels from each quadrant. If the there are fewer than three noisy pixels in the level2.evt file, extra rows are filled as -1
| Pixel properties | Quadrant properties | ||||||
|---|---|---|---|---|---|---|---|
| Quadrant | DetID | PixID | Counts | Sigma | Mean | Median | Sigma |
| A | 10 | 83 | 465795 | 4092.37 | 551 | 541 | 113.7 |
| A | 13 | 248 | 130452 | 1142.7 | 551 | 541 | 113.7 |
| A | 2 | 79 | 44589 | 387.45 | 551 | 541 | 113.7 |
| B | 5 | 255 | 91824 | 850.29 | 550 | 535 | 107.4 |
| B | 12 | 111 | 13559 | 121.31 | 550 | 535 | 107.4 |
| B | 11 | 111 | 12600 | 112.38 | 550 | 535 | 107.4 |
| C | 15 | 214 | 213176 | 1685.78 | 537 | 540 | 126.1 |
| C | 14 | 254 | 180256 | 1424.79 | 537 | 540 | 126.1 |
| C | 0 | 10 | 121783 | 961.21 | 537 | 540 | 126.1 |
| D | 12 | 79 | 3113245 | 25389.42 | 495 | 480 | 122.6 |
| D | 5 | 222 | 618774 | 5043.14 | 495 | 480 | 122.6 |
| D | 2 | 249 | 521027 | 4245.86 | 495 | 480 | 122.6 |
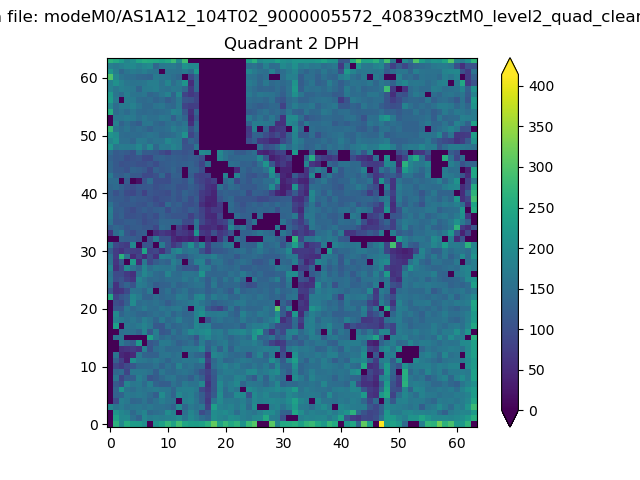
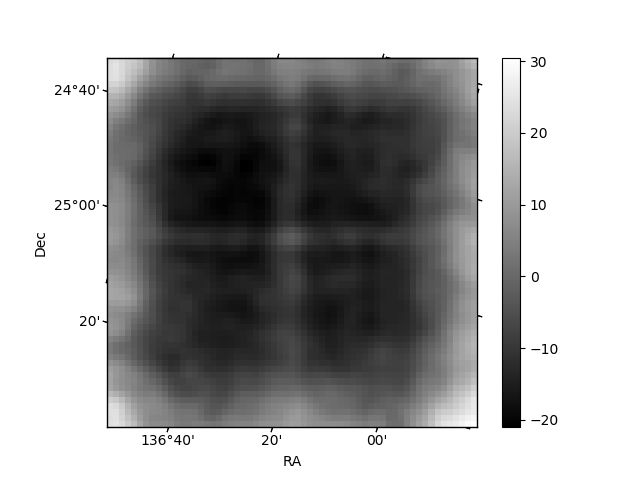
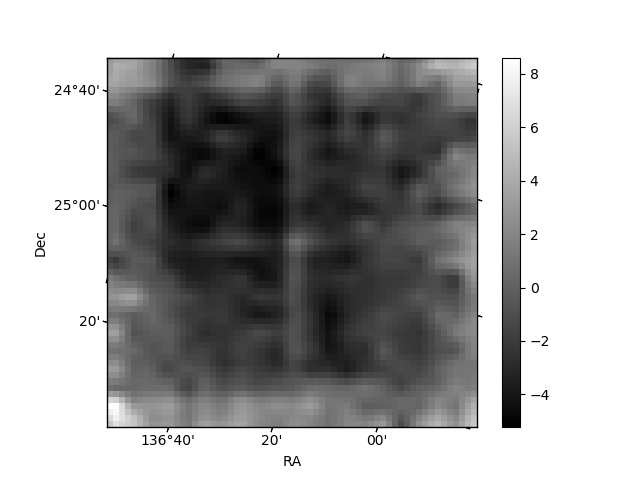
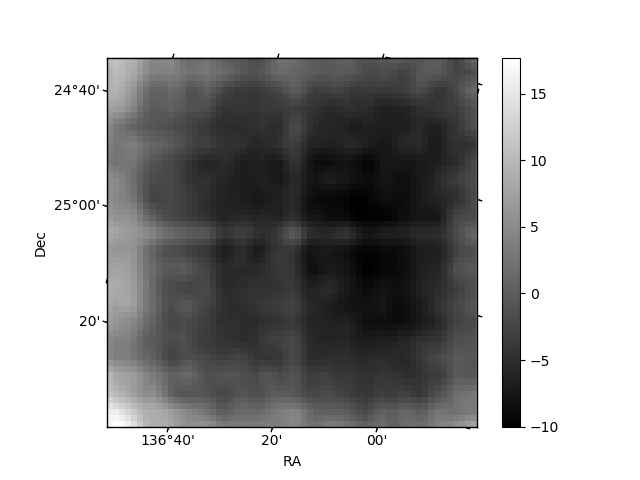
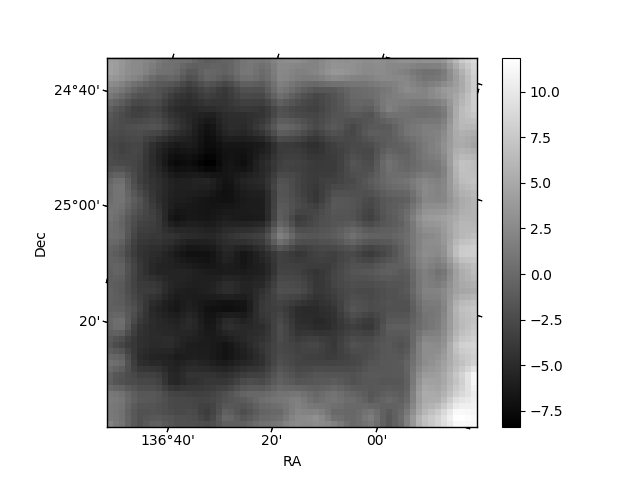
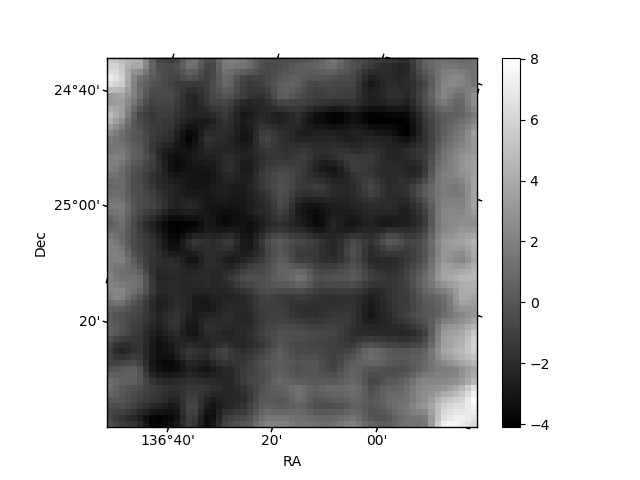
Histogram calculated using DETX and DETY for each event in the final _common_clean file
| Quadrant A | 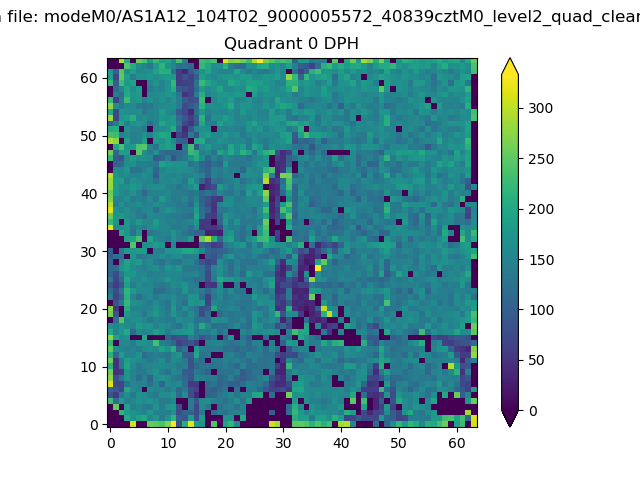 |
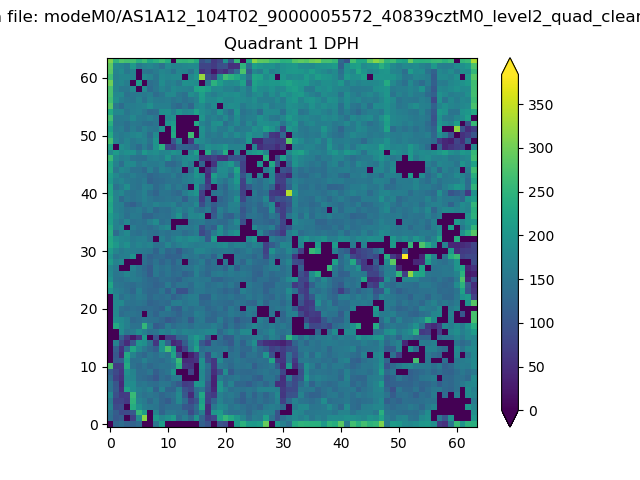 |
Quadrant B |
|---|---|---|---|
| Quadrant D | 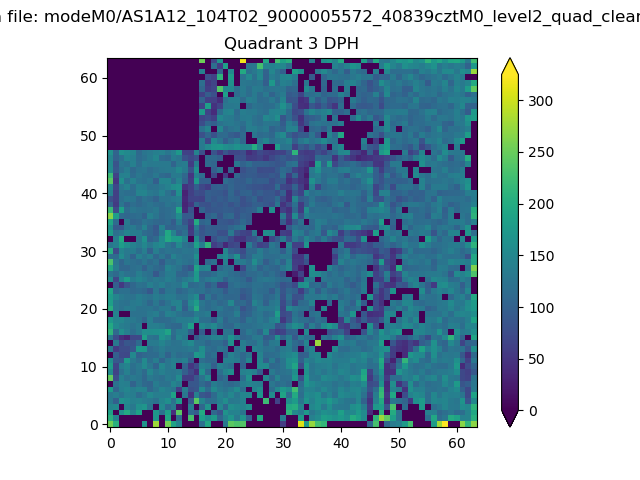 |
 |
Quadrant C |
| Plot type | Count rate plots | Images |
|---|---|---|
| Comparison with Poisson distribution Blue bars denote a histogram of data divided into 1 sec bins. Red curve is a Poisson curve with rate = median count rate of data. |
 |
 |
| Quadrant-wise count rates Data is divided into 100 sec bins |
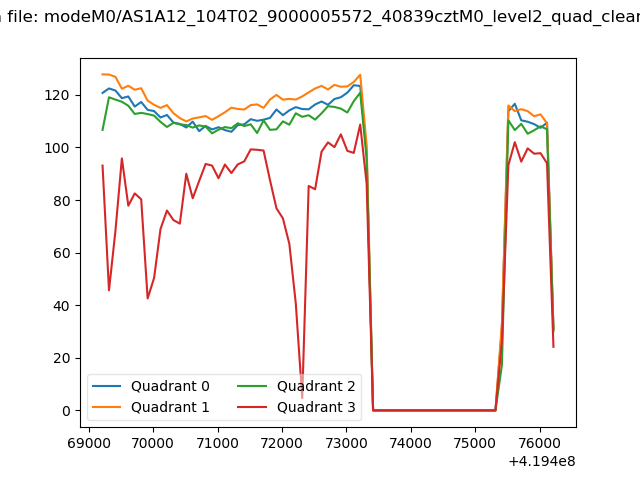 |
|
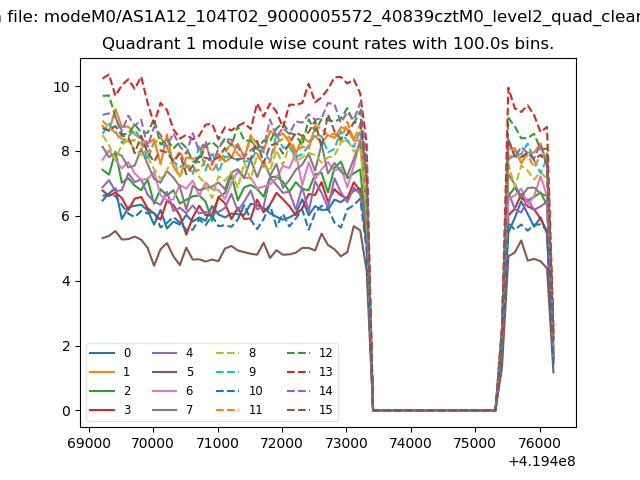
| Module-wise count rates for Quadrant A Data is divided into 100 sec bins |
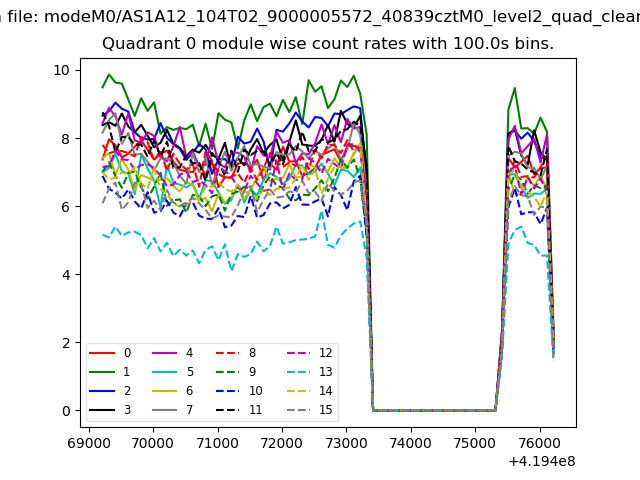 |
 |
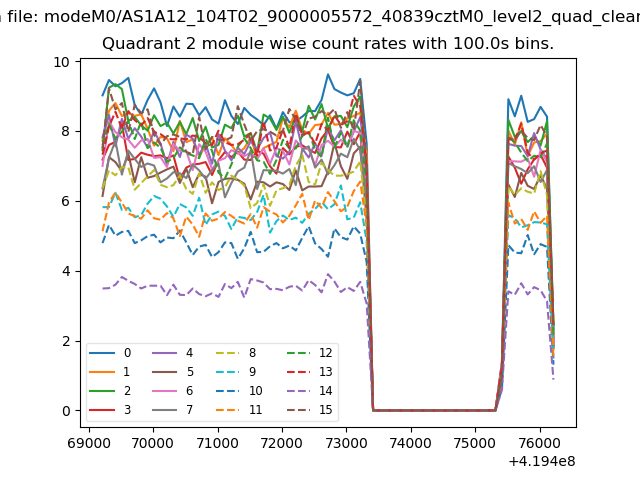
| Module-wise count rates for Quadrant B Data is divided into 100 sec bins |
 |
 |
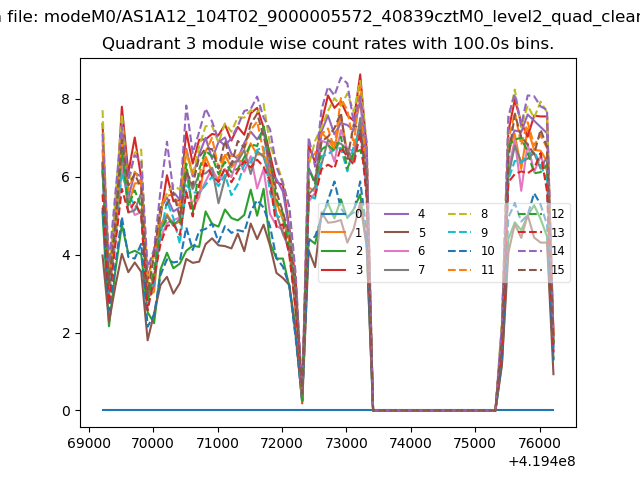
| Module-wise count rates for Quadrant C Data is divided into 100 sec bins |
 |
 |
| Module-wise count rates for Quadrant D Data is divided into 100 sec bins |
 |
 |
| Parameter | Plot |
|---|---|
| CZT HV Monitor |  |
| D_VDD | 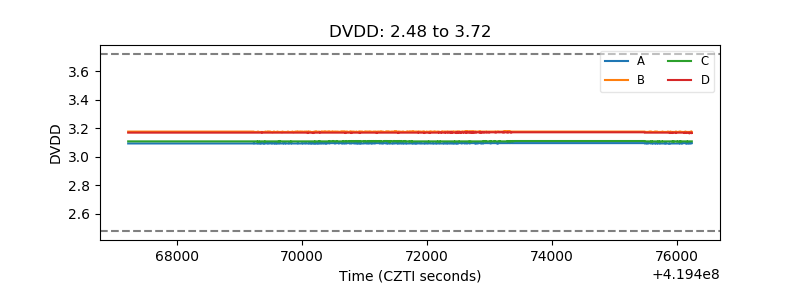 |
| Temperature 1 | 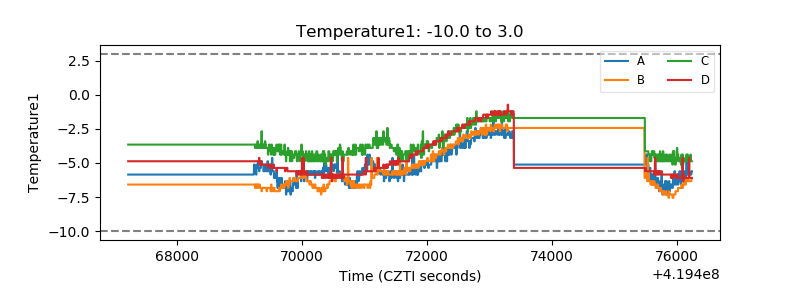 |
| Veto HV Monitor | 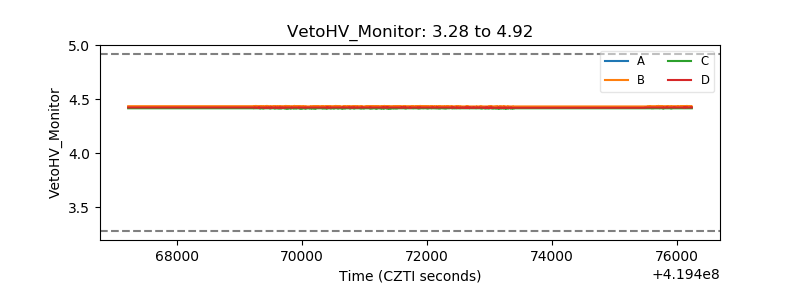 |
| Veto LLD | 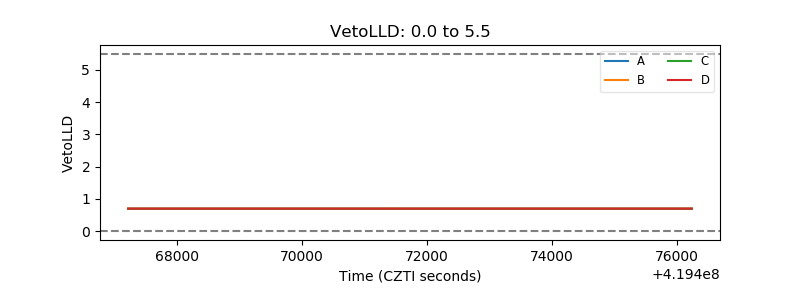 |
| Alpha Counter | 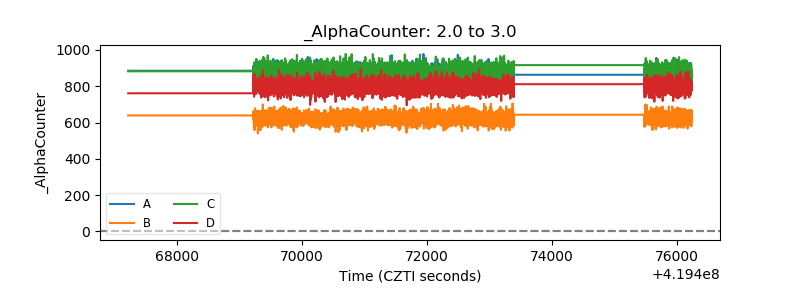 |
| _CPM_Rate |  |
| CZT Counter | 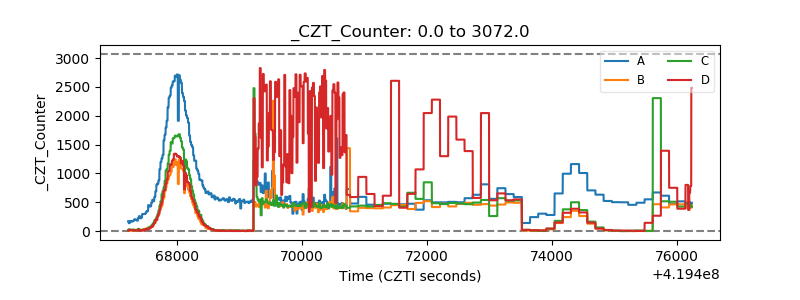 |
| +2.5 Volts monitor | 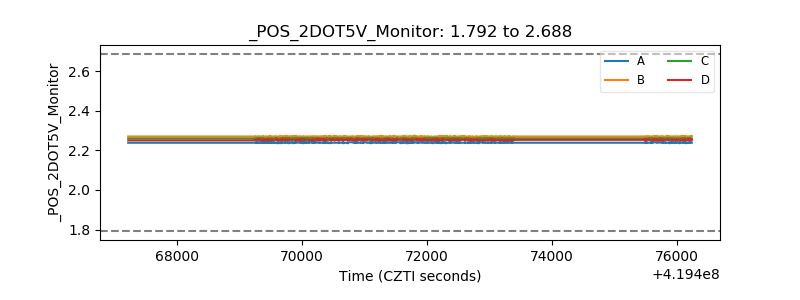 |
| +5 Volts monitor |  |
| _ROLL_ROT | 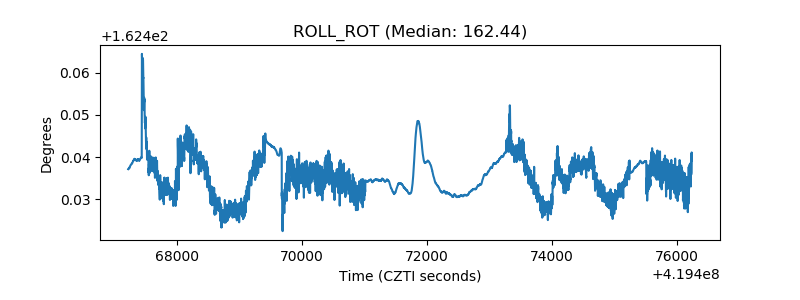 |
| _Roll_DEC | 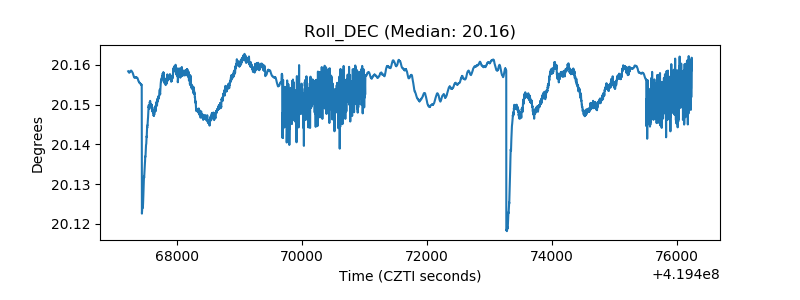 |
| _Roll_RA | 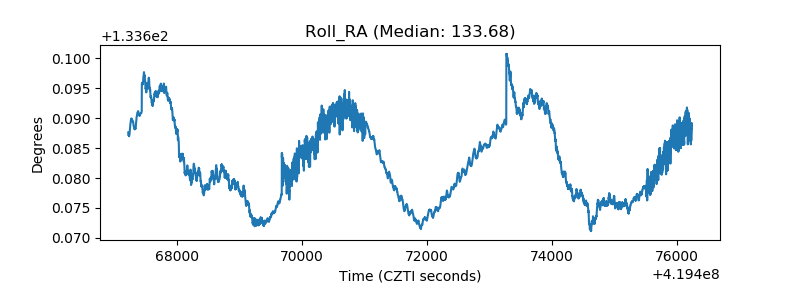 |
| Veto Counter | 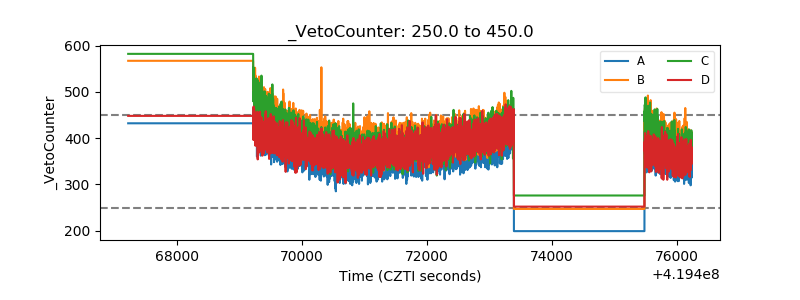 |