| Param | Original file | Final file |
|---|---|---|
| Filename | modeM0/AS1A12_104T02_9000005572_40840cztM0_level2.fits | modeM0/AS1A12_104T02_9000005572_40840cztM0_level2_quad_clean.evt |
| Size (bytes) | 386,280,000 | 89,066,880 |
| Size | 368.4 MB | 84.9 MB |
| Events in quadrant A | 3,199,696 | 601,498 |
| Events in quadrant B | 2,494,105 | 621,989 |
| Events in quadrant C | 3,084,445 | 579,372 |
| Events in quadrant D | 5,095,669 | 511,954 |
| Mode M9 | |||
|---|---|---|---|
| Quadrant | BADHDUFLAG | Total packets | Discarded packets |
| A | 0 | 40 | 0 |
| B | 0 | 40 | 0 |
| C | 0 | 40 | 0 |
| D | 0 | 40 | 0 |
| Mode M0 | |||
|---|---|---|---|
| Quadrant | BADHDUFLAG | Total packets | Discarded packets |
| A | 0 | 12786 | 3 |
| B | 0 | 11247 | 2 |
| C | 0 | 12594 | 2 |
| D | 0 | 18993 | 2 |
| Mode SS | |||
|---|---|---|---|
| Quadrant | BADHDUFLAG | Total packets | Discarded packets |
| A | 0 | 112 | 0 |
| B | 0 | 112 | 0 |
| C | 0 | 112 | 0 |
| D | 0 | 112 | 0 |
| Quadrant | Total seconds | Saturated seconds | Saturation percentage |
|---|---|---|---|
| A | 5463 | 45 | 0.823723% |
| B | 5463 | 9 | 0.164745% |
| C | 5463 | 131 | 2.397950% |
| D | 5463 | 443 | 8.109098% |
Noise dominated data is calculated using 1-second bins in cleaned event files. If a bin has >2000 counts, and if more than 50% of those come from <1% of pixels, then it is considered to be noise-dominated and hence unusable.
| Quadrant | # 1 sec bins | Bins with >0 counts | Bins with >2000 counts | High rate bins dominated by noise | Noise dominated (total time) | Noise dominated (detector-on time) | Marked lightcurve |
|---|---|---|---|---|---|---|---|
| A | 9438 | 5465 | 28 | 28 | 0.30% | 0.51% | 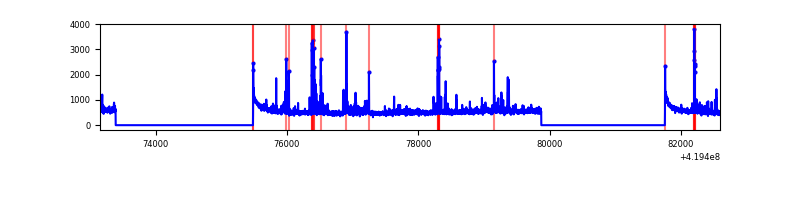 |
| B | 9438 | 5465 | 3 | 3 | 0.03% | 0.05% | 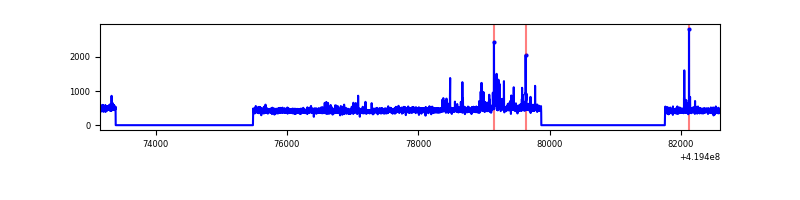 |
| C | 9438 | 5465 | 119 | 119 | 1.26% | 2.18% | 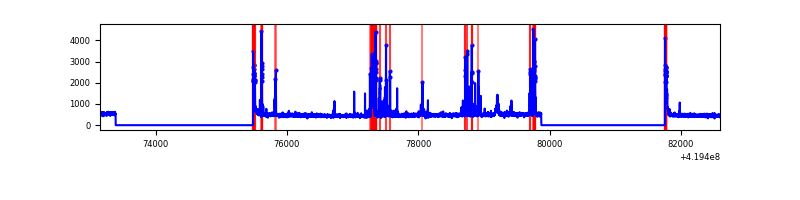 |
| D | 9438 | 5465 | 446 | 446 | 4.73% | 8.16% | 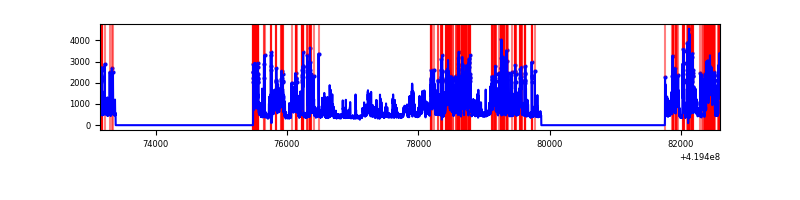 |
Top three noisy pixels from each quadrant. If the there are fewer than three noisy pixels in the level2.evt file, extra rows are filled as -1
| Pixel properties | Quadrant properties | ||||||
|---|---|---|---|---|---|---|---|
| Quadrant | DetID | PixID | Counts | Sigma | Mean | Median | Sigma |
| A | 10 | 83 | 510023 | 4087.48 | 606 | 593 | 124.6 |
| A | 13 | 248 | 229319 | 1835.21 | 606 | 593 | 124.6 |
| A | 12 | 189 | 67089 | 533.54 | 606 | 593 | 124.6 |
| B | 5 | 255 | 67518 | 568.51 | 603 | 585 | 117.7 |
| B | 4 | 171 | 51714 | 434.28 | 603 | 585 | 117.7 |
| B | 12 | 111 | 15213 | 124.24 | 603 | 585 | 117.7 |
| C | 14 | 254 | 422873 | 3080.53 | 583 | 587 | 137.1 |
| C | 15 | 214 | 233240 | 1697.18 | 583 | 587 | 137.1 |
| C | 0 | 10 | 138801 | 1008.26 | 583 | 587 | 137.1 |
| D | 12 | 79 | 1473303 | 10324.63 | 572 | 554 | 142.6 |
| D | 13 | 249 | 981882 | 6879.55 | 572 | 554 | 142.6 |
| D | 5 | 222 | 136270 | 951.43 | 572 | 554 | 142.6 |
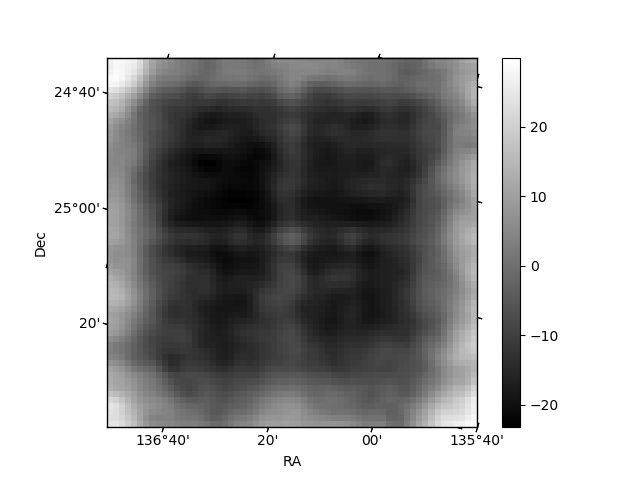
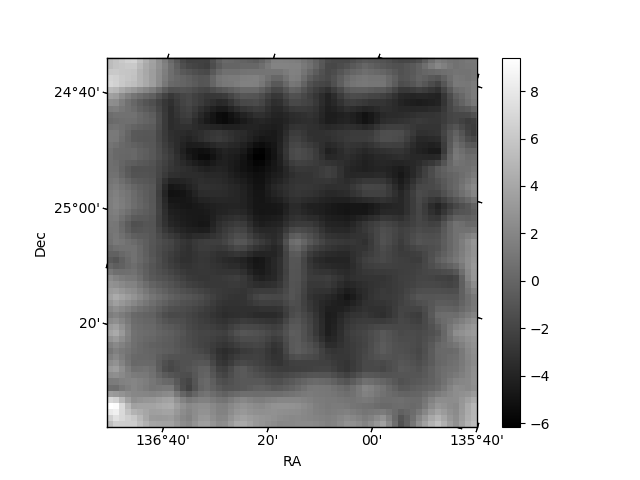
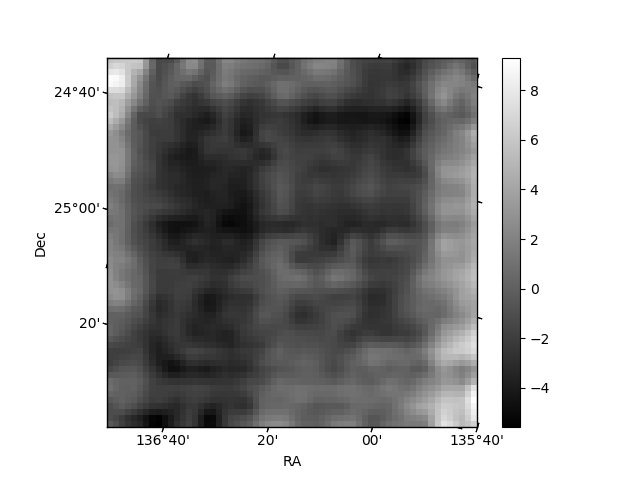
Histogram calculated using DETX and DETY for each event in the final _common_clean file
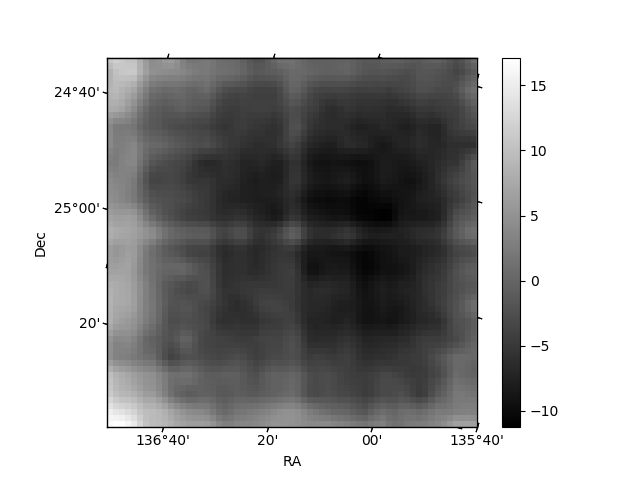
| Quadrant A | 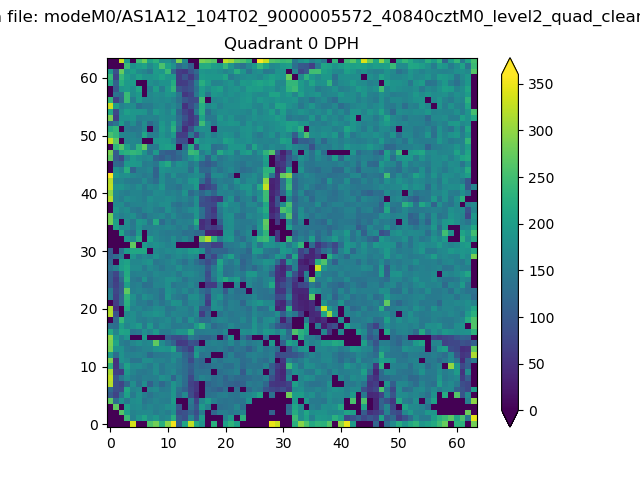 |
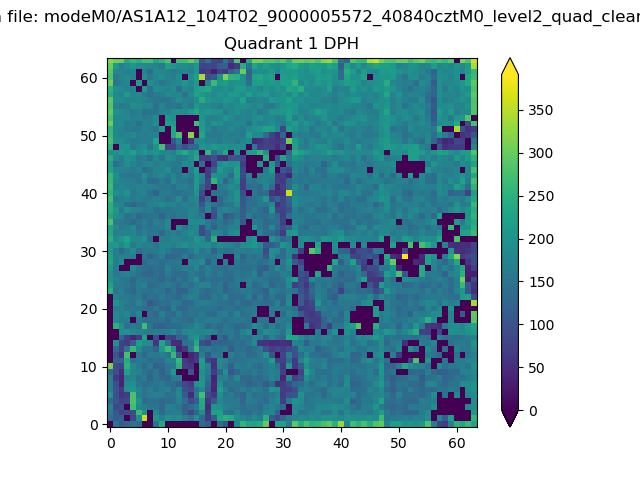 |
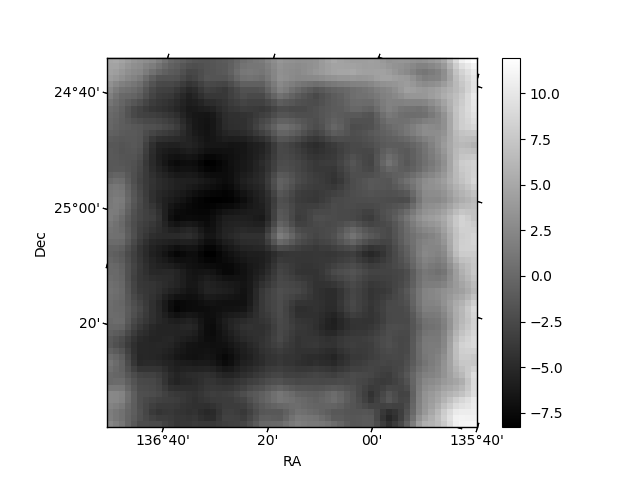
Quadrant B |
|---|---|---|---|
| Quadrant D | 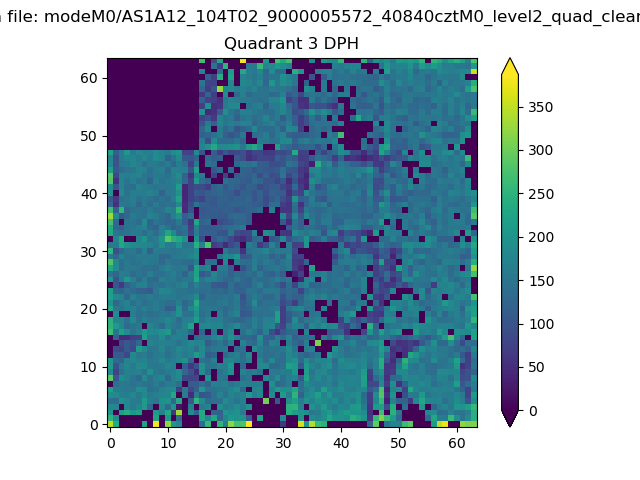 |
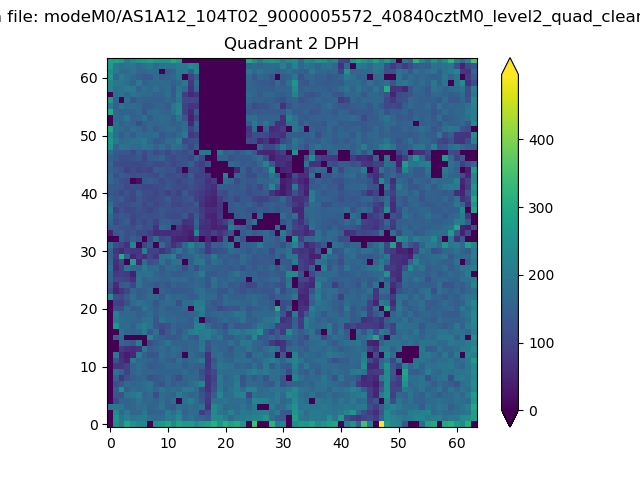 |
Quadrant C |
| Plot type | Count rate plots | Images |
|---|---|---|
| Comparison with Poisson distribution Blue bars denote a histogram of data divided into 1 sec bins. Red curve is a Poisson curve with rate = median count rate of data. |
 |
 |
| Quadrant-wise count rates Data is divided into 100 sec bins |
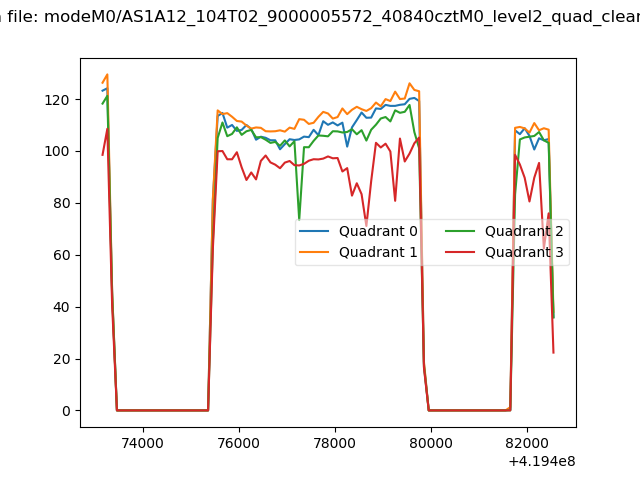 |
|
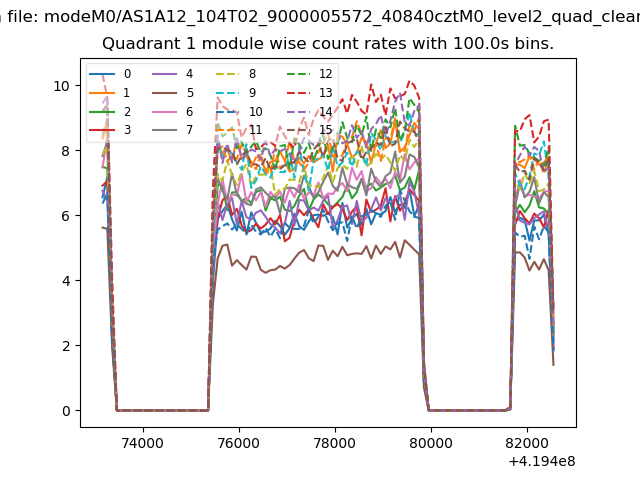
| Module-wise count rates for Quadrant A Data is divided into 100 sec bins |
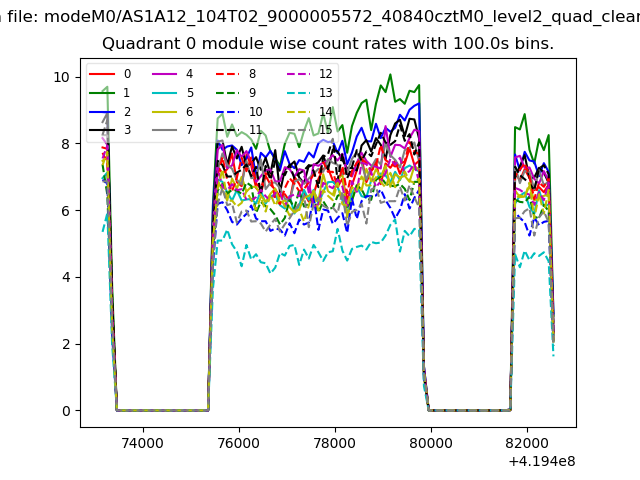 |
 |
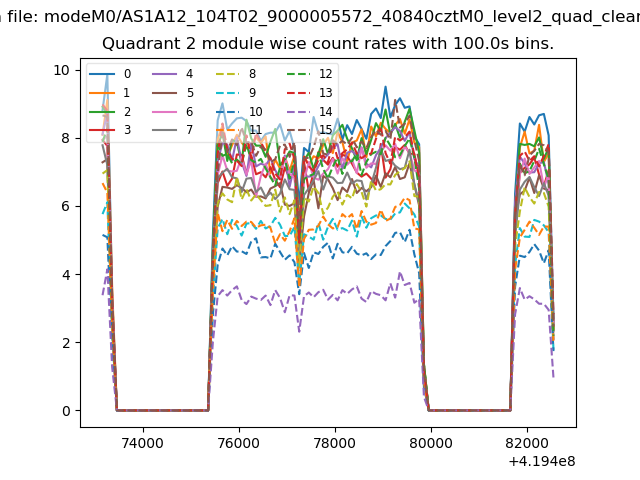
| Module-wise count rates for Quadrant B Data is divided into 100 sec bins |
 |
 |
| Module-wise count rates for Quadrant C Data is divided into 100 sec bins |
 |
 |
| Module-wise count rates for Quadrant D Data is divided into 100 sec bins |
 |
 |
| Parameter | Plot |
|---|---|
| CZT HV Monitor |  |
| D_VDD | 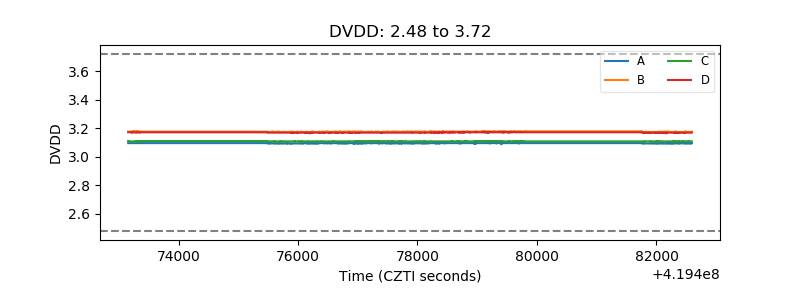 |
| Temperature 1 | 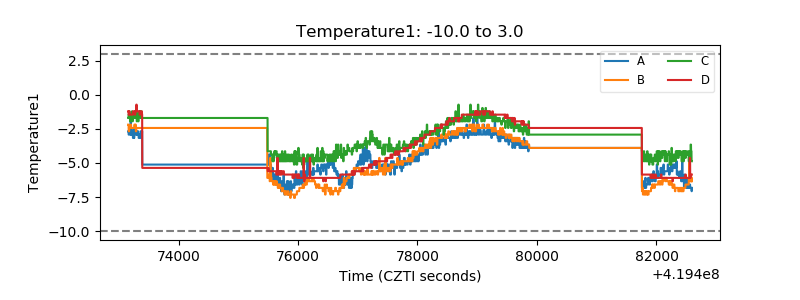 |
| Veto HV Monitor | 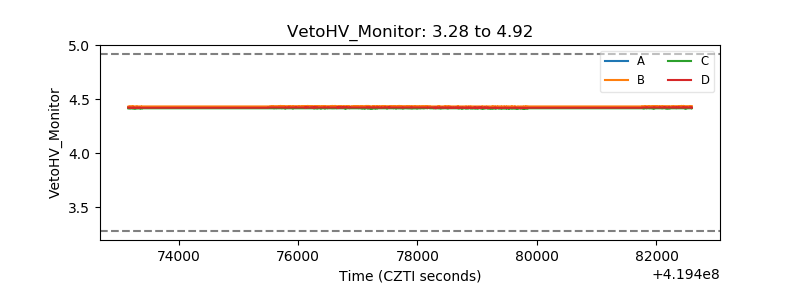 |
| Veto LLD | 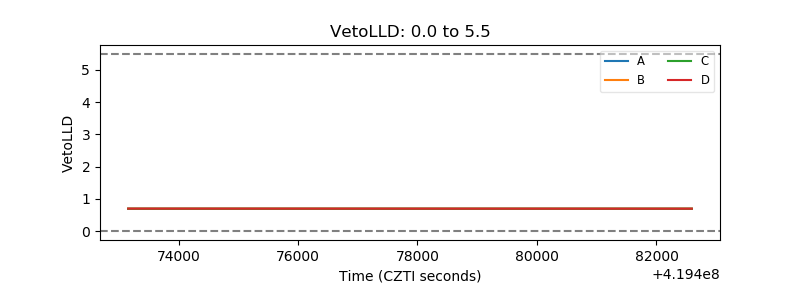 |
| Alpha Counter |  |
| _CPM_Rate |  |
| CZT Counter | 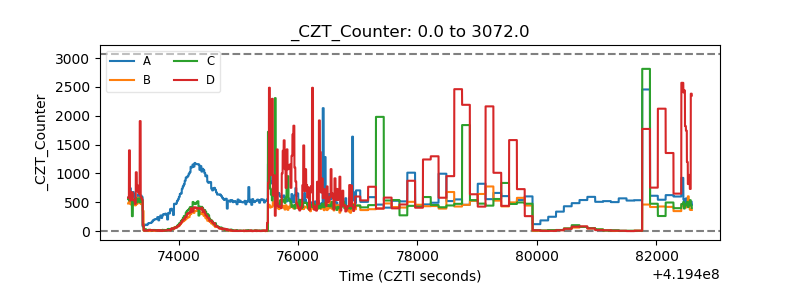 |
| +2.5 Volts monitor |  |
| +5 Volts monitor | 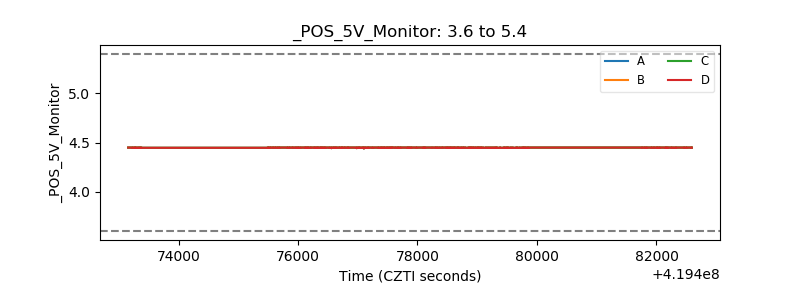 |
| _ROLL_ROT | 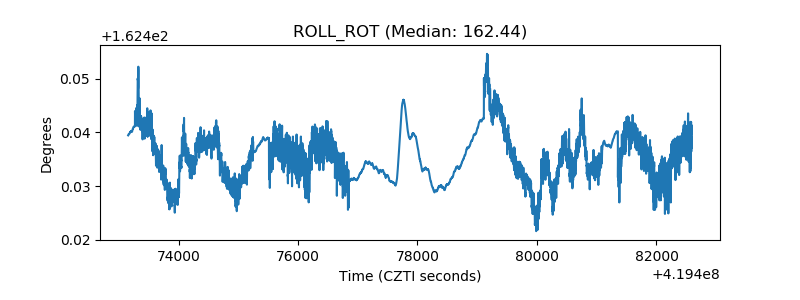 |
| _Roll_DEC | 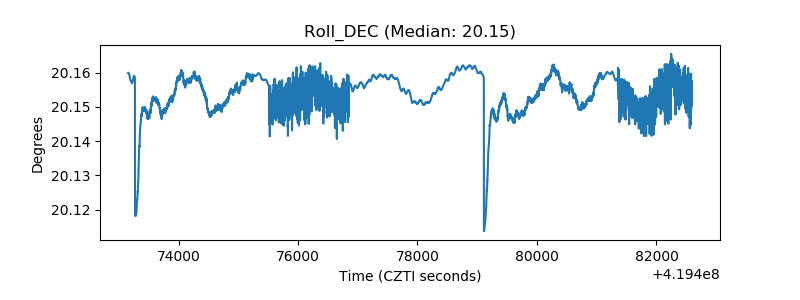 |
| _Roll_RA | 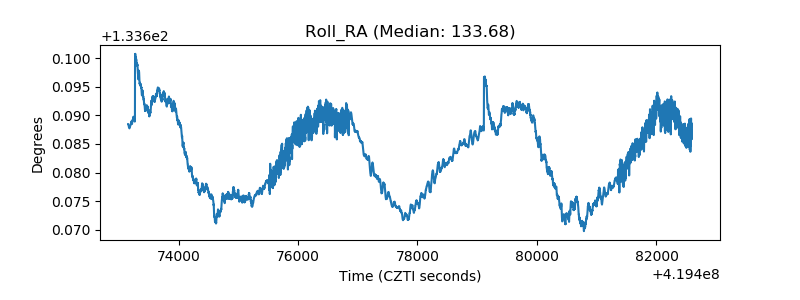 |
| Veto Counter | 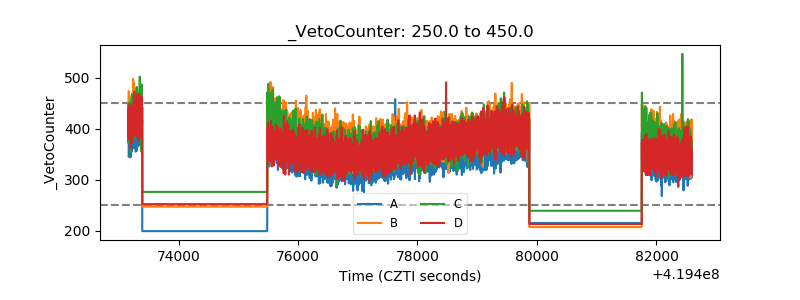 |