| Param | Original file | Final file |
|---|---|---|
| Filename | modeM0/AS1A12_104T02_9000005572_40841cztM0_level2.fits | modeM0/AS1A12_104T02_9000005572_40841cztM0_level2_quad_clean.evt |
| Size (bytes) | 434,108,160 | 89,153,280 |
| Size | 414.0 MB | 85.0 MB |
| Events in quadrant A | 3,331,269 | 609,575 |
| Events in quadrant B | 2,551,672 | 636,087 |
| Events in quadrant C | 3,031,463 | 598,841 |
| Events in quadrant D | 6,713,719 | 458,077 |
| Mode M9 | |||
|---|---|---|---|
| Quadrant | BADHDUFLAG | Total packets | Discarded packets |
| A | 0 | 34 | 0 |
| B | 0 | 34 | 0 |
| C | 0 | 34 | 0 |
| D | 0 | 34 | 0 |
| Mode M0 | |||
|---|---|---|---|
| Quadrant | BADHDUFLAG | Total packets | Discarded packets |
| A | 0 | 13239 | 3 |
| B | 0 | 11585 | 2 |
| C | 0 | 12555 | 2 |
| D | 0 | 23873 | 2 |
| Mode SS | |||
|---|---|---|---|
| Quadrant | BADHDUFLAG | Total packets | Discarded packets |
| A | 0 | 118 | 0 |
| B | 0 | 118 | 0 |
| C | 0 | 118 | 0 |
| D | 0 | 118 | 0 |
| Quadrant | Total seconds | Saturated seconds | Saturation percentage |
|---|---|---|---|
| A | 5674 | 107 | 1.885795% |
| B | 5674 | 14 | 0.246740% |
| C | 5674 | 84 | 1.480437% |
| D | 5674 | 1201 | 21.166725% |
Noise dominated data is calculated using 1-second bins in cleaned event files. If a bin has >2000 counts, and if more than 50% of those come from <1% of pixels, then it is considered to be noise-dominated and hence unusable.
| Quadrant | # 1 sec bins | Bins with >0 counts | Bins with >2000 counts | High rate bins dominated by noise | Noise dominated (total time) | Noise dominated (detector-on time) | Marked lightcurve |
|---|---|---|---|---|---|---|---|
| A | 9078 | 5676 | 71 | 71 | 0.78% | 1.25% | 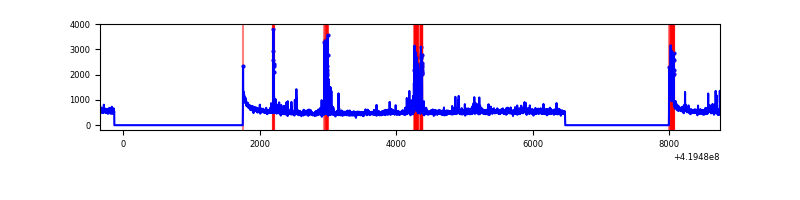 |
| B | 9078 | 5676 | 4 | 4 | 0.04% | 0.07% | 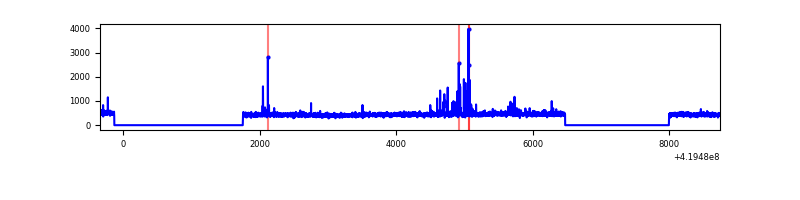 |
| C | 9078 | 5676 | 72 | 72 | 0.79% | 1.27% | 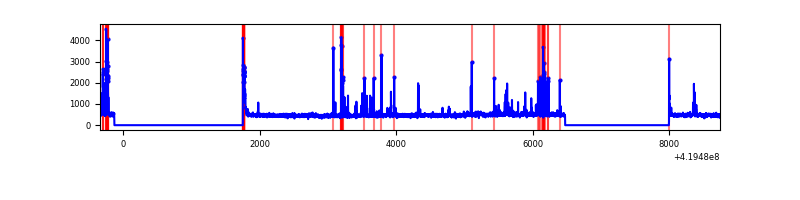 |
| D | 9078 | 5675 | 1133 | 1133 | 12.48% | 19.96% | 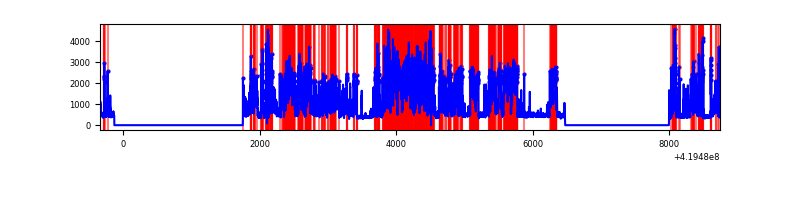 |
Top three noisy pixels from each quadrant. If the there are fewer than three noisy pixels in the level2.evt file, extra rows are filled as -1
| Pixel properties | Quadrant properties | ||||||
|---|---|---|---|---|---|---|---|
| Quadrant | DetID | PixID | Counts | Sigma | Mean | Median | Sigma |
| A | 10 | 83 | 516053 | 4028.19 | 623 | 609 | 128.0 |
| A | 13 | 248 | 277538 | 2164.2 | 623 | 609 | 128.0 |
| A | 2 | 79 | 62121 | 480.72 | 623 | 609 | 128.0 |
| B | 4 | 171 | 61385 | 503.6 | 621 | 603 | 120.7 |
| B | 5 | 255 | 37534 | 305.98 | 621 | 603 | 120.7 |
| B | 12 | 111 | 15449 | 123.0 | 621 | 603 | 120.7 |
| C | 14 | 254 | 324043 | 2293.37 | 605 | 608 | 141.0 |
| C | 15 | 214 | 242332 | 1713.99 | 605 | 608 | 141.0 |
| C | 0 | 10 | 87682 | 617.41 | 605 | 608 | 141.0 |
| D | 13 | 249 | 2135559 | 15638.63 | 556 | 539 | 136.5 |
| D | 12 | 79 | 2112782 | 15471.79 | 556 | 539 | 136.5 |
| D | 5 | 222 | 198889 | 1452.88 | 556 | 539 | 136.5 |
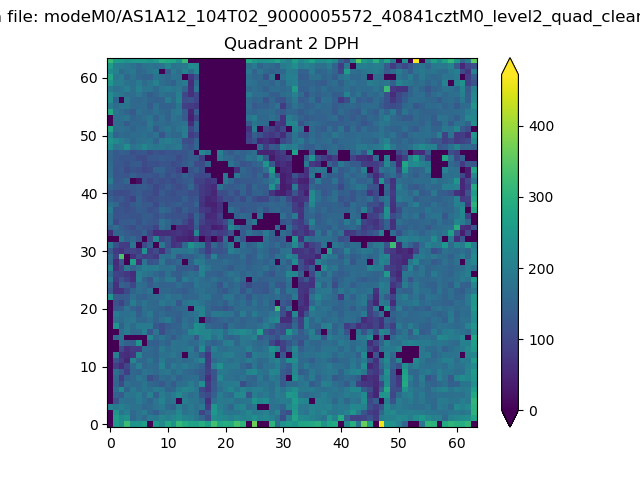
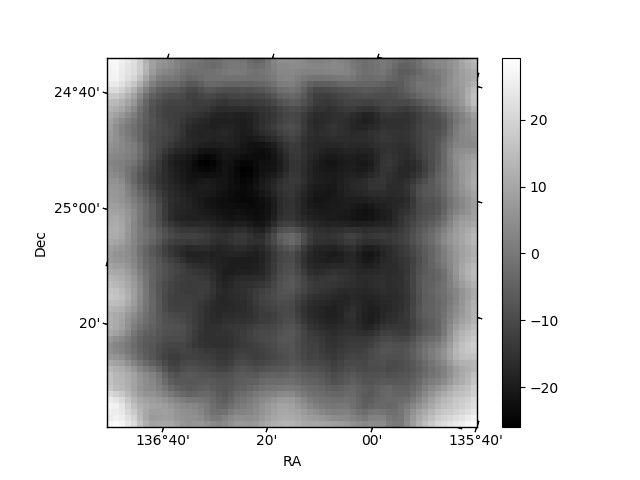
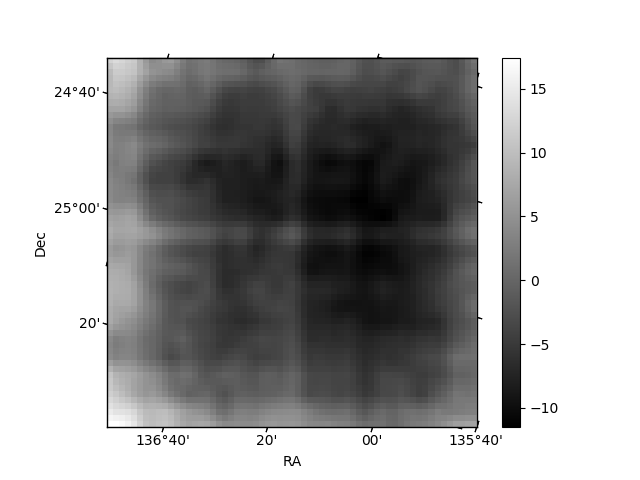
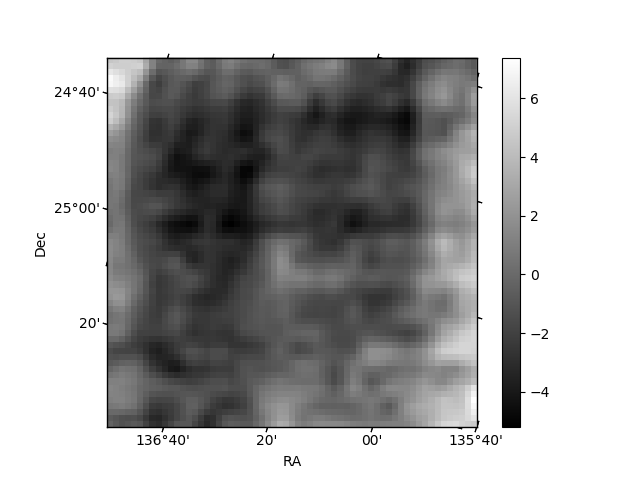
Histogram calculated using DETX and DETY for each event in the final _common_clean file
| Quadrant A | 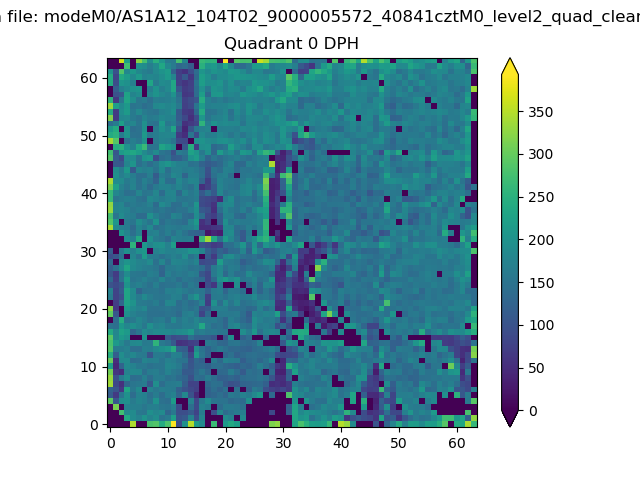 |
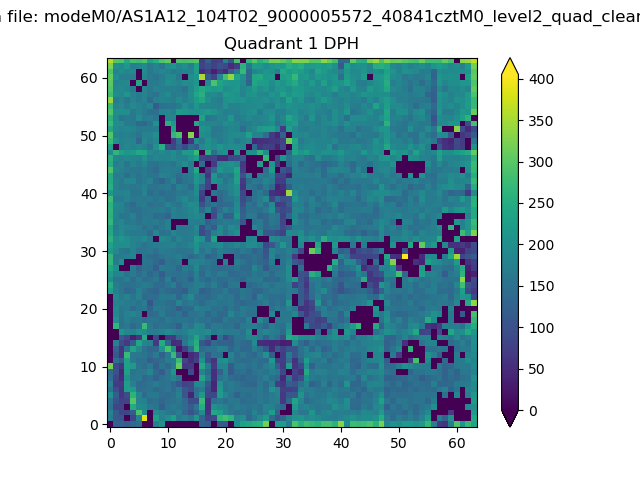 |
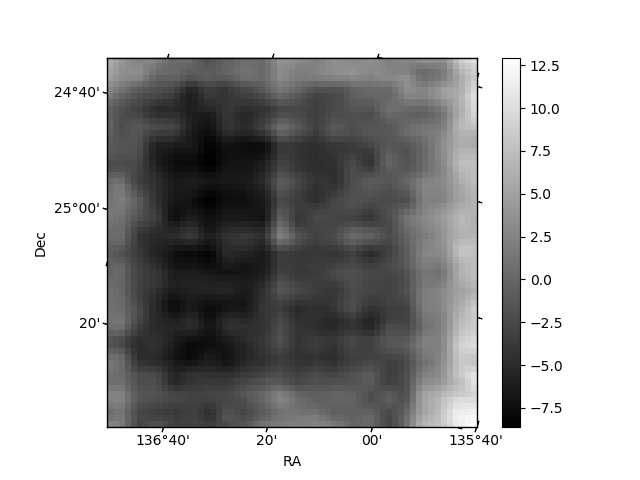
Quadrant B |
|---|---|---|---|
| Quadrant D | 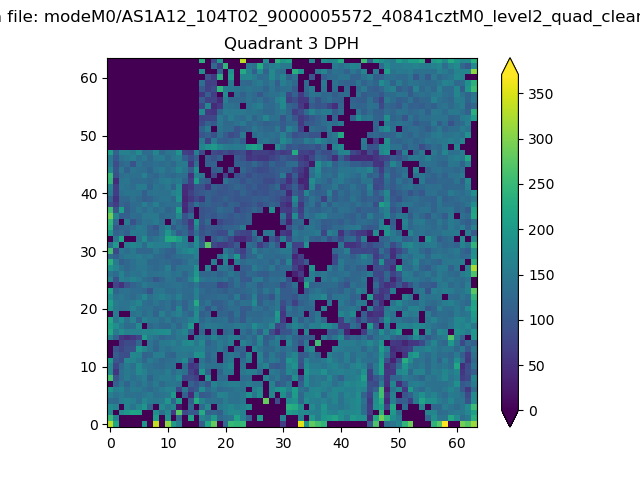 |
 |
Quadrant C |
| Plot type | Count rate plots | Images |
|---|---|---|
| Comparison with Poisson distribution Blue bars denote a histogram of data divided into 1 sec bins. Red curve is a Poisson curve with rate = median count rate of data. |
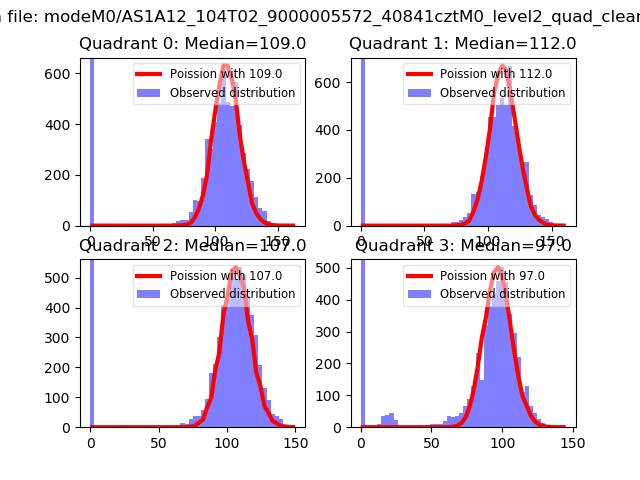 |
 |
| Quadrant-wise count rates Data is divided into 100 sec bins |
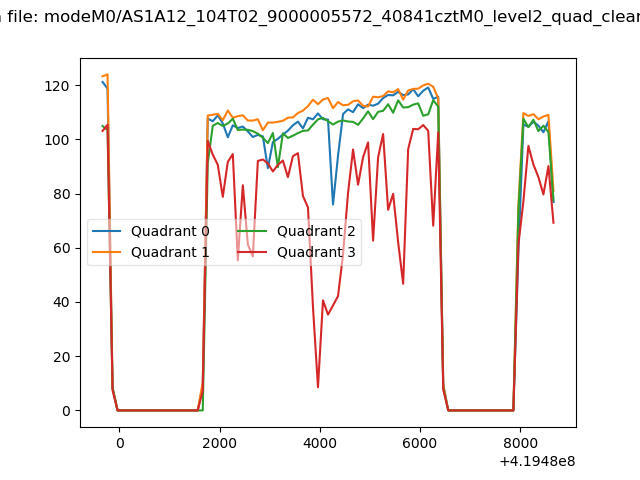 |
|
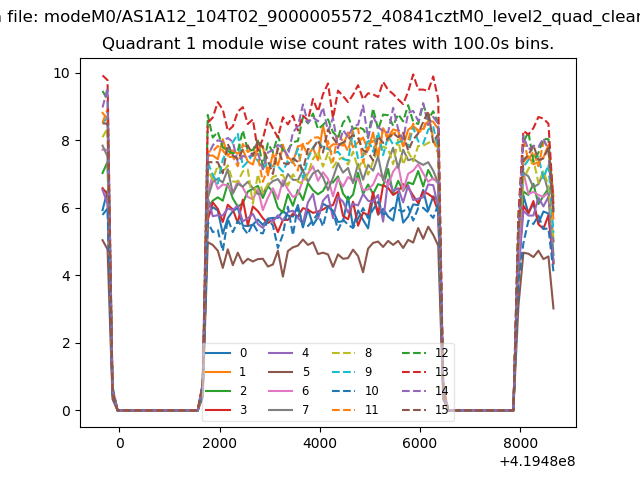
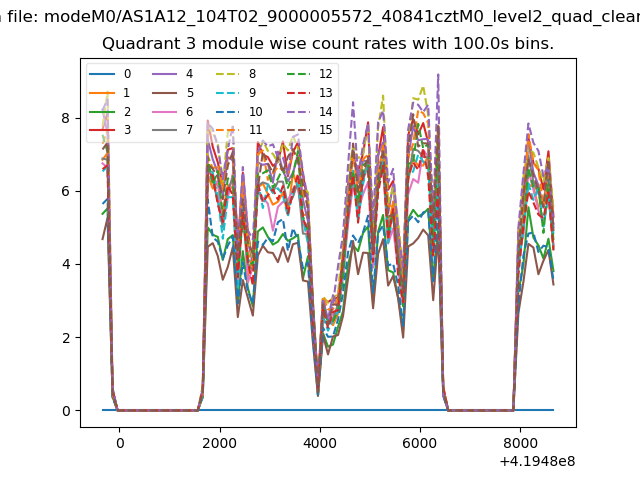
| Module-wise count rates for Quadrant A Data is divided into 100 sec bins |
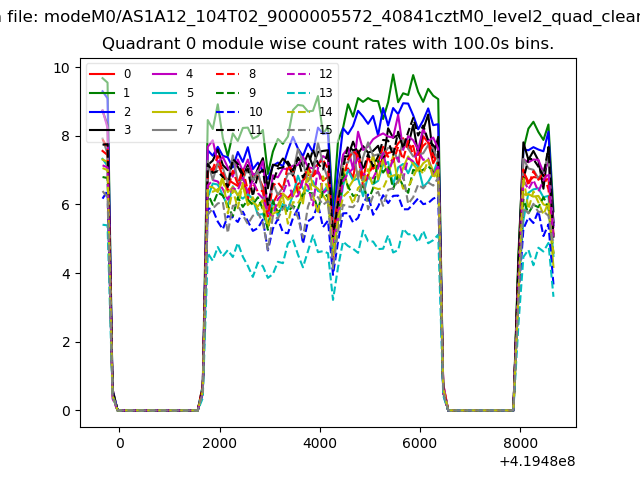 |
 |
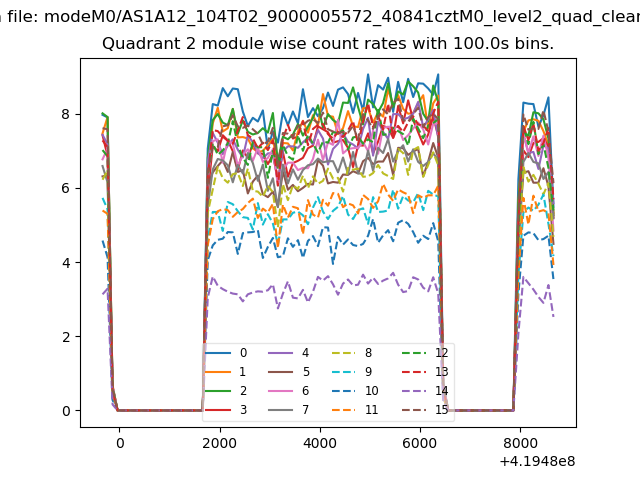
| Module-wise count rates for Quadrant B Data is divided into 100 sec bins |
 |
 |
| Module-wise count rates for Quadrant C Data is divided into 100 sec bins |
 |
 |
| Module-wise count rates for Quadrant D Data is divided into 100 sec bins |
 |
 |
| Parameter | Plot |
|---|---|
| CZT HV Monitor | 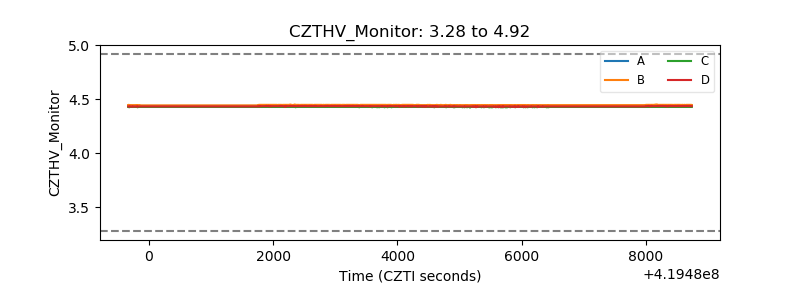 |
| D_VDD | 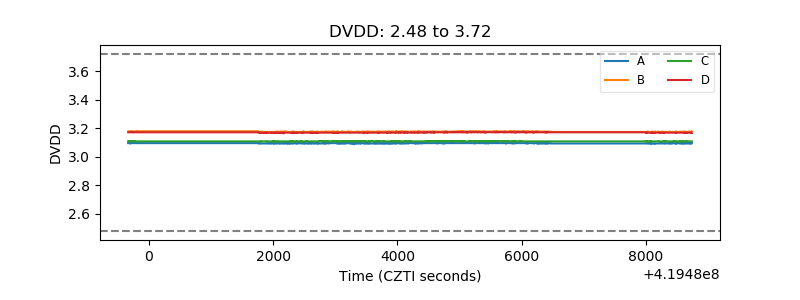 |
| Temperature 1 | 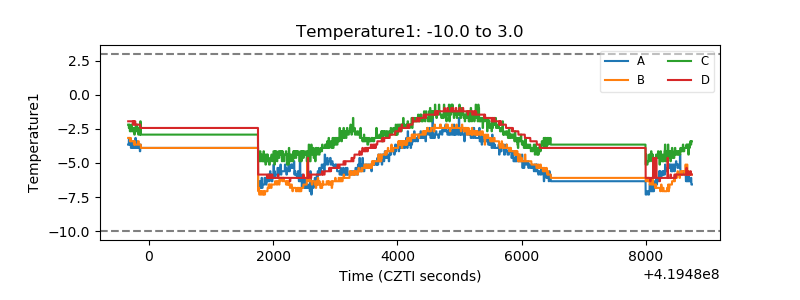 |
| Veto HV Monitor | 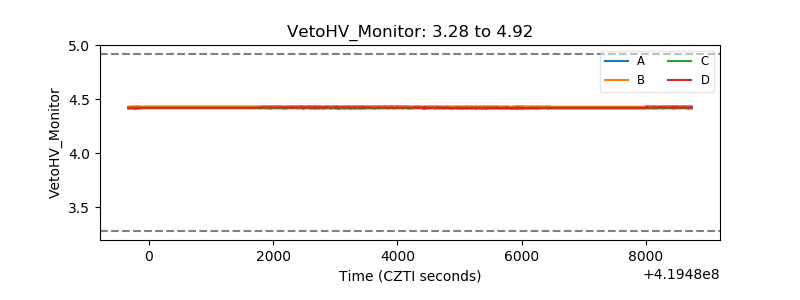 |
| Veto LLD | 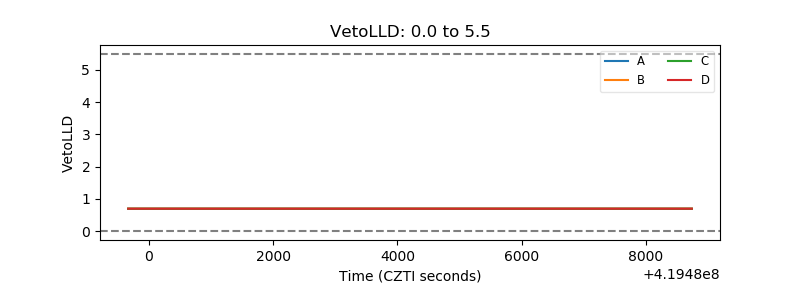 |
| Alpha Counter | 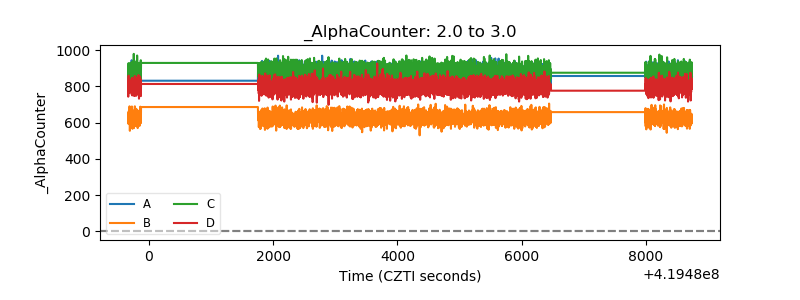 |
| _CPM_Rate | 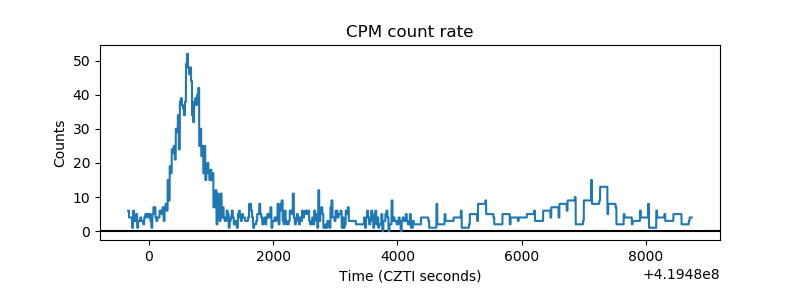 |
| CZT Counter | 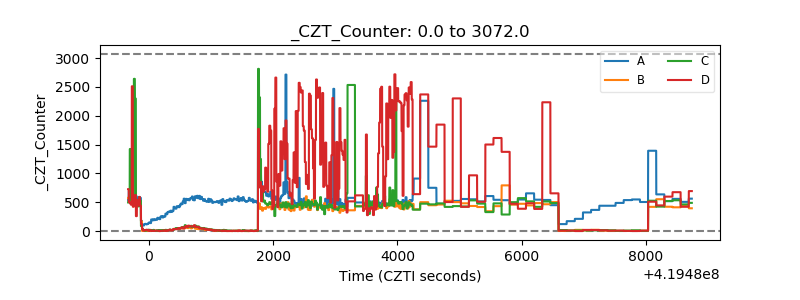 |
| +2.5 Volts monitor |  |
| +5 Volts monitor |  |
| _ROLL_ROT | 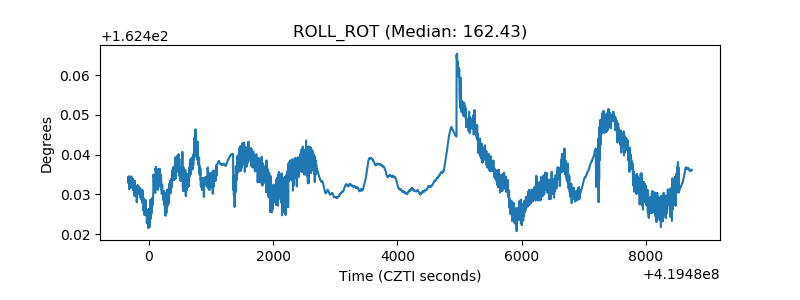 |
| _Roll_DEC | 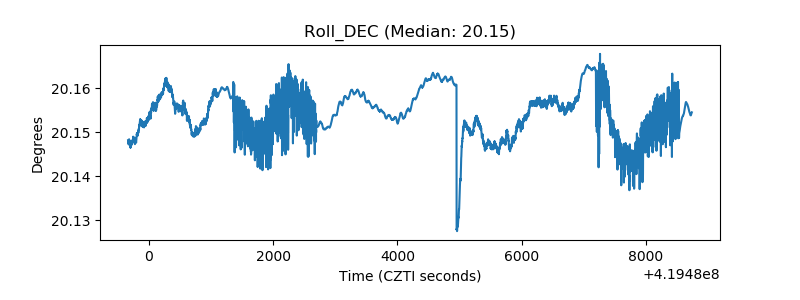 |
| _Roll_RA | 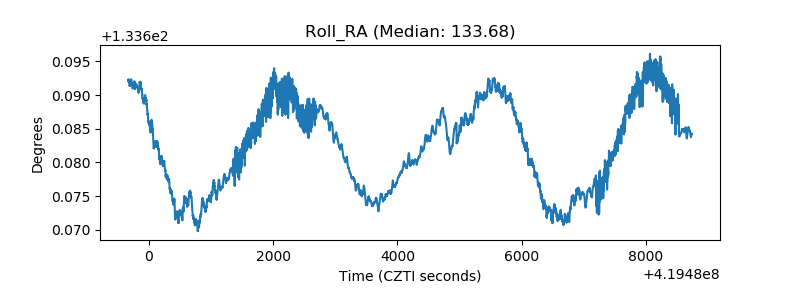 |
| Veto Counter | 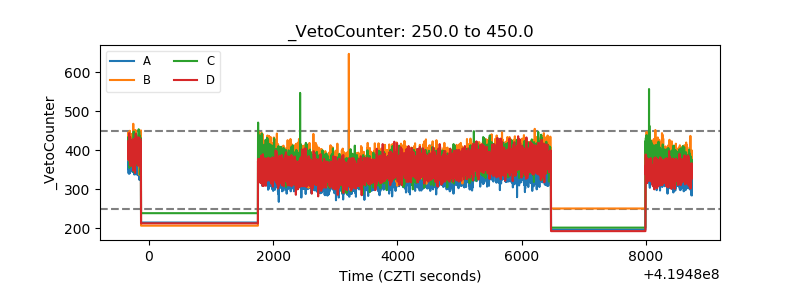 |