| Param | Original file | Final file |
|---|---|---|
| Filename | modeM0/AS1A12_104T02_9000005572_40842cztM0_level2.fits | modeM0/AS1A12_104T02_9000005572_40842cztM0_level2_quad_clean.evt |
| Size (bytes) | 443,090,880 | 98,942,400 |
| Size | 422.6 MB | 94.4 MB |
| Events in quadrant A | 3,446,326 | 673,074 |
| Events in quadrant B | 2,839,254 | 696,094 |
| Events in quadrant C | 3,161,800 | 657,870 |
| Events in quadrant D | 6,466,914 | 530,689 |
| Mode M9 | |||
|---|---|---|---|
| Quadrant | BADHDUFLAG | Total packets | Discarded packets |
| A | 0 | 28 | 0 |
| B | 0 | 28 | 0 |
| C | 0 | 28 | 0 |
| D | 0 | 28 | 0 |
| Mode M0 | |||
|---|---|---|---|
| Quadrant | BADHDUFLAG | Total packets | Discarded packets |
| A | 0 | 13854 | 3 |
| B | 0 | 12793 | 2 |
| C | 0 | 13315 | 2 |
| D | 0 | 23633 | 2 |
| Mode SS | |||
|---|---|---|---|
| Quadrant | BADHDUFLAG | Total packets | Discarded packets |
| A | 0 | 132 | 0 |
| B | 0 | 132 | 0 |
| C | 0 | 132 | 0 |
| D | 0 | 132 | 0 |
| Quadrant | Total seconds | Saturated seconds | Saturation percentage |
|---|---|---|---|
| A | 6269 | 48 | 0.765672% |
| B | 6269 | 18 | 0.287127% |
| C | 6269 | 57 | 0.909236% |
| D | 6269 | 943 | 15.042271% |
Noise dominated data is calculated using 1-second bins in cleaned event files. If a bin has >2000 counts, and if more than 50% of those come from <1% of pixels, then it is considered to be noise-dominated and hence unusable.
| Quadrant | # 1 sec bins | Bins with >0 counts | Bins with >2000 counts | High rate bins dominated by noise | Noise dominated (total time) | Noise dominated (detector-on time) | Marked lightcurve |
|---|---|---|---|---|---|---|---|
| A | 9133 | 6271 | 30 | 30 | 0.33% | 0.48% | 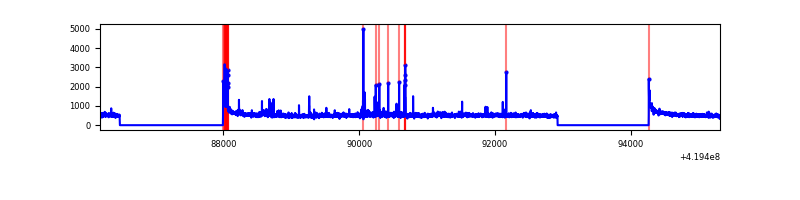 |
| B | 9133 | 6271 | 6 | 6 | 0.07% | 0.10% | 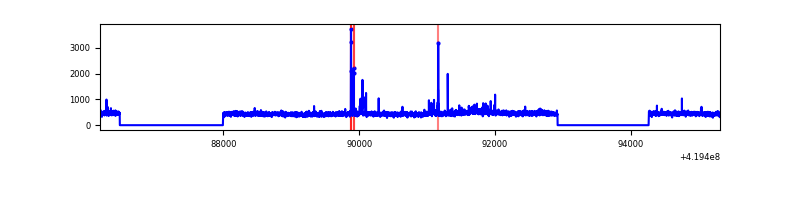 |
| C | 9133 | 6271 | 40 | 40 | 0.44% | 0.64% | 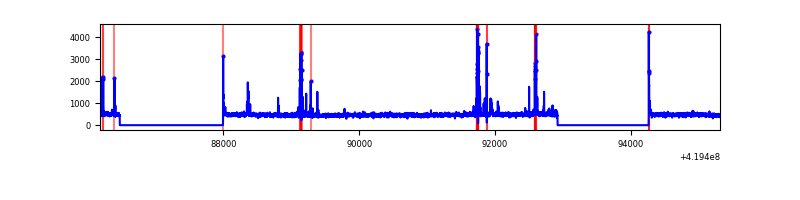 |
| D | 9133 | 6271 | 855 | 855 | 9.36% | 13.63% | 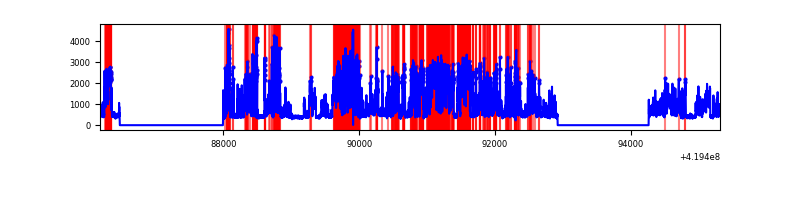 |
Top three noisy pixels from each quadrant. If the there are fewer than three noisy pixels in the level2.evt file, extra rows are filled as -1
| Pixel properties | Quadrant properties | ||||||
|---|---|---|---|---|---|---|---|
| Quadrant | DetID | PixID | Counts | Sigma | Mean | Median | Sigma |
| A | 10 | 83 | 566280 | 3975.63 | 689 | 673 | 142.3 |
| A | 13 | 248 | 124942 | 873.48 | 689 | 673 | 142.3 |
| A | 7 | 3 | 30333 | 208.48 | 689 | 673 | 142.3 |
| B | 0 | 190 | 60706 | 446.1 | 688 | 669 | 134.6 |
| B | 5 | 255 | 44750 | 327.54 | 688 | 669 | 134.6 |
| B | 0 | 230 | 28978 | 210.35 | 688 | 669 | 134.6 |
| C | 15 | 214 | 266751 | 1687.8 | 671 | 675 | 157.6 |
| C | 14 | 254 | 226691 | 1433.69 | 671 | 675 | 157.6 |
| C | 0 | 10 | 35005 | 217.77 | 671 | 675 | 157.6 |
| D | 12 | 79 | 2658719 | 16958.98 | 635 | 616 | 156.7 |
| D | 13 | 249 | 993254 | 6333.14 | 635 | 616 | 156.7 |
| D | 2 | 249 | 247403 | 1574.53 | 635 | 616 | 156.7 |
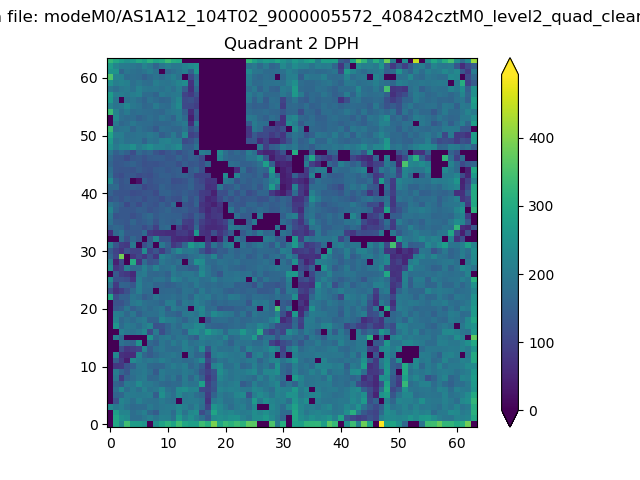
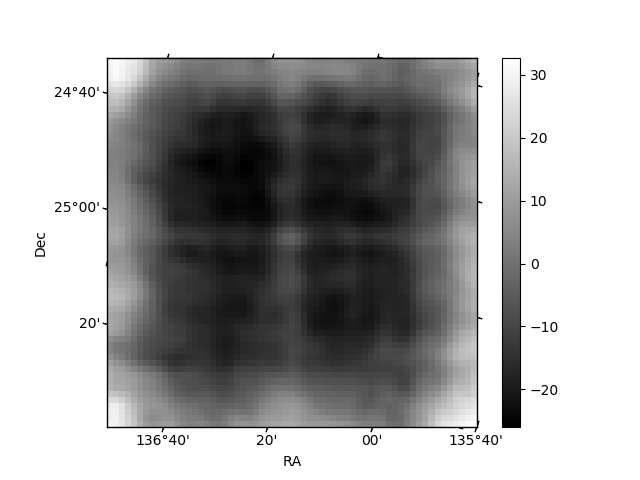
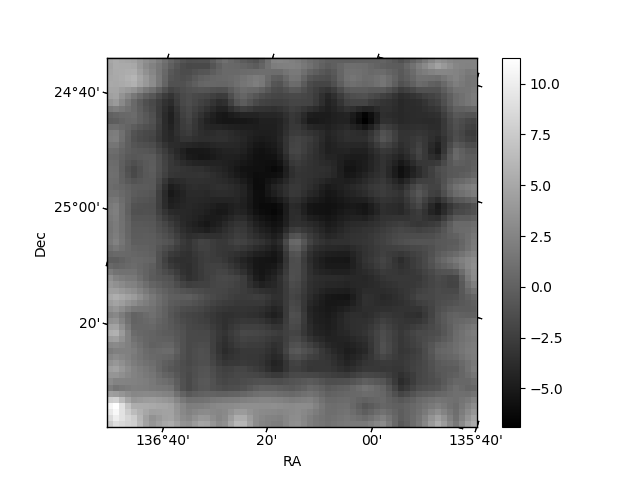
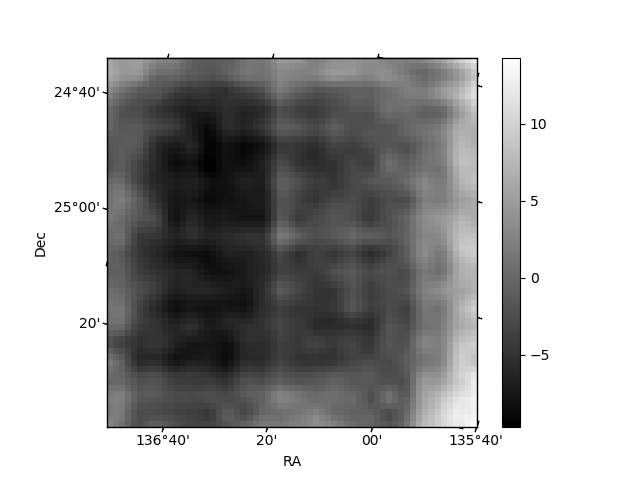
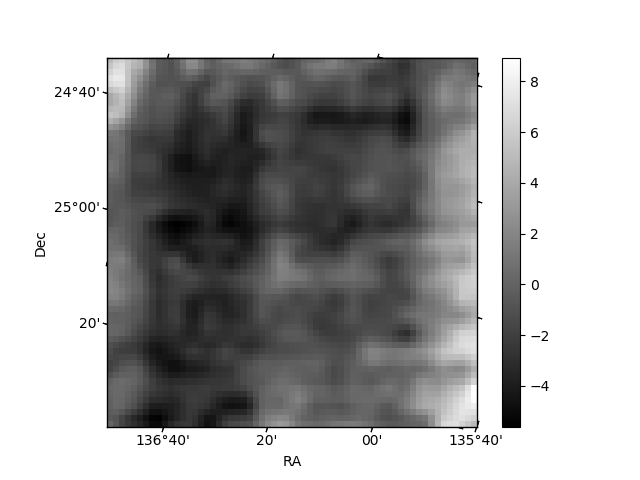
Histogram calculated using DETX and DETY for each event in the final _common_clean file
| Quadrant A | 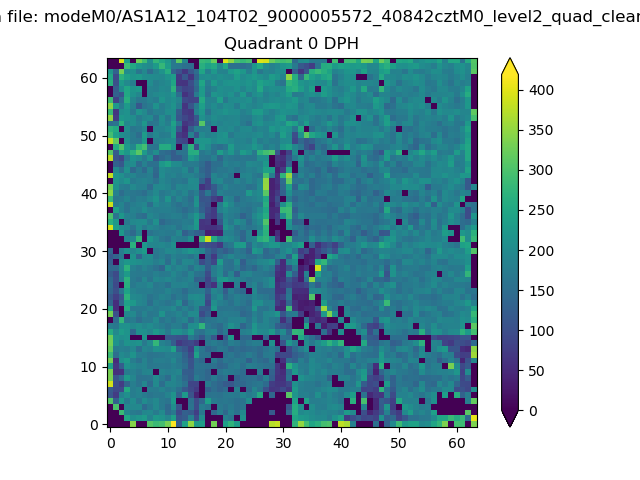 |
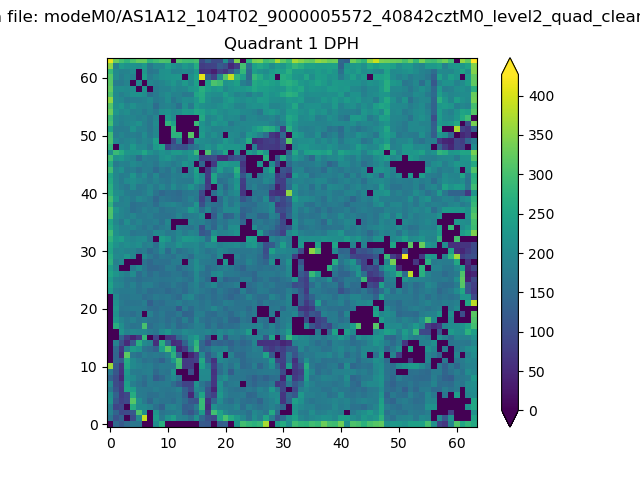 |
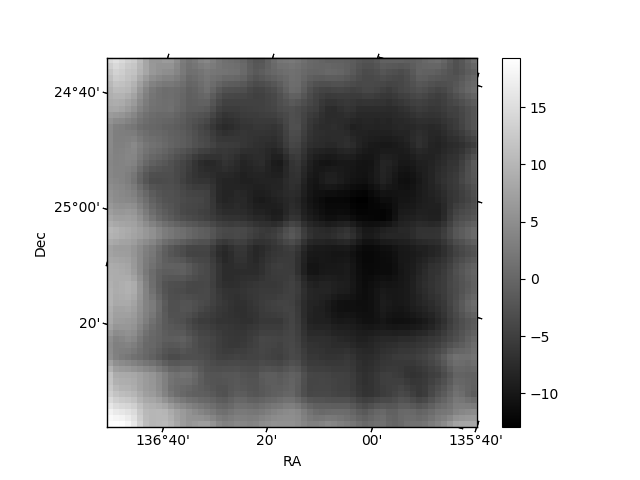
Quadrant B |
|---|---|---|---|
| Quadrant D | 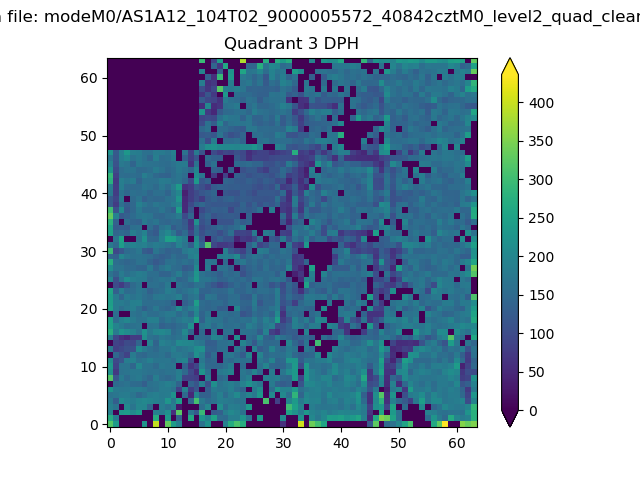 |
 |
Quadrant C |
| Plot type | Count rate plots | Images |
|---|---|---|
| Comparison with Poisson distribution Blue bars denote a histogram of data divided into 1 sec bins. Red curve is a Poisson curve with rate = median count rate of data. |
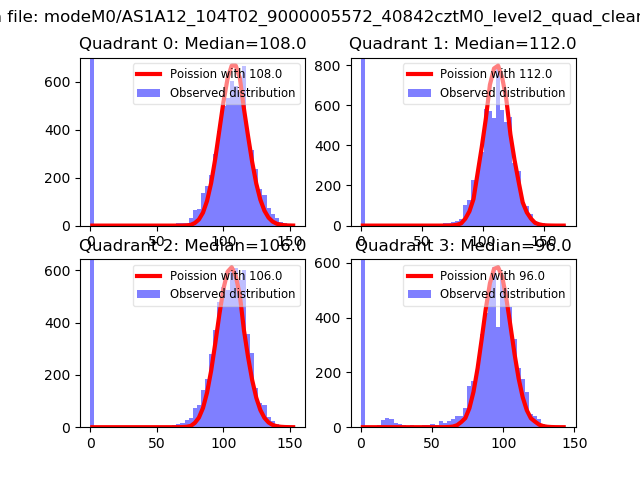 |
 |
| Quadrant-wise count rates Data is divided into 100 sec bins |
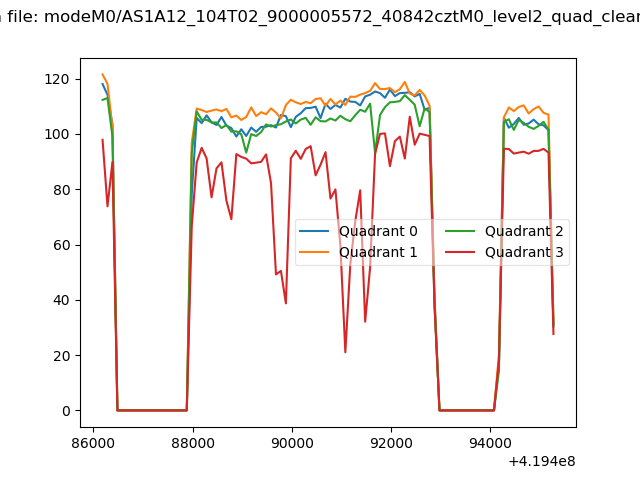 |
|
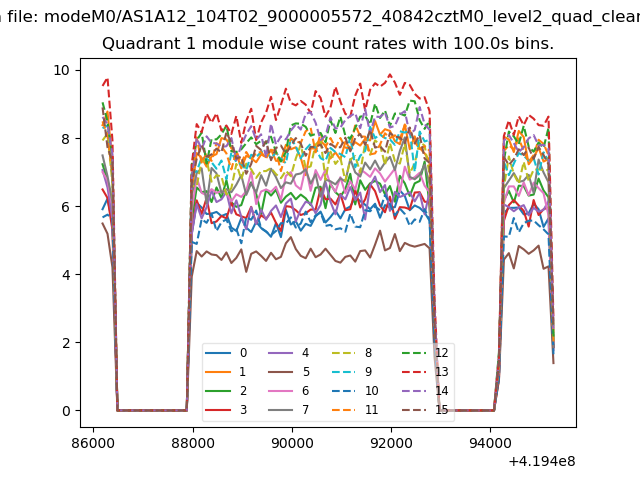
| Module-wise count rates for Quadrant A Data is divided into 100 sec bins |
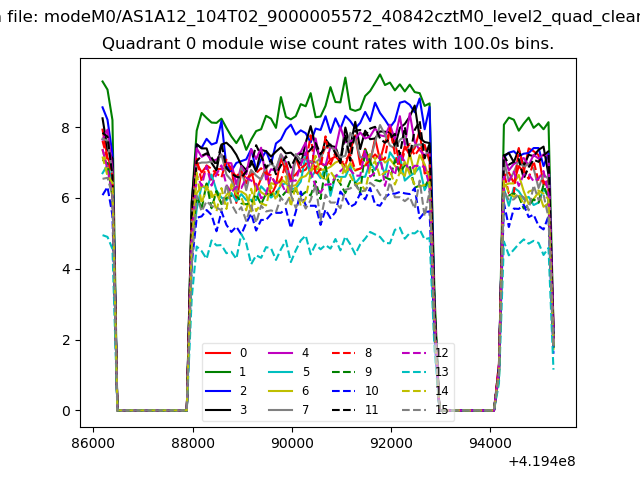 |
 |
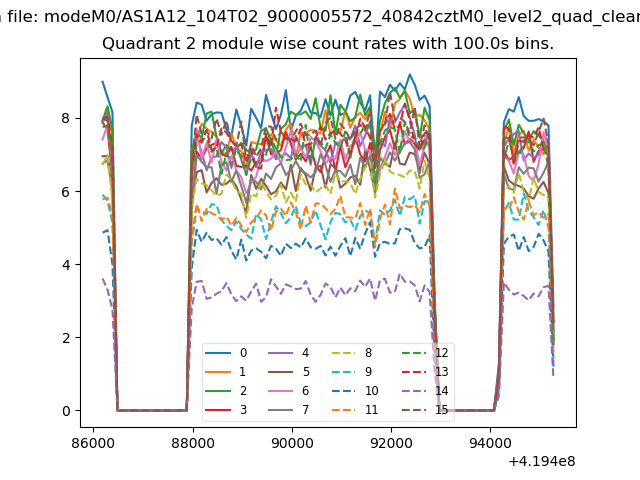
| Module-wise count rates for Quadrant B Data is divided into 100 sec bins |
 |
 |
| Module-wise count rates for Quadrant C Data is divided into 100 sec bins |
 |
 |
| Module-wise count rates for Quadrant D Data is divided into 100 sec bins |
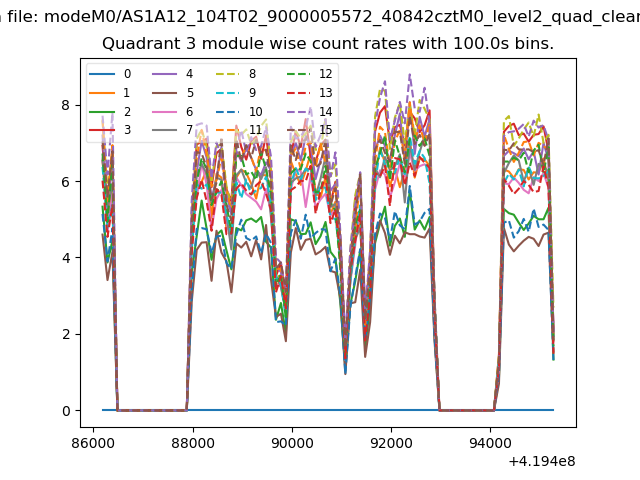 |
 |
| Parameter | Plot |
|---|---|
| CZT HV Monitor | 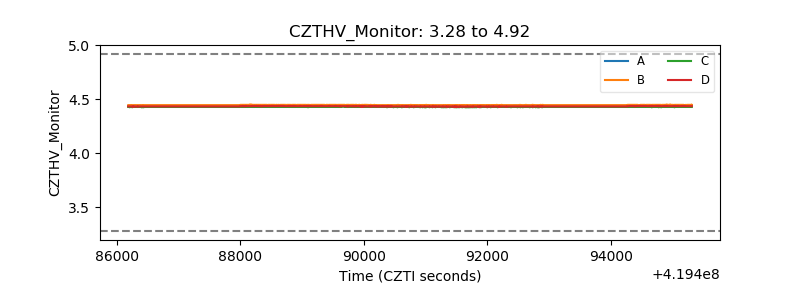 |
| D_VDD | 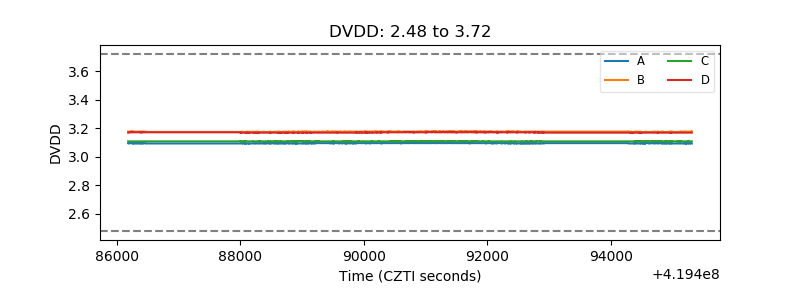 |
| Temperature 1 | 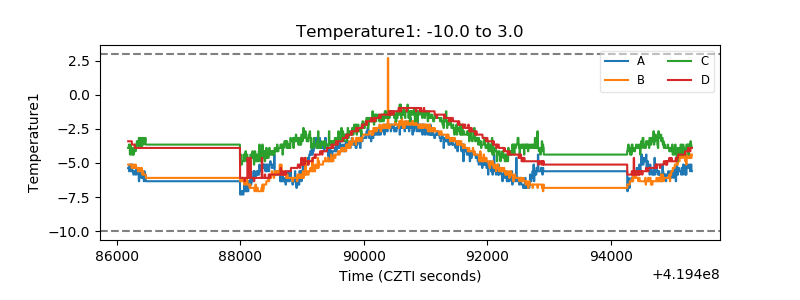 |
| Veto HV Monitor |  |
| Veto LLD | 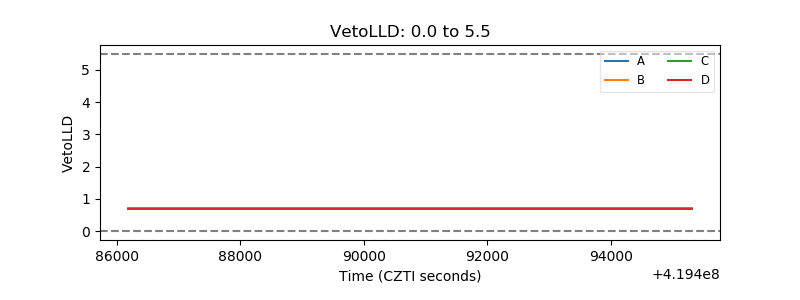 |
| Alpha Counter | 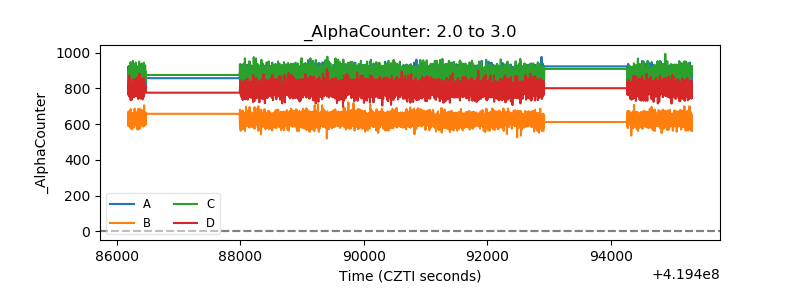 |
| _CPM_Rate |  |
| CZT Counter | 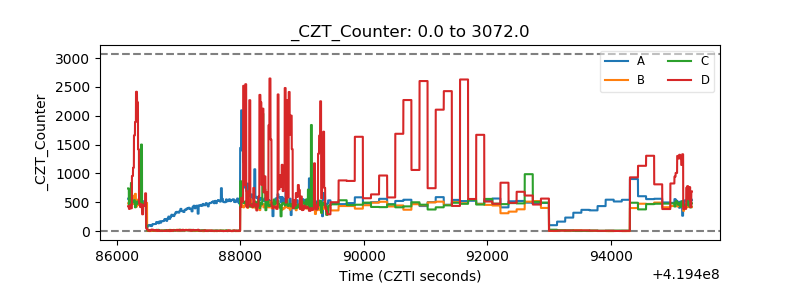 |
| +2.5 Volts monitor |  |
| +5 Volts monitor | 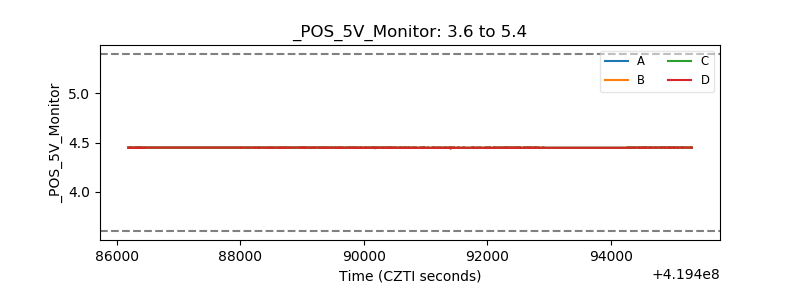 |
| _ROLL_ROT | 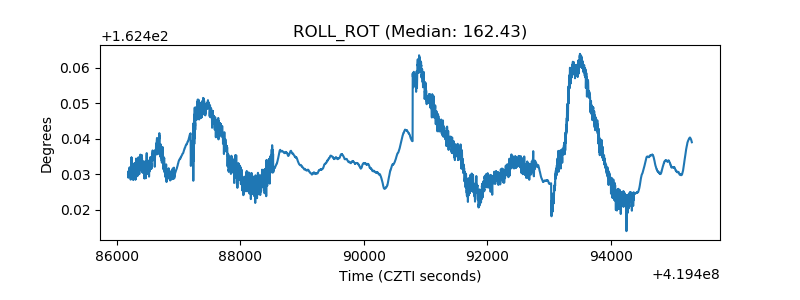 |
| _Roll_DEC | 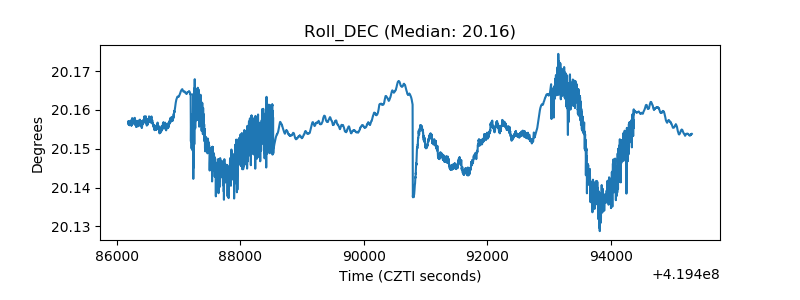 |
| _Roll_RA | 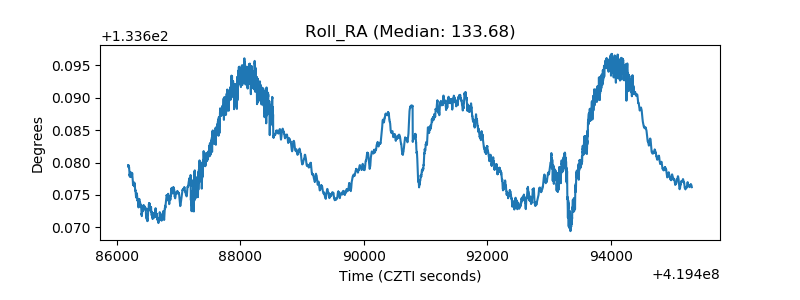 |
| Veto Counter | 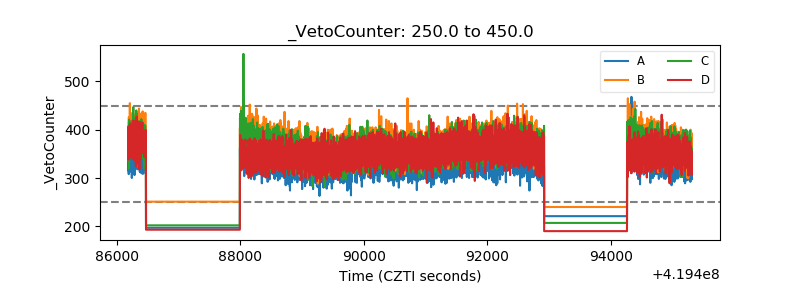 |