| Param | Original file | Final file |
|---|---|---|
| Filename | modeM0/AS1A12_104T02_9000005572_40843cztM0_level2.fits | modeM0/AS1A12_104T02_9000005572_40843cztM0_level2_quad_clean.evt |
| Size (bytes) | 435,559,680 | 98,170,560 |
| Size | 415.4 MB | 93.6 MB |
| Events in quadrant A | 3,429,877 | 661,246 |
| Events in quadrant B | 2,855,822 | 686,174 |
| Events in quadrant C | 2,981,242 | 650,349 |
| Events in quadrant D | 6,374,246 | 542,148 |
| Mode M9 | |||
|---|---|---|---|
| Quadrant | BADHDUFLAG | Total packets | Discarded packets |
| A | 0 | 26 | 0 |
| B | 0 | 26 | 0 |
| C | 0 | 26 | 0 |
| D | 0 | 26 | 0 |
| Mode M0 | |||
|---|---|---|---|
| Quadrant | BADHDUFLAG | Total packets | Discarded packets |
| A | 0 | 13802 | 3 |
| B | 0 | 12748 | 2 |
| C | 0 | 12721 | 2 |
| D | 0 | 23252 | 2 |
| Mode SS | |||
|---|---|---|---|
| Quadrant | BADHDUFLAG | Total packets | Discarded packets |
| A | 0 | 128 | 0 |
| B | 0 | 128 | 0 |
| C | 0 | 128 | 0 |
| D | 0 | 128 | 0 |
| Quadrant | Total seconds | Saturated seconds | Saturation percentage |
|---|---|---|---|
| A | 6196 | 71 | 1.145901% |
| B | 6196 | 8 | 0.129116% |
| C | 6196 | 23 | 0.371207% |
| D | 6196 | 770 | 12.427372% |
Noise dominated data is calculated using 1-second bins in cleaned event files. If a bin has >2000 counts, and if more than 50% of those come from <1% of pixels, then it is considered to be noise-dominated and hence unusable.
| Quadrant | # 1 sec bins | Bins with >0 counts | Bins with >2000 counts | High rate bins dominated by noise | Noise dominated (total time) | Noise dominated (detector-on time) | Marked lightcurve |
|---|---|---|---|---|---|---|---|
| A | 8821 | 6198 | 37 | 37 | 0.42% | 0.60% | 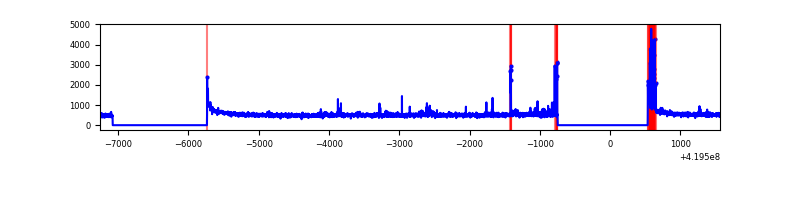 |
| B | 8821 | 6198 | 1 | 1 | 0.01% | 0.02% | 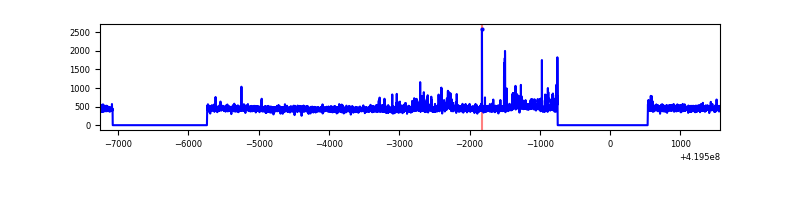 |
| C | 8821 | 6198 | 18 | 18 | 0.20% | 0.29% | 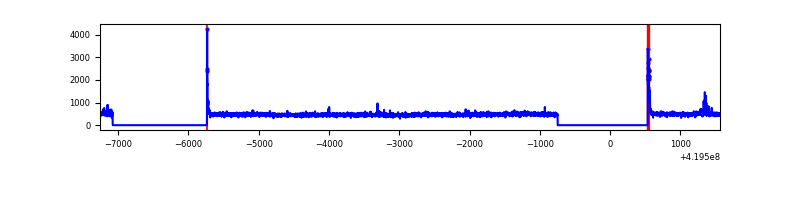 |
| D | 8821 | 6198 | 839 | 839 | 9.51% | 13.54% | 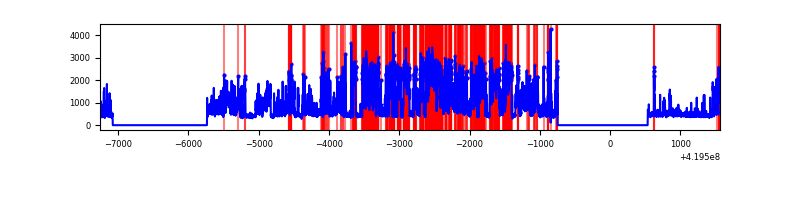 |
Top three noisy pixels from each quadrant. If the there are fewer than three noisy pixels in the level2.evt file, extra rows are filled as -1
| Pixel properties | Quadrant properties | ||||||
|---|---|---|---|---|---|---|---|
| Quadrant | DetID | PixID | Counts | Sigma | Mean | Median | Sigma |
| A | 10 | 83 | 538166 | 3825.47 | 680 | 665 | 140.5 |
| A | 13 | 248 | 170949 | 1211.93 | 680 | 665 | 140.5 |
| A | 12 | 189 | 70750 | 498.8 | 680 | 665 | 140.5 |
| B | 0 | 190 | 135852 | 1017.31 | 680 | 660 | 132.9 |
| B | 5 | 255 | 24587 | 180.05 | 680 | 660 | 132.9 |
| B | 0 | 230 | 24280 | 177.74 | 680 | 660 | 132.9 |
| C | 15 | 214 | 262966 | 1665.94 | 666 | 669 | 157.4 |
| C | 0 | 10 | 74146 | 466.68 | 666 | 669 | 157.4 |
| C | 14 | 254 | 35671 | 222.31 | 666 | 669 | 157.4 |
| D | 12 | 79 | 3162483 | 20133.33 | 642 | 624 | 157.0 |
| D | 2 | 249 | 317266 | 2016.24 | 642 | 624 | 157.0 |
| D | 13 | 249 | 180650 | 1146.33 | 642 | 624 | 157.0 |
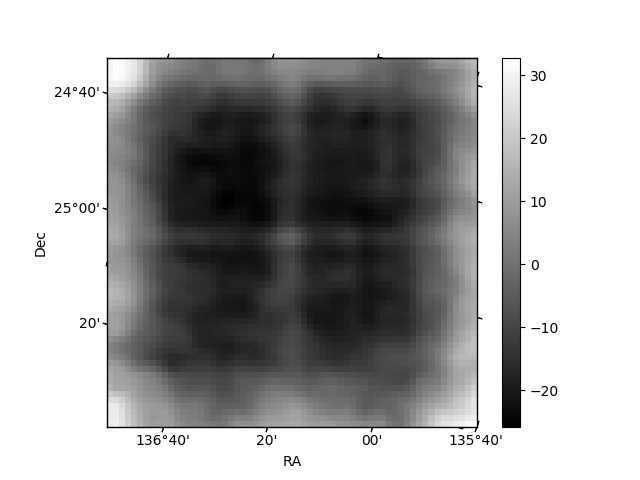
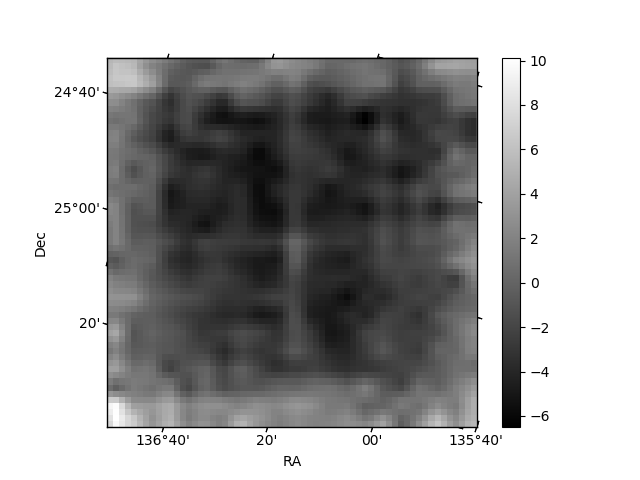
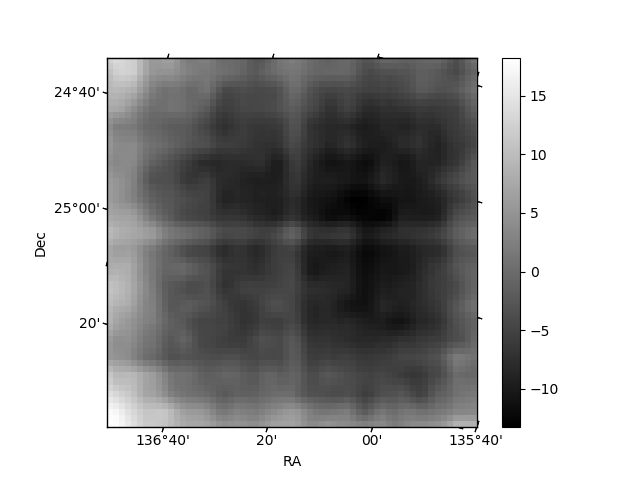
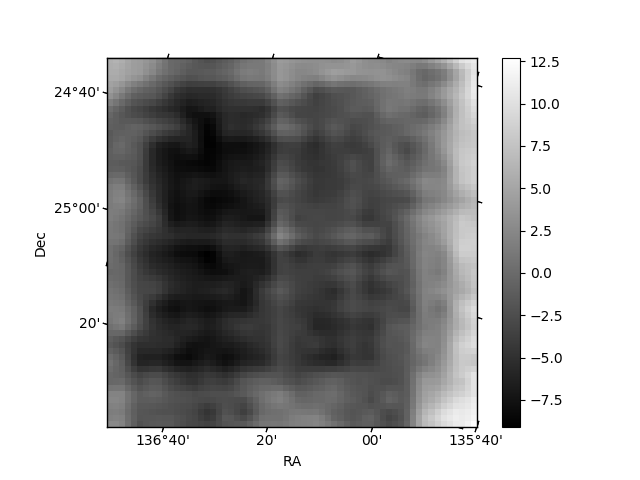
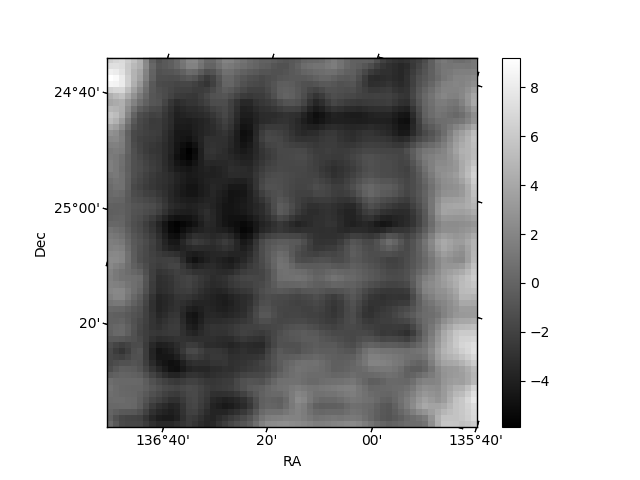
Histogram calculated using DETX and DETY for each event in the final _common_clean file
| Quadrant A | 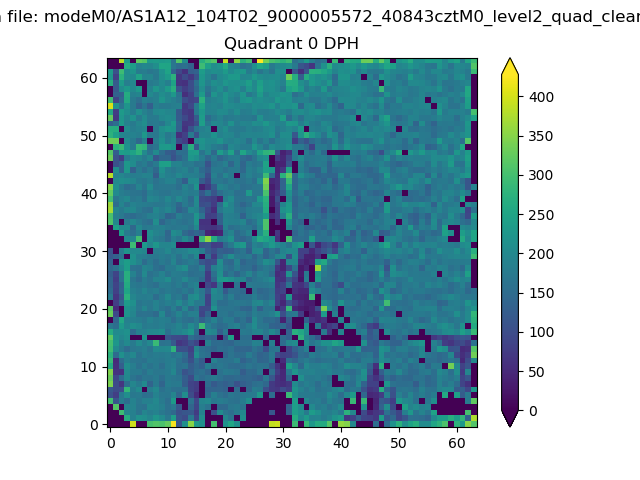 |
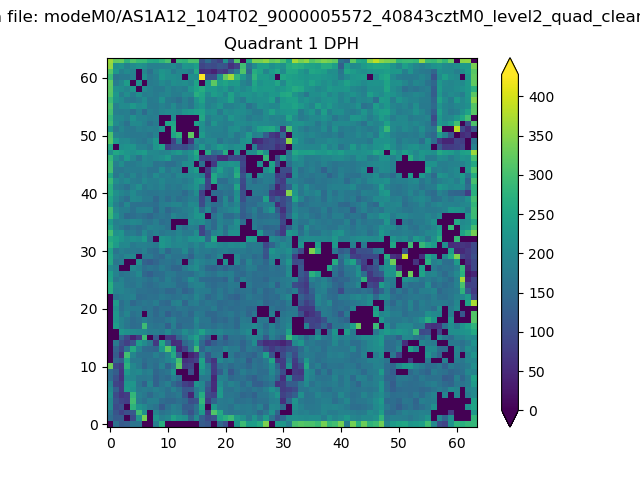 |
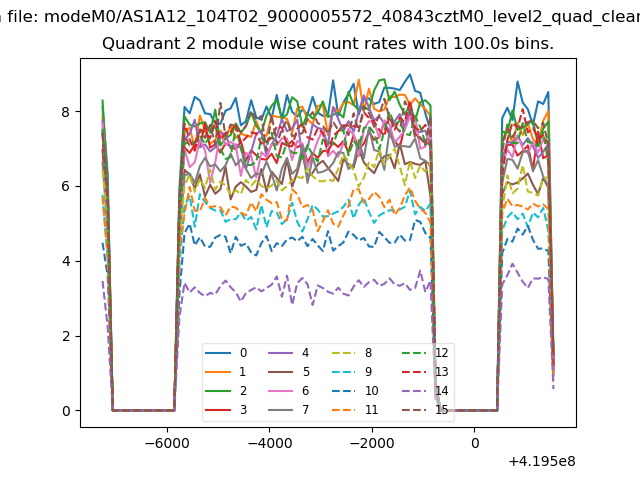
Quadrant B |
|---|---|---|---|
| Quadrant D | 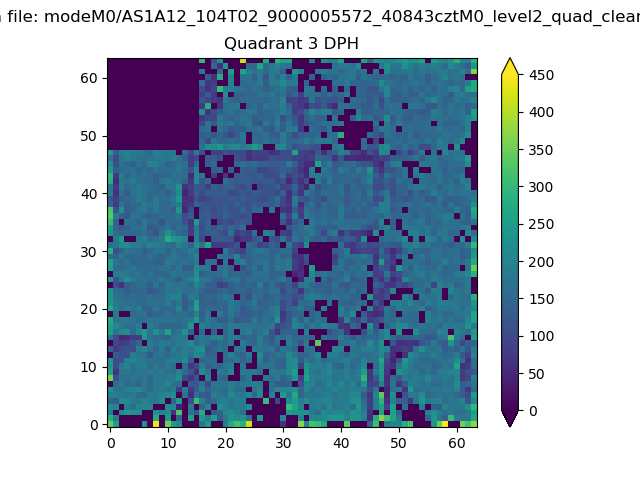 |
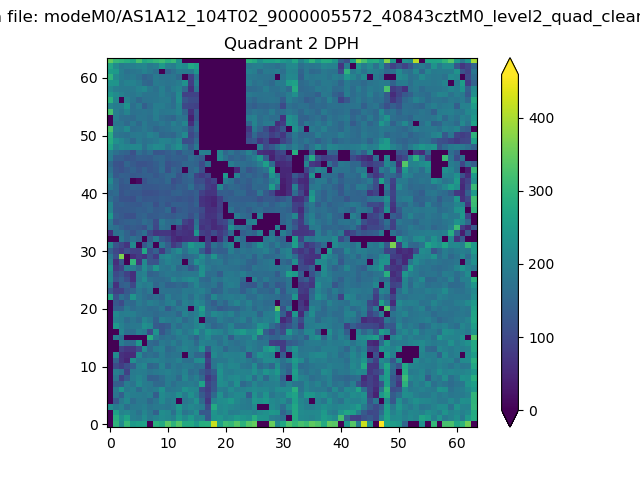 |
Quadrant C |
| Plot type | Count rate plots | Images |
|---|---|---|
| Comparison with Poisson distribution Blue bars denote a histogram of data divided into 1 sec bins. Red curve is a Poisson curve with rate = median count rate of data. |
 |
 |
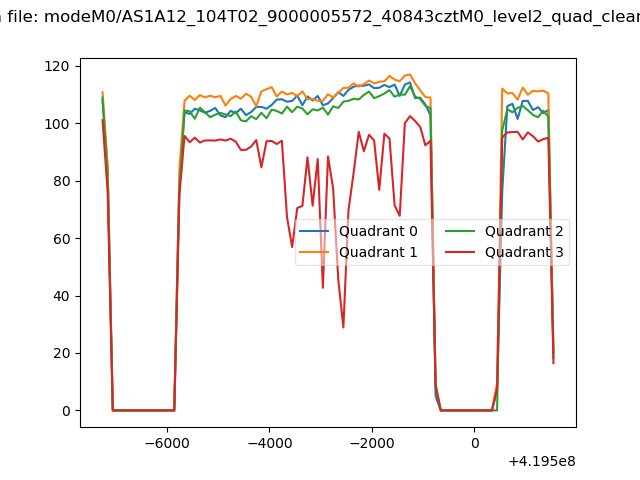
| Quadrant-wise count rates Data is divided into 100 sec bins |
 |
|
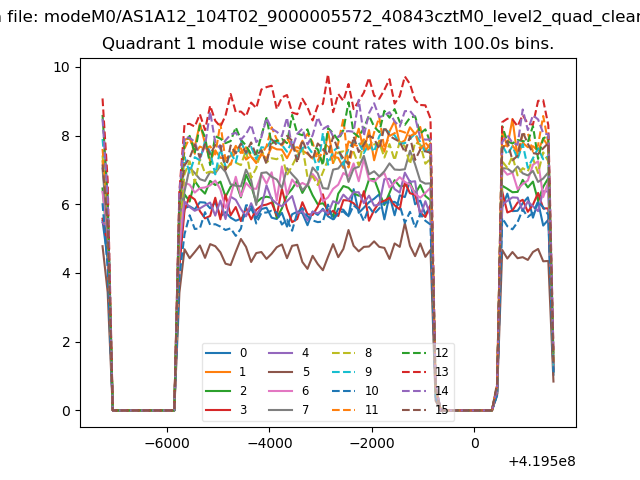
| Module-wise count rates for Quadrant A Data is divided into 100 sec bins |
 |
 |
| Module-wise count rates for Quadrant B Data is divided into 100 sec bins |
 |
 |
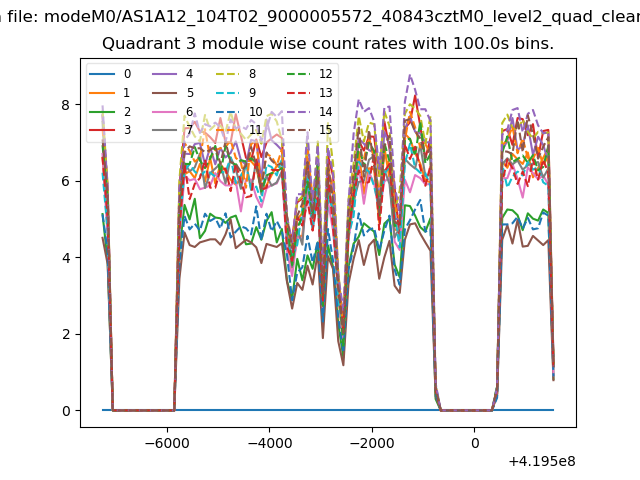
| Module-wise count rates for Quadrant C Data is divided into 100 sec bins |
 |
 |
| Module-wise count rates for Quadrant D Data is divided into 100 sec bins |
 |
 |
| Parameter | Plot |
|---|---|
| CZT HV Monitor | 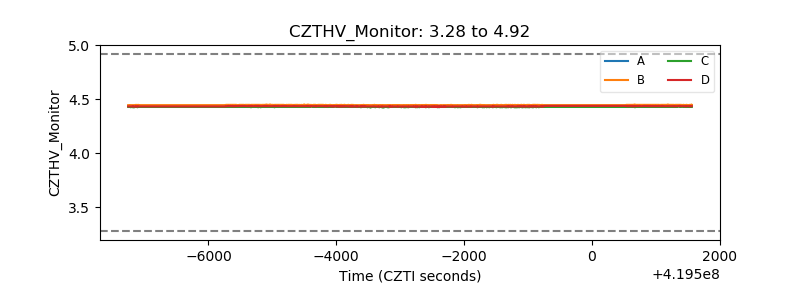 |
| D_VDD | 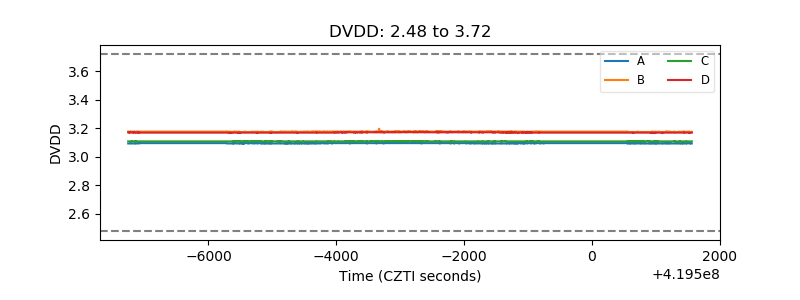 |
| Temperature 1 | 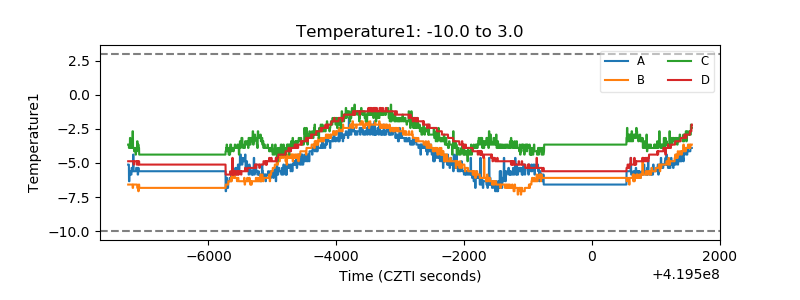 |
| Veto HV Monitor | 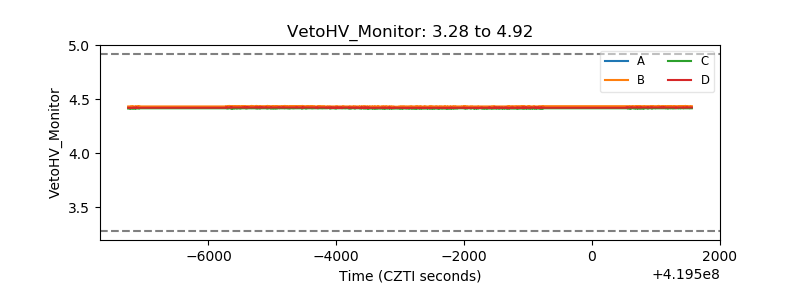 |
| Veto LLD | 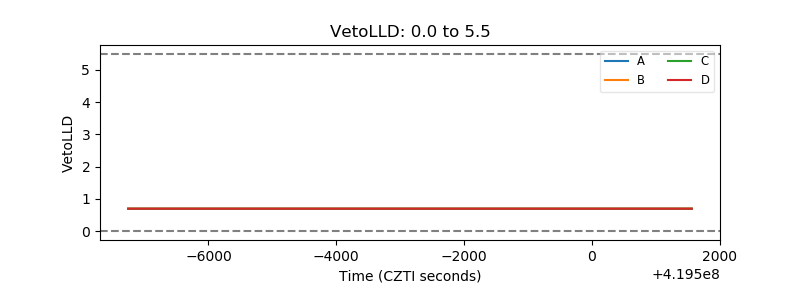 |
| Alpha Counter |  |
| _CPM_Rate |  |
| CZT Counter | 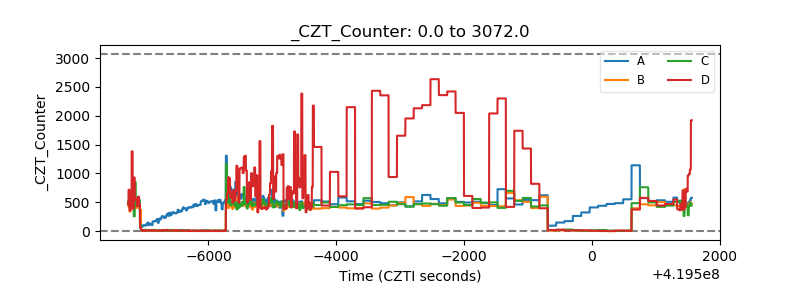 |
| +2.5 Volts monitor | 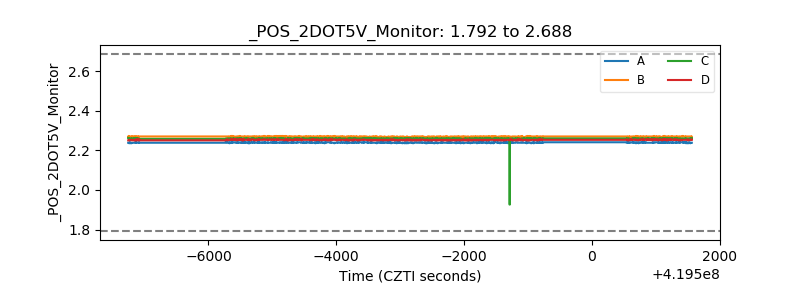 |
| +5 Volts monitor |  |
| _ROLL_ROT | 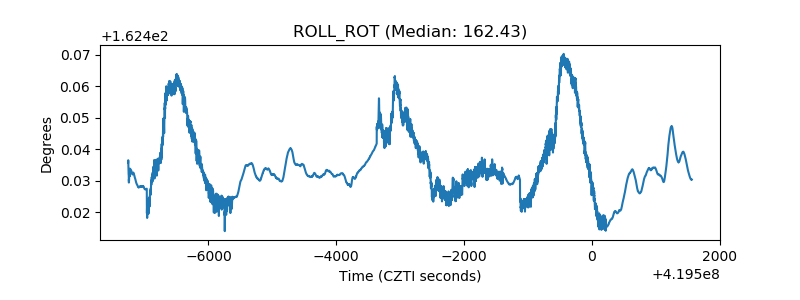 |
| _Roll_DEC | 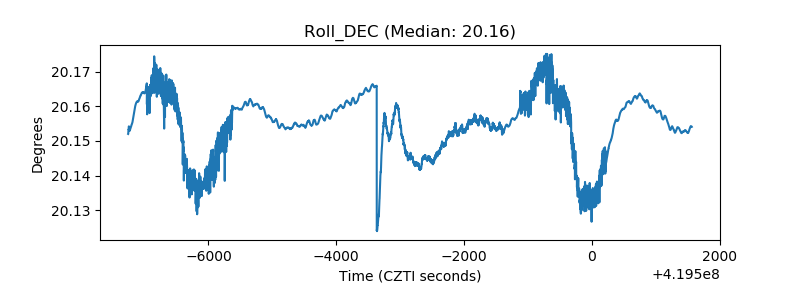 |
| _Roll_RA | 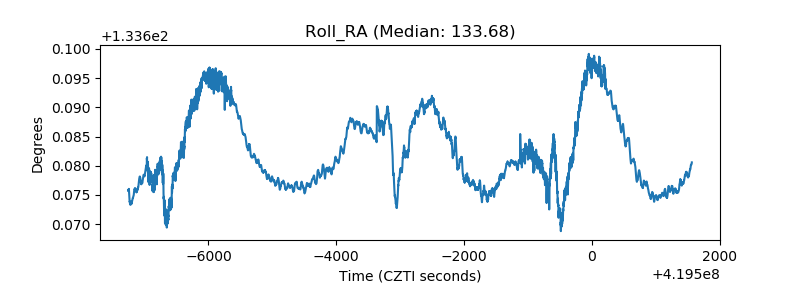 |
| Veto Counter | 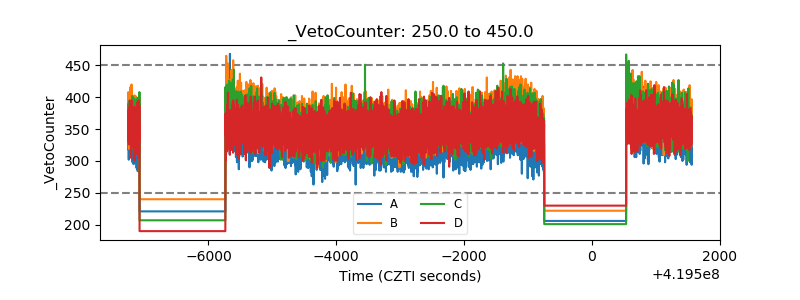 |