| Param | Original file | Final file |
|---|---|---|
| Filename | modeM0/AS1A12_104T02_9000005572_40845cztM0_level2.fits | modeM0/AS1A12_104T02_9000005572_40845cztM0_level2_quad_clean.evt |
| Size (bytes) | 739,054,080 | 173,027,520 |
| Size | 704.8 MB | 165.0 MB |
| Events in quadrant A | 6,349,412 | 1,151,593 |
| Events in quadrant B | 4,936,034 | 1,196,295 |
| Events in quadrant C | 5,390,486 | 1,138,432 |
| Events in quadrant D | 9,839,849 | 1,000,117 |
| Mode M9 | |||
|---|---|---|---|
| Quadrant | BADHDUFLAG | Total packets | Discarded packets |
| A | 0 | 40 | 0 |
| B | 0 | 40 | 0 |
| C | 0 | 40 | 0 |
| D | 0 | 40 | 0 |
| Mode M0 | |||
|---|---|---|---|
| Quadrant | BADHDUFLAG | Total packets | Discarded packets |
| A | 0 | 25492 | 4 |
| B | 0 | 22228 | 3 |
| C | 0 | 23014 | 3 |
| D | 0 | 36761 | 3 |
| Mode SS | |||
|---|---|---|---|
| Quadrant | BADHDUFLAG | Total packets | Discarded packets |
| A | 0 | 222 | 0 |
| B | 0 | 222 | 0 |
| C | 0 | 222 | 0 |
| D | 0 | 222 | 0 |
| Quadrant | Total seconds | Saturated seconds | Saturation percentage |
|---|---|---|---|
| A | 10865 | 175 | 1.610676% |
| B | 10865 | 19 | 0.174873% |
| C | 10865 | 55 | 0.506213% |
| D | 10865 | 769 | 7.077773% |
Noise dominated data is calculated using 1-second bins in cleaned event files. If a bin has >2000 counts, and if more than 50% of those come from <1% of pixels, then it is considered to be noise-dominated and hence unusable.
| Quadrant | # 1 sec bins | Bins with >0 counts | Bins with >2000 counts | High rate bins dominated by noise | Noise dominated (total time) | Noise dominated (detector-on time) | Marked lightcurve |
|---|---|---|---|---|---|---|---|
| A | 14952 | 10868 | 114 | 114 | 0.76% | 1.05% | 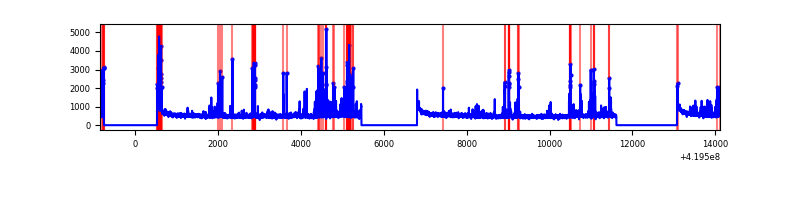 |
| B | 14952 | 10868 | 5 | 5 | 0.03% | 0.05% | 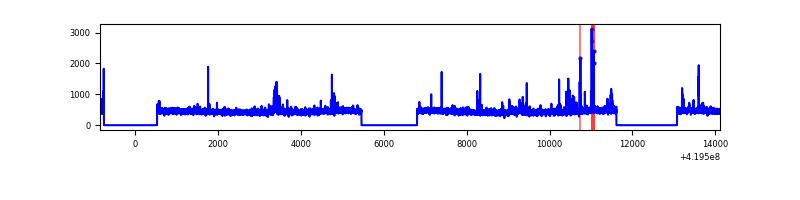 |
| C | 14952 | 10868 | 38 | 38 | 0.25% | 0.35% | 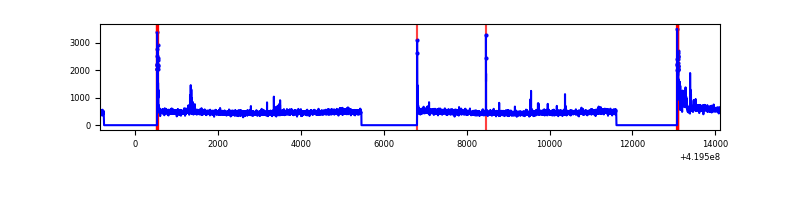 |
| D | 14952 | 10868 | 824 | 824 | 5.51% | 7.58% | 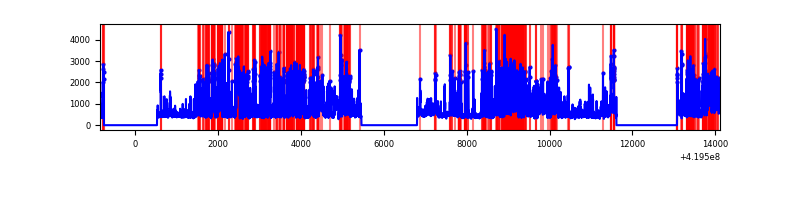 |
Top three noisy pixels from each quadrant. If the there are fewer than three noisy pixels in the level2.evt file, extra rows are filled as -1
| Pixel properties | Quadrant properties | ||||||
|---|---|---|---|---|---|---|---|
| Quadrant | DetID | PixID | Counts | Sigma | Mean | Median | Sigma |
| A | 10 | 83 | 908202 | 3717.87 | 1191 | 1165 | 244.0 |
| A | 13 | 248 | 698176 | 2856.99 | 1191 | 1165 | 244.0 |
| A | 2 | 79 | 72399 | 291.98 | 1191 | 1165 | 244.0 |
| B | 0 | 190 | 192386 | 825.82 | 1186 | 1151 | 231.6 |
| B | 5 | 255 | 55743 | 235.75 | 1186 | 1151 | 231.6 |
| B | 12 | 111 | 29632 | 122.99 | 1186 | 1151 | 231.6 |
| C | 15 | 214 | 455346 | 1670.55 | 1166 | 1173 | 271.9 |
| C | 10 | 70 | 187979 | 687.11 | 1166 | 1173 | 271.9 |
| C | 0 | 10 | 128835 | 469.57 | 1166 | 1173 | 271.9 |
| D | 12 | 79 | 4085781 | 14642.56 | 1144 | 1113 | 279.0 |
| D | 13 | 249 | 528768 | 1891.52 | 1144 | 1113 | 279.0 |
| D | 2 | 249 | 512430 | 1832.95 | 1144 | 1113 | 279.0 |
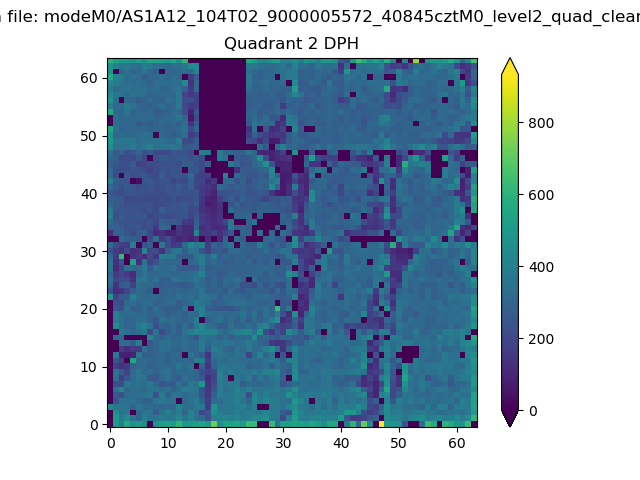
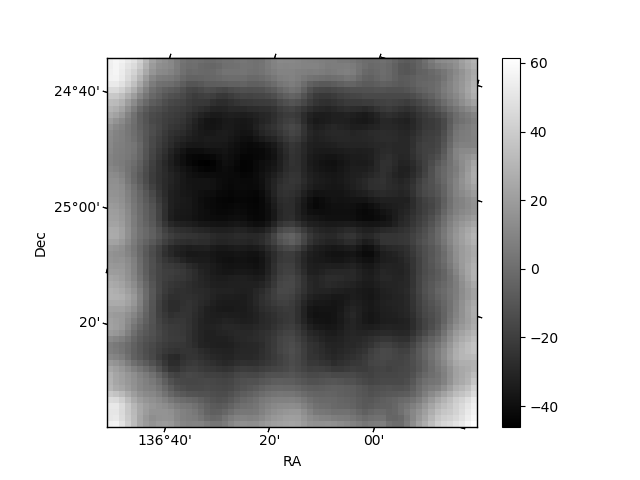
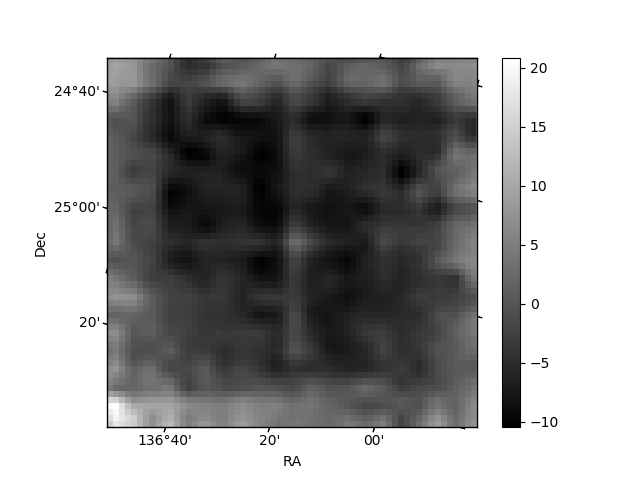
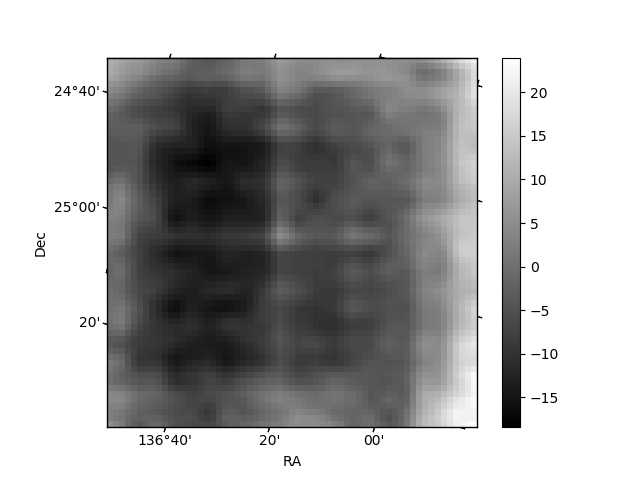
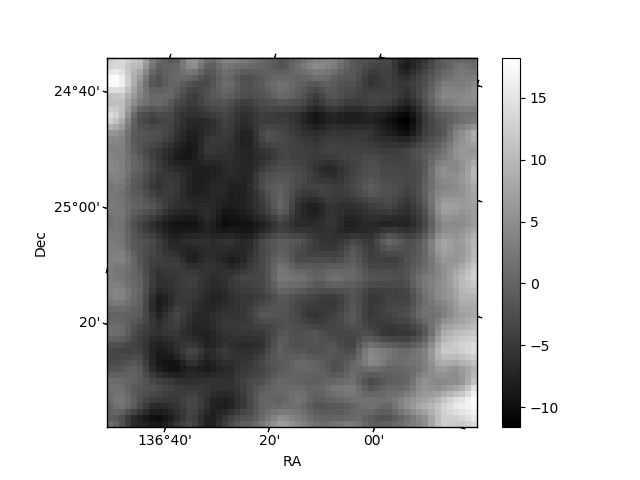
Histogram calculated using DETX and DETY for each event in the final _common_clean file
| Quadrant A | 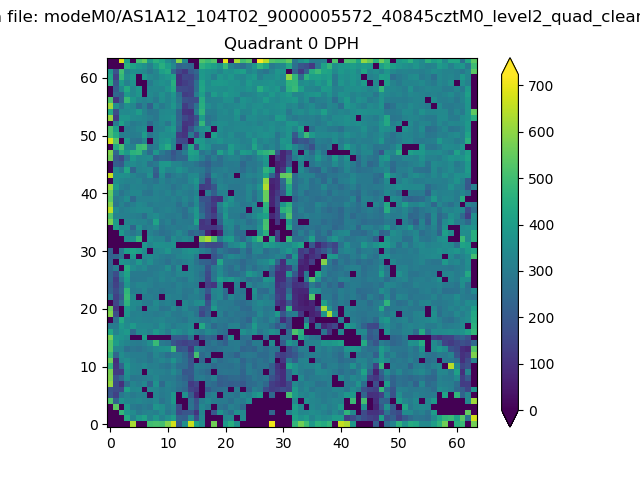 |
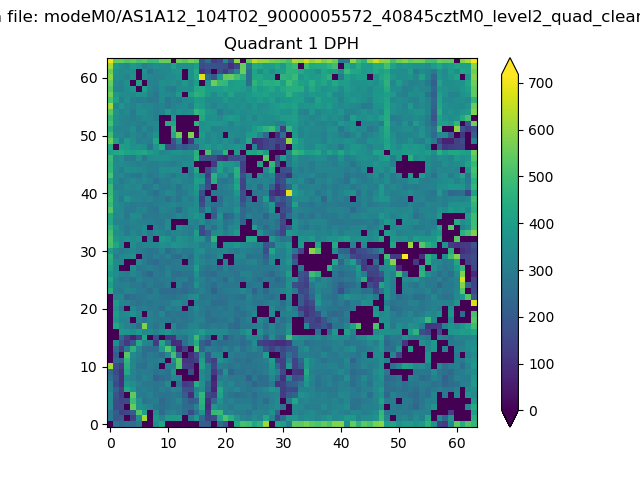 |
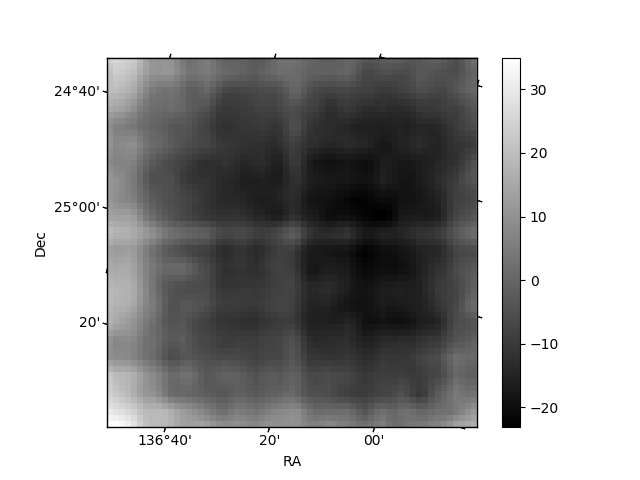
Quadrant B |
|---|---|---|---|
| Quadrant D | 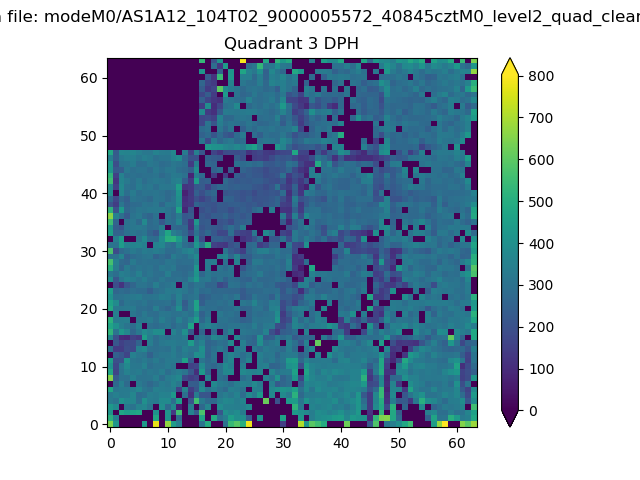 |
 |
Quadrant C |
| Plot type | Count rate plots | Images |
|---|---|---|
| Comparison with Poisson distribution Blue bars denote a histogram of data divided into 1 sec bins. Red curve is a Poisson curve with rate = median count rate of data. |
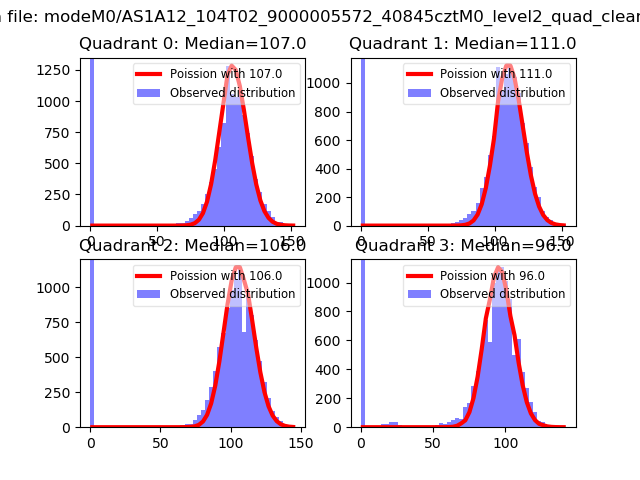 |
 |
| Quadrant-wise count rates Data is divided into 100 sec bins |
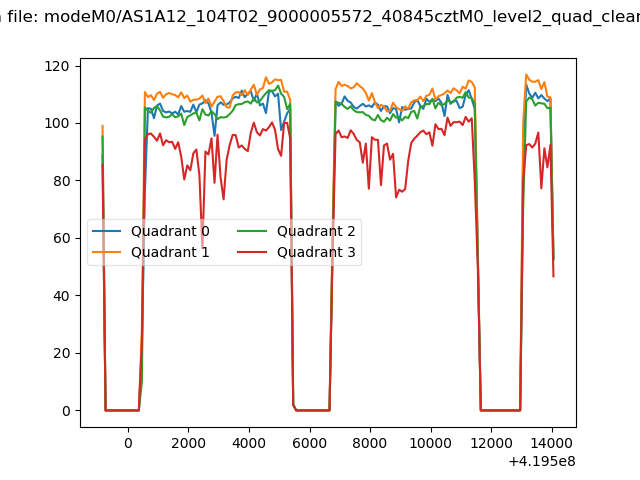 |
|
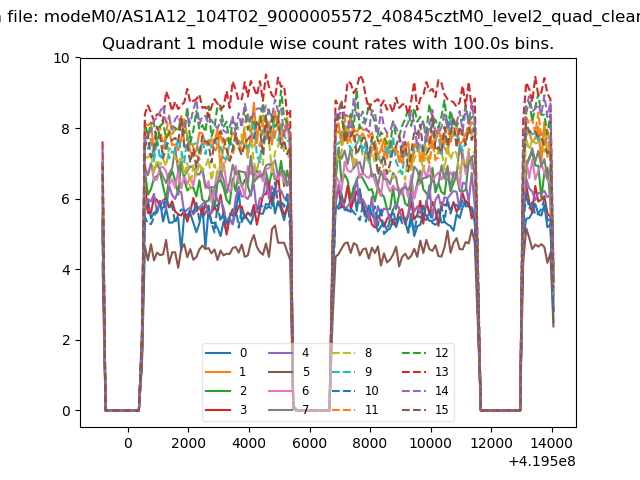
| Module-wise count rates for Quadrant A Data is divided into 100 sec bins |
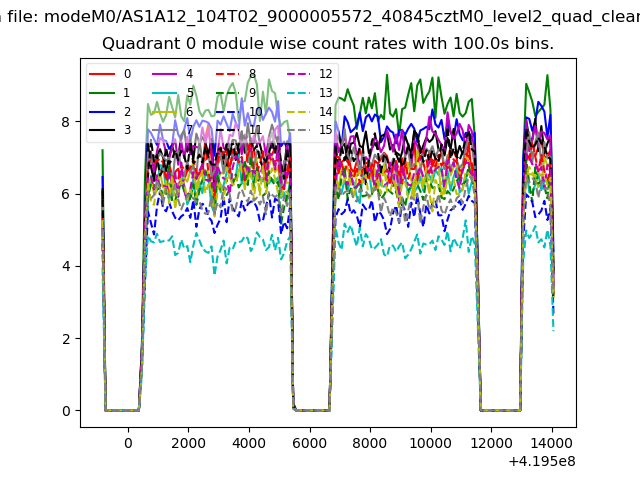 |
 |
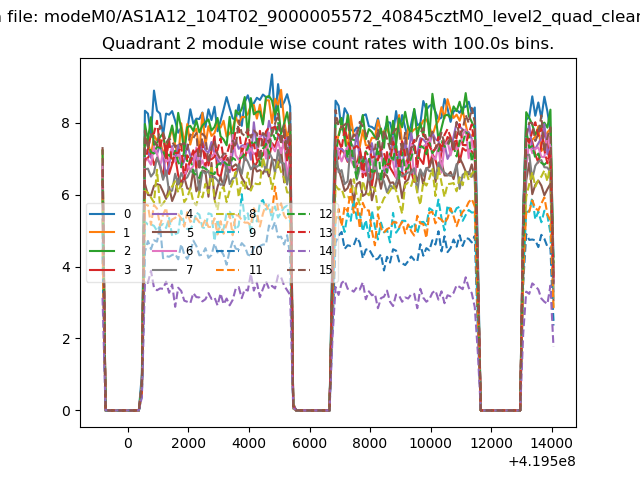
| Module-wise count rates for Quadrant B Data is divided into 100 sec bins |
 |
 |
| Module-wise count rates for Quadrant C Data is divided into 100 sec bins |
 |
 |
| Module-wise count rates for Quadrant D Data is divided into 100 sec bins |
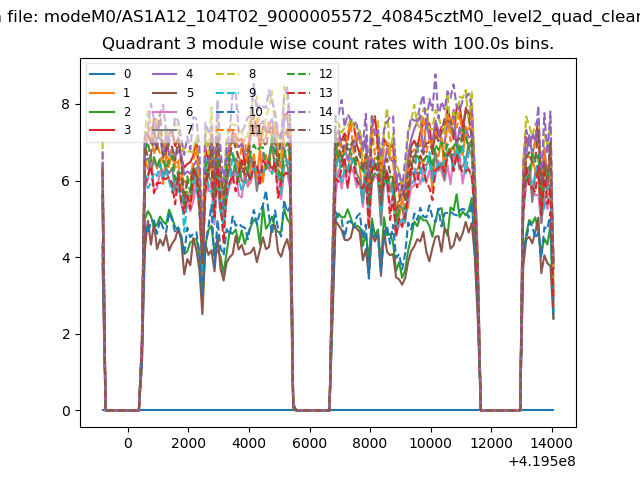 |
 |
| Parameter | Plot |
|---|---|
| CZT HV Monitor | 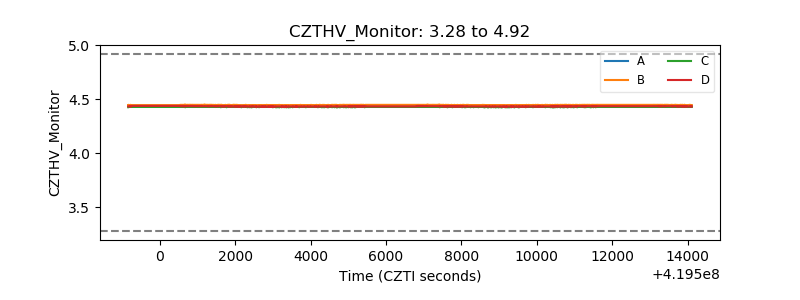 |
| D_VDD | 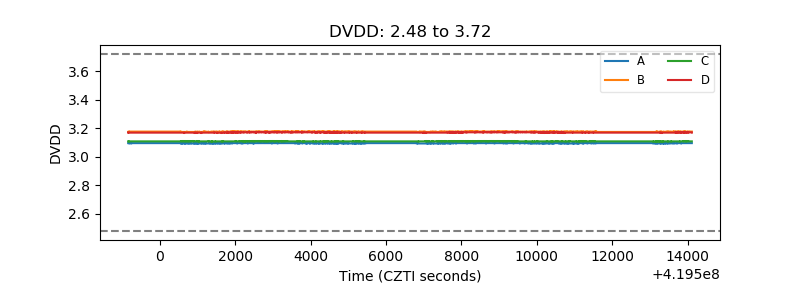 |
| Temperature 1 | 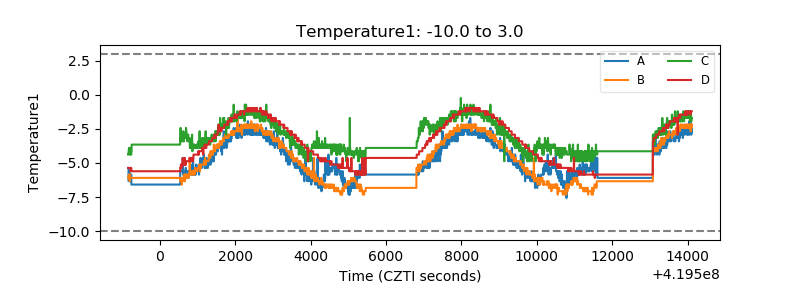 |
| Veto HV Monitor | 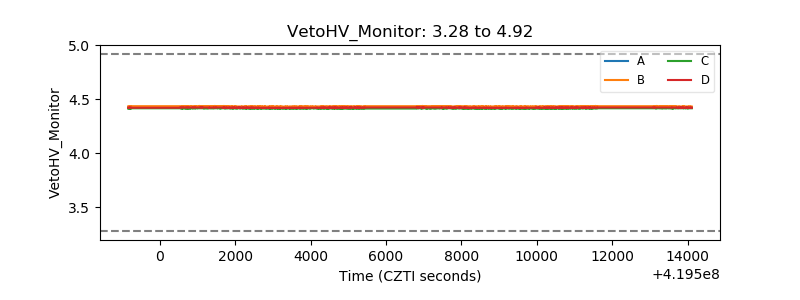 |
| Veto LLD | 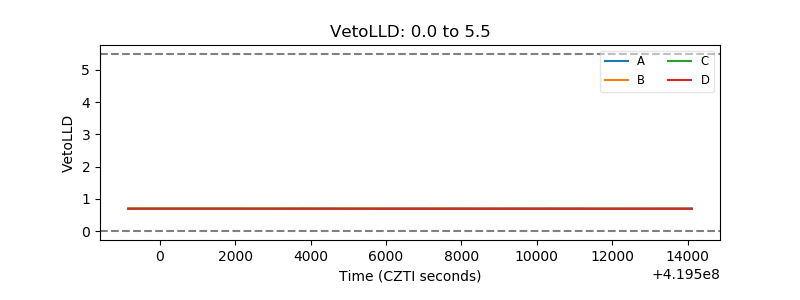 |
| Alpha Counter |  |
| _CPM_Rate |  |
| CZT Counter | 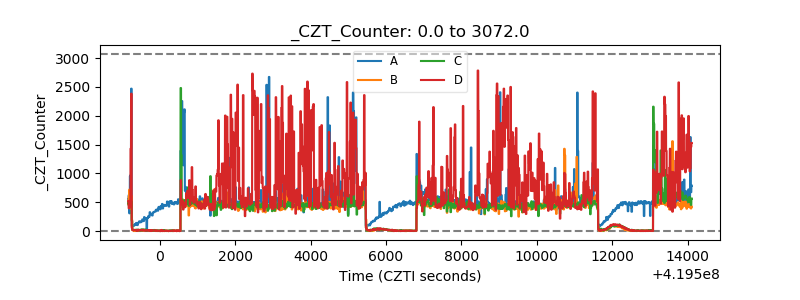 |
| +2.5 Volts monitor | 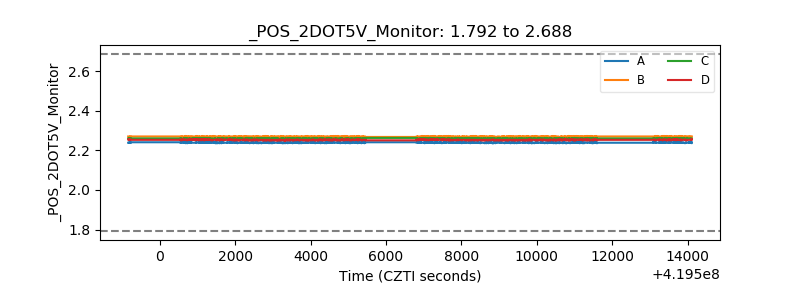 |
| +5 Volts monitor |  |
| _ROLL_ROT | 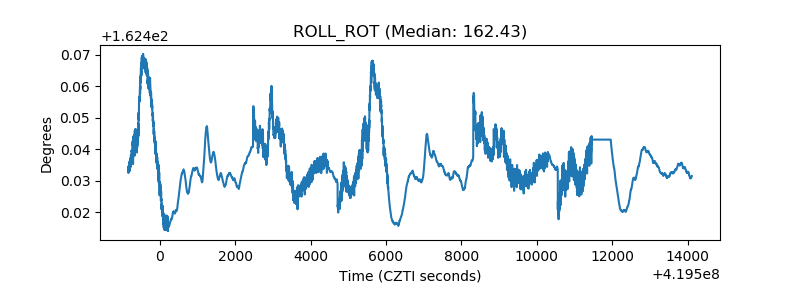 |
| _Roll_DEC | 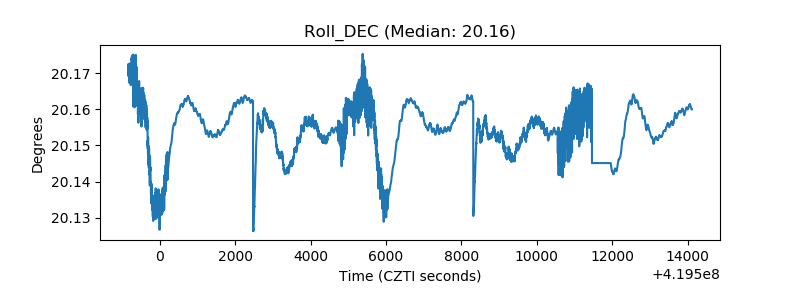 |
| _Roll_RA | 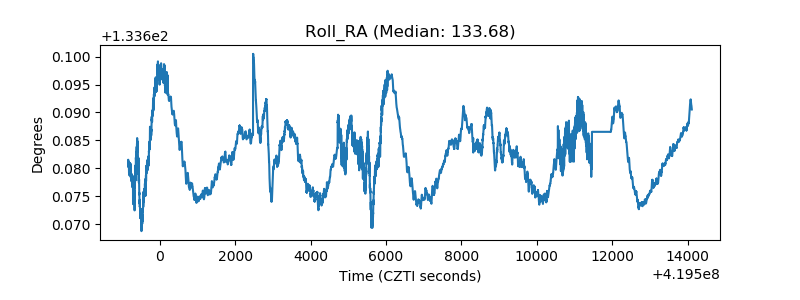 |
| Veto Counter |  |