| Param | Original file | Final file |
|---|---|---|
| Filename | modeM0/AS1A12_104T02_9000005572_40846cztM0_level2.fits | modeM0/AS1A12_104T02_9000005572_40846cztM0_level2_quad_clean.evt |
| Size (bytes) | 428,866,560 | 89,386,560 |
| Size | 409.0 MB | 85.2 MB |
| Events in quadrant A | 3,311,495 | 607,326 |
| Events in quadrant B | 2,528,380 | 621,454 |
| Events in quadrant C | 3,489,231 | 578,694 |
| Events in quadrant D | 6,111,314 | 507,473 |
| Mode M9 | |||
|---|---|---|---|
| Quadrant | BADHDUFLAG | Total packets | Discarded packets |
| A | 0 | 17 | 0 |
| B | 0 | 17 | 0 |
| C | 0 | 17 | 0 |
| D | 0 | 18 | 0 |
| Mode M0 | |||
|---|---|---|---|
| Quadrant | BADHDUFLAG | Total packets | Discarded packets |
| A | 0 | 13487 | 3 |
| B | 0 | 11458 | 2 |
| C | 0 | 13839 | 2 |
| D | 0 | 22133 | 2 |
| Mode SS | |||
|---|---|---|---|
| Quadrant | BADHDUFLAG | Total packets | Discarded packets |
| A | 0 | 114 | 0 |
| B | 0 | 114 | 0 |
| C | 0 | 114 | 0 |
| D | 0 | 114 | 0 |
| Quadrant | Total seconds | Saturated seconds | Saturation percentage |
|---|---|---|---|
| A | 5597 | 48 | 0.857602% |
| B | 5597 | 19 | 0.339468% |
| C | 5597 | 158 | 2.822941% |
| D | 5597 | 639 | 11.416830% |
Noise dominated data is calculated using 1-second bins in cleaned event files. If a bin has >2000 counts, and if more than 50% of those come from <1% of pixels, then it is considered to be noise-dominated and hence unusable.
| Quadrant | # 1 sec bins | Bins with >0 counts | Bins with >2000 counts | High rate bins dominated by noise | Noise dominated (total time) | Noise dominated (detector-on time) | Marked lightcurve |
|---|---|---|---|---|---|---|---|
| A | 7179 | 5598 | 34 | 34 | 0.47% | 0.61% | 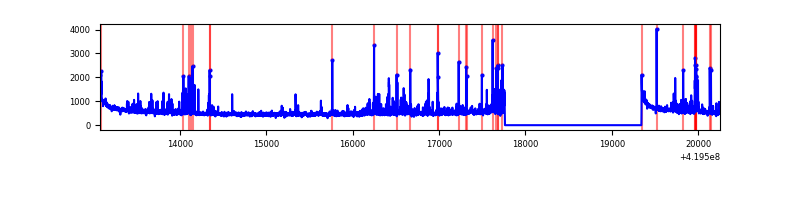 |
| B | 7179 | 5598 | 5 | 5 | 0.07% | 0.09% |  |
| C | 7179 | 5598 | 121 | 121 | 1.69% | 2.16% | 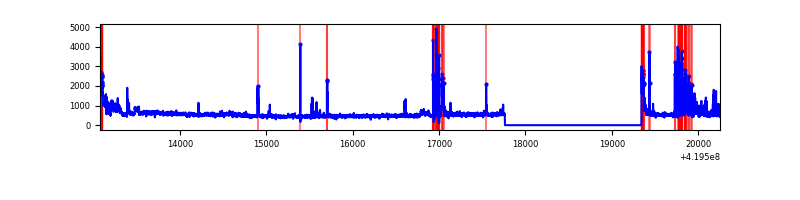 |
| D | 7179 | 5598 | 670 | 670 | 9.33% | 11.97% |  |
Top three noisy pixels from each quadrant. If the there are fewer than three noisy pixels in the level2.evt file, extra rows are filled as -1
| Pixel properties | Quadrant properties | ||||||
|---|---|---|---|---|---|---|---|
| Quadrant | DetID | PixID | Counts | Sigma | Mean | Median | Sigma |
| A | 10 | 83 | 518407 | 4090.16 | 614 | 602 | 126.6 |
| A | 13 | 248 | 295268 | 2327.58 | 614 | 602 | 126.6 |
| A | 2 | 79 | 72192 | 565.49 | 614 | 602 | 126.6 |
| B | 0 | 186 | 38066 | 312.75 | 609 | 592 | 119.8 |
| B | 0 | 190 | 31933 | 261.57 | 609 | 592 | 119.8 |
| B | 5 | 255 | 25085 | 204.42 | 609 | 592 | 119.8 |
| C | 14 | 254 | 442555 | 3204.23 | 589 | 593 | 137.9 |
| C | 10 | 70 | 332519 | 2406.46 | 589 | 593 | 137.9 |
| C | 15 | 214 | 234578 | 1696.39 | 589 | 593 | 137.9 |
| D | 12 | 79 | 3020662 | 21036.48 | 581 | 563 | 143.6 |
| D | 13 | 249 | 414012 | 2879.87 | 581 | 563 | 143.6 |
| D | 2 | 249 | 309910 | 2154.75 | 581 | 563 | 143.6 |
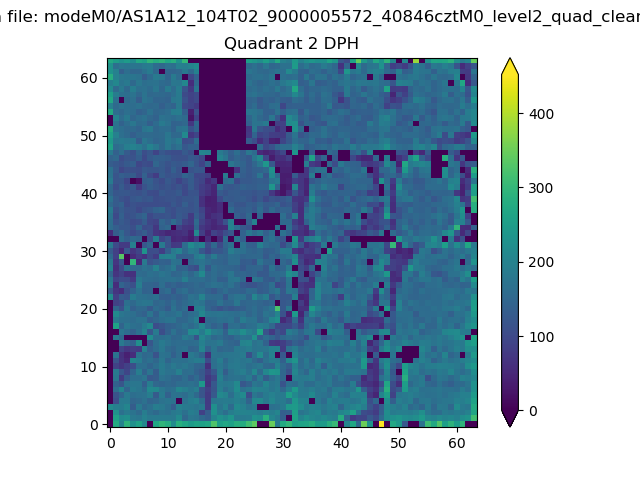
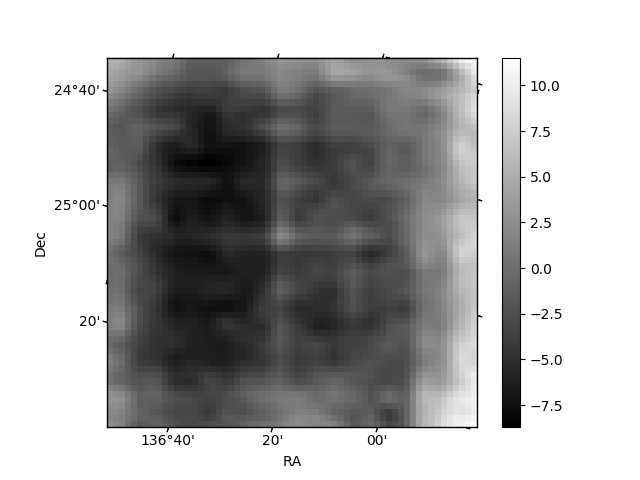
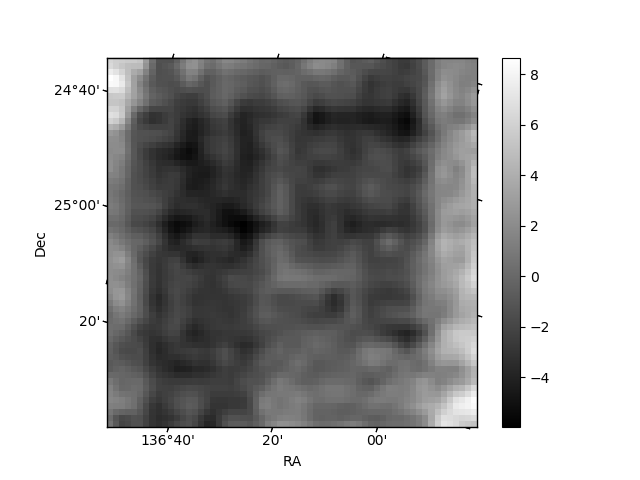
Histogram calculated using DETX and DETY for each event in the final _common_clean file
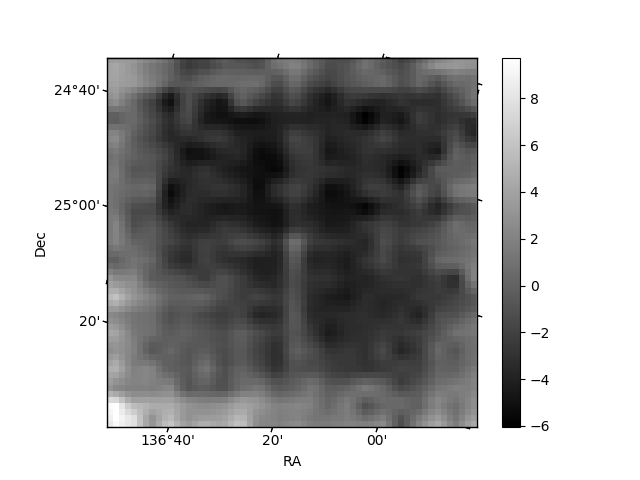
| Quadrant A | 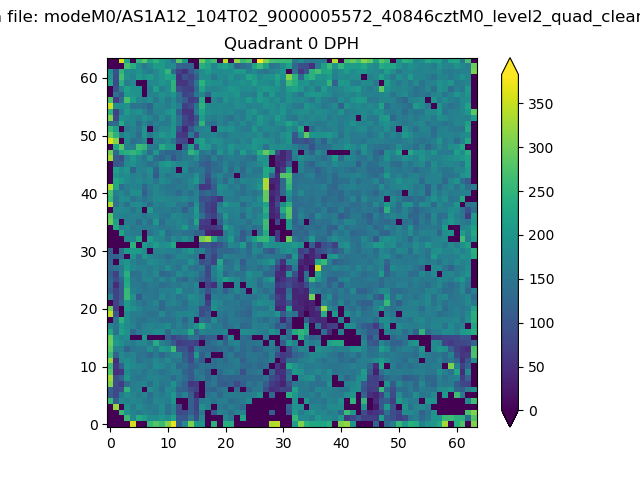 |
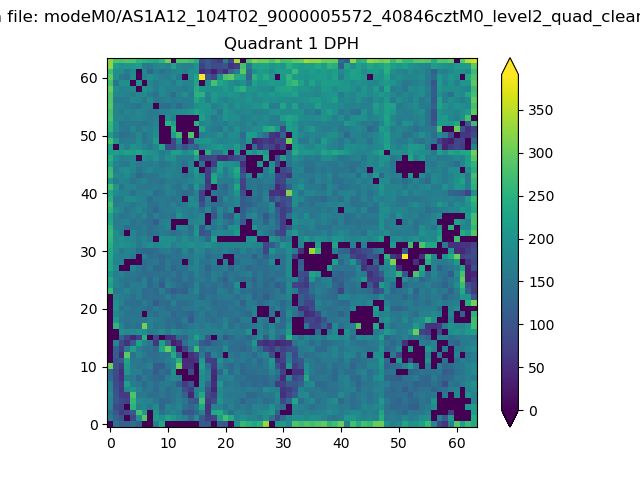 |
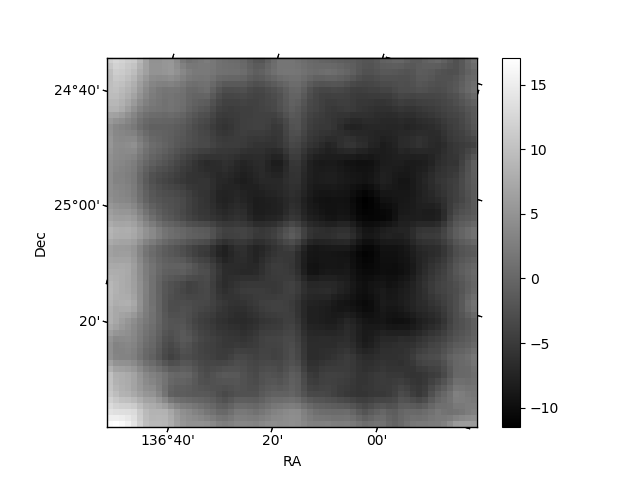
Quadrant B |
|---|---|---|---|
| Quadrant D | 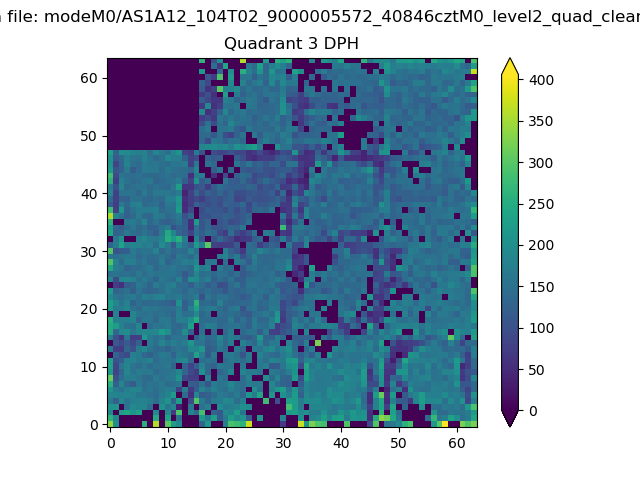 |
 |
Quadrant C |
| Plot type | Count rate plots | Images |
|---|---|---|
| Comparison with Poisson distribution Blue bars denote a histogram of data divided into 1 sec bins. Red curve is a Poisson curve with rate = median count rate of data. |
 |
 |
| Quadrant-wise count rates Data is divided into 100 sec bins |
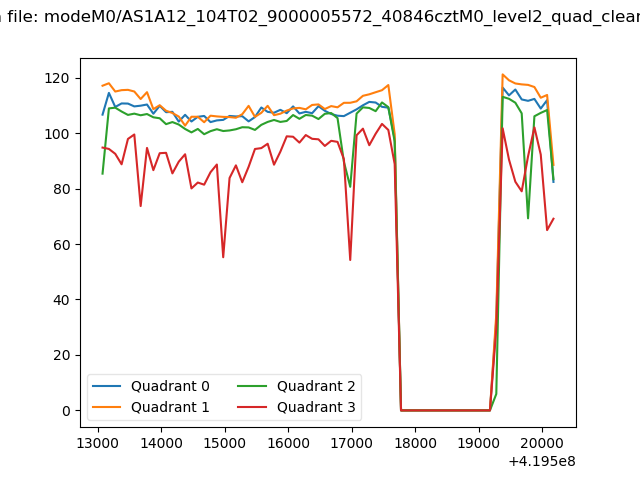 |
|
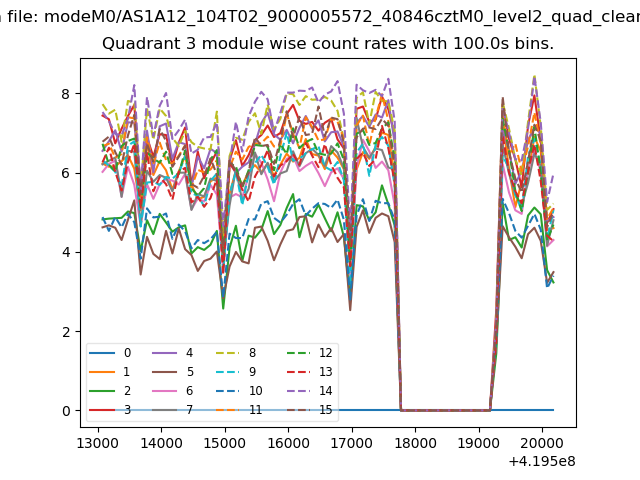
| Module-wise count rates for Quadrant A Data is divided into 100 sec bins |
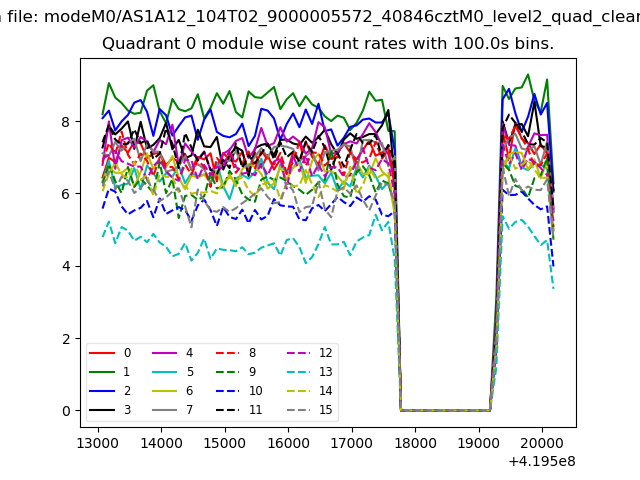 |
 |
| Module-wise count rates for Quadrant B Data is divided into 100 sec bins |
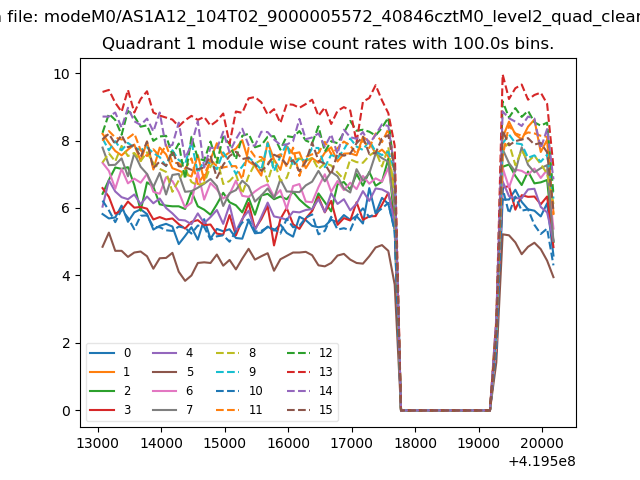 |
 |
| Module-wise count rates for Quadrant C Data is divided into 100 sec bins |
 |
 |
| Module-wise count rates for Quadrant D Data is divided into 100 sec bins |
 |
 |
| Parameter | Plot |
|---|---|
| CZT HV Monitor | 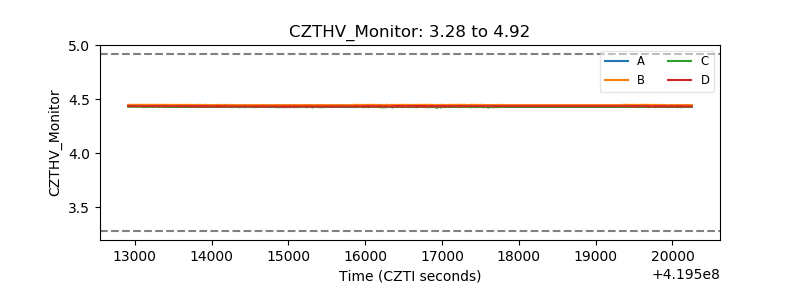 |
| D_VDD | 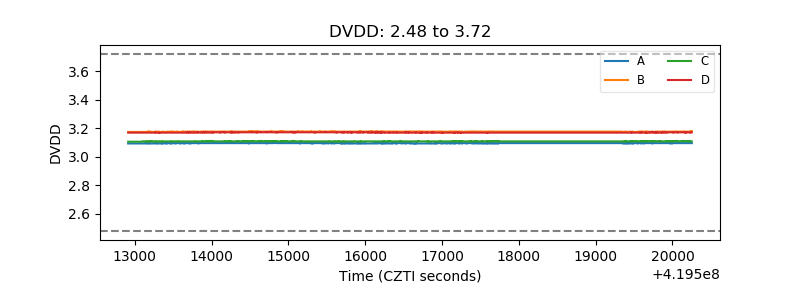 |
| Temperature 1 | 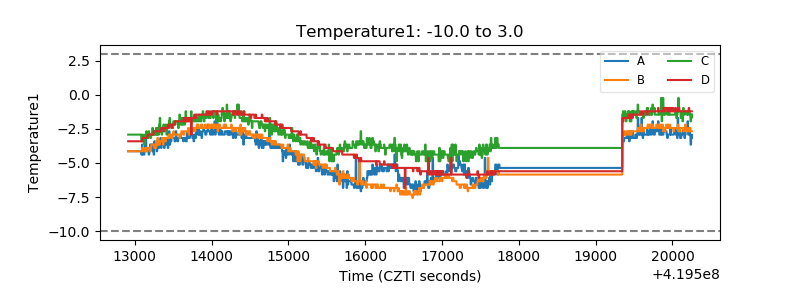 |
| Veto HV Monitor |  |
| Veto LLD | 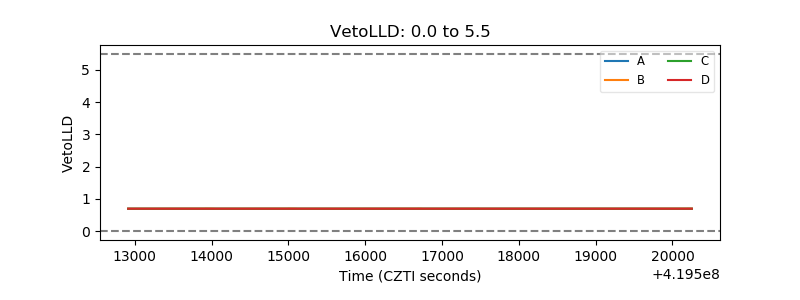 |
| Alpha Counter |  |
| _CPM_Rate |  |
| CZT Counter | 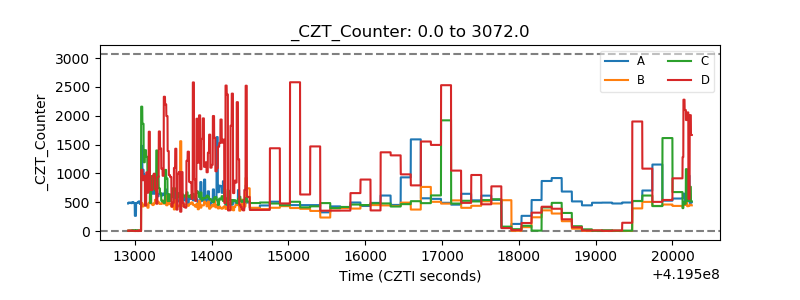 |
| +2.5 Volts monitor | 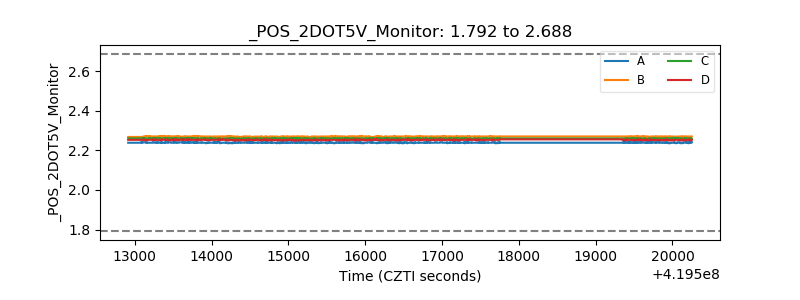 |
| +5 Volts monitor |  |
| _ROLL_ROT | 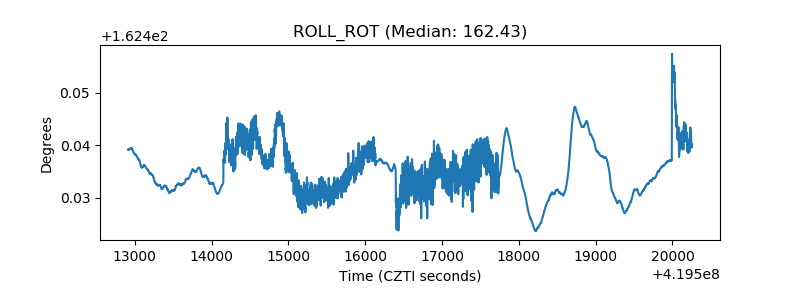 |
| _Roll_DEC | 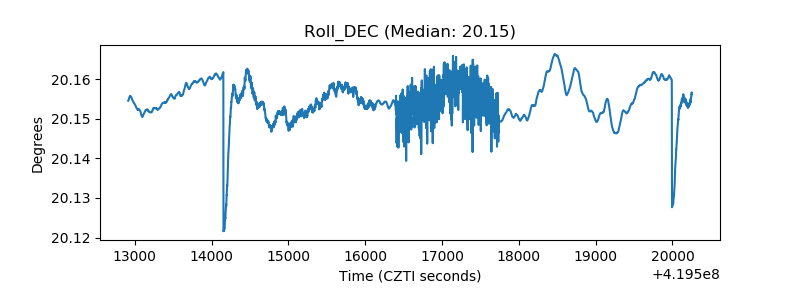 |
| _Roll_RA | 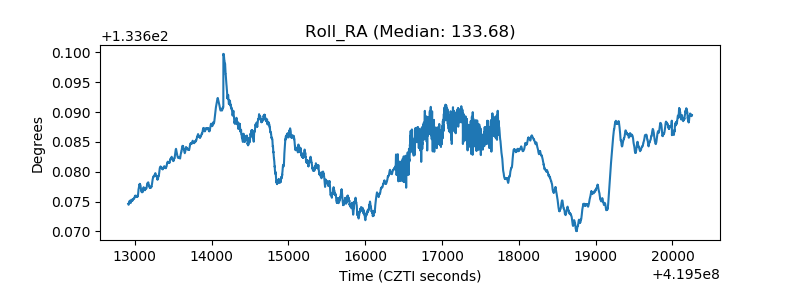 |
| Veto Counter |  |