| Param | Original file | Final file |
|---|---|---|
| Filename | modeM0/AS1A12_104T02_9000005572_40847cztM0_level2.fits | modeM0/AS1A12_104T02_9000005572_40847cztM0_level2_quad_clean.evt |
| Size (bytes) | 440,982,720 | 88,220,160 |
| Size | 420.6 MB | 84.1 MB |
| Events in quadrant A | 3,177,639 | 607,540 |
| Events in quadrant B | 2,425,822 | 620,335 |
| Events in quadrant C | 3,680,597 | 572,291 |
| Events in quadrant D | 6,610,868 | 484,371 |
| Mode M9 | |||
|---|---|---|---|
| Quadrant | BADHDUFLAG | Total packets | Discarded packets |
| A | 0 | 18 | 0 |
| B | 0 | 18 | 0 |
| C | 0 | 18 | 0 |
| D | 0 | 19 | 0 |
| Mode M0 | |||
|---|---|---|---|
| Quadrant | BADHDUFLAG | Total packets | Discarded packets |
| A | 0 | 13042 | 3 |
| B | 0 | 11216 | 2 |
| C | 0 | 14520 | 2 |
| D | 0 | 23516 | 2 |
| Mode SS | |||
|---|---|---|---|
| Quadrant | BADHDUFLAG | Total packets | Discarded packets |
| A | 0 | 114 | 0 |
| B | 0 | 114 | 0 |
| C | 0 | 114 | 0 |
| D | 0 | 114 | 0 |
| Quadrant | Total seconds | Saturated seconds | Saturation percentage |
|---|---|---|---|
| A | 5518 | 51 | 0.924248% |
| B | 5518 | 22 | 0.398695% |
| C | 5518 | 250 | 4.530627% |
| D | 5518 | 850 | 15.404132% |
Noise dominated data is calculated using 1-second bins in cleaned event files. If a bin has >2000 counts, and if more than 50% of those come from <1% of pixels, then it is considered to be noise-dominated and hence unusable.
| Quadrant | # 1 sec bins | Bins with >0 counts | Bins with >2000 counts | High rate bins dominated by noise | Noise dominated (total time) | Noise dominated (detector-on time) | Marked lightcurve |
|---|---|---|---|---|---|---|---|
| A | 7190 | 5519 | 27 | 27 | 0.38% | 0.49% | 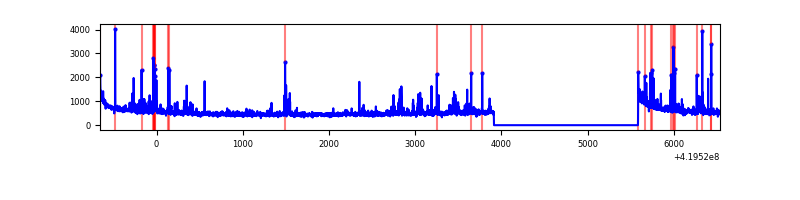 |
| B | 7190 | 5519 | 6 | 6 | 0.08% | 0.11% | 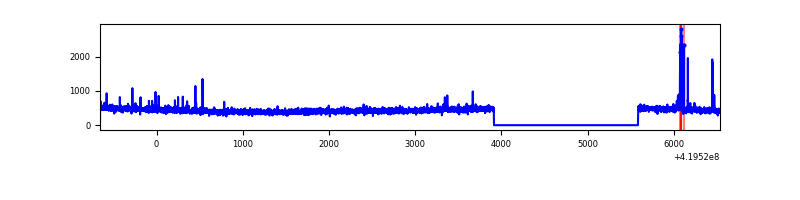 |
| C | 7190 | 5519 | 193 | 193 | 2.68% | 3.50% | 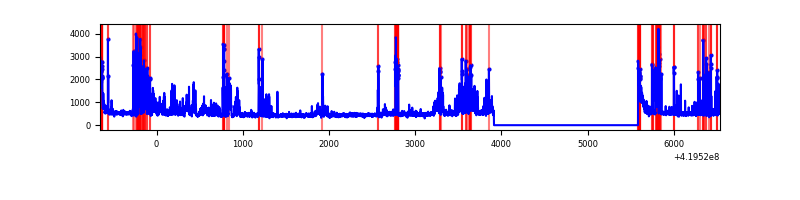 |
| D | 7190 | 5519 | 880 | 880 | 12.24% | 15.94% | 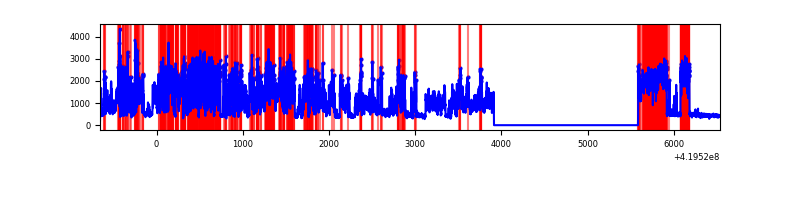 |
Top three noisy pixels from each quadrant. If the there are fewer than three noisy pixels in the level2.evt file, extra rows are filled as -1
| Pixel properties | Quadrant properties | ||||||
|---|---|---|---|---|---|---|---|
| Quadrant | DetID | PixID | Counts | Sigma | Mean | Median | Sigma |
| A | 10 | 83 | 519738 | 4173.19 | 602 | 590 | 124.4 |
| A | 13 | 248 | 259798 | 2083.65 | 602 | 590 | 124.4 |
| A | 12 | 189 | 51799 | 411.65 | 602 | 590 | 124.4 |
| B | 4 | 171 | 62632 | 532.94 | 597 | 580 | 116.4 |
| B | 12 | 111 | 14561 | 120.08 | 597 | 580 | 116.4 |
| B | 11 | 111 | 13434 | 110.4 | 597 | 580 | 116.4 |
| C | 14 | 254 | 999211 | 7361.91 | 580 | 583 | 135.6 |
| C | 15 | 214 | 230044 | 1691.59 | 580 | 583 | 135.6 |
| C | 0 | 10 | 143966 | 1057.02 | 580 | 583 | 135.6 |
| D | 12 | 79 | 3777563 | 27082.58 | 566 | 551 | 139.5 |
| D | 13 | 249 | 348804 | 2497.1 | 566 | 551 | 139.5 |
| D | 12 | 16 | 144544 | 1032.48 | 566 | 551 | 139.5 |
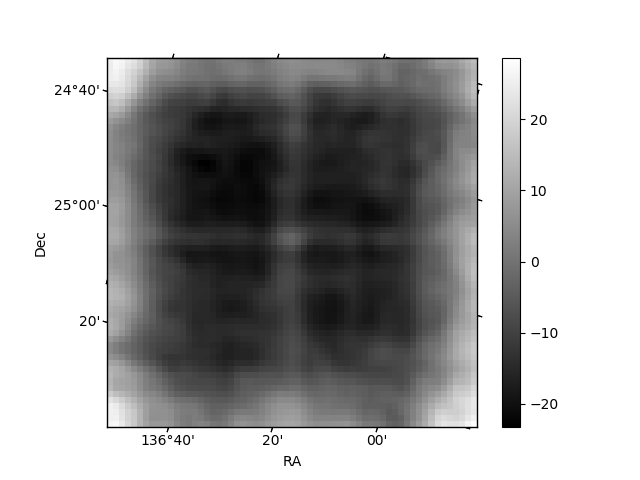
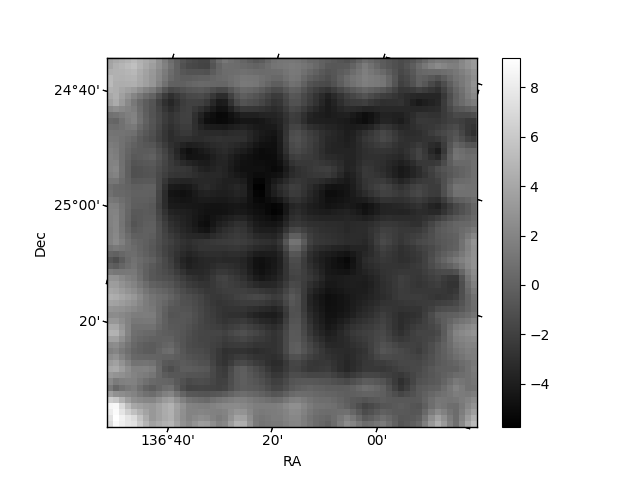
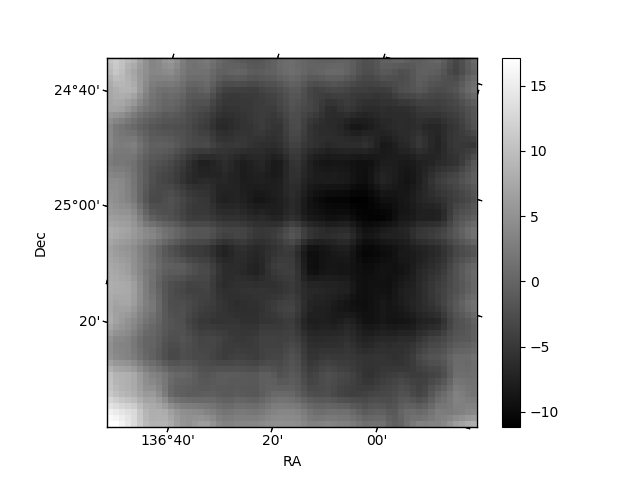
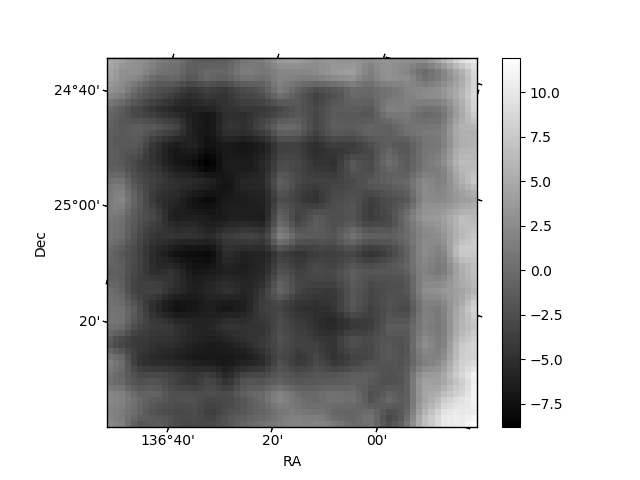
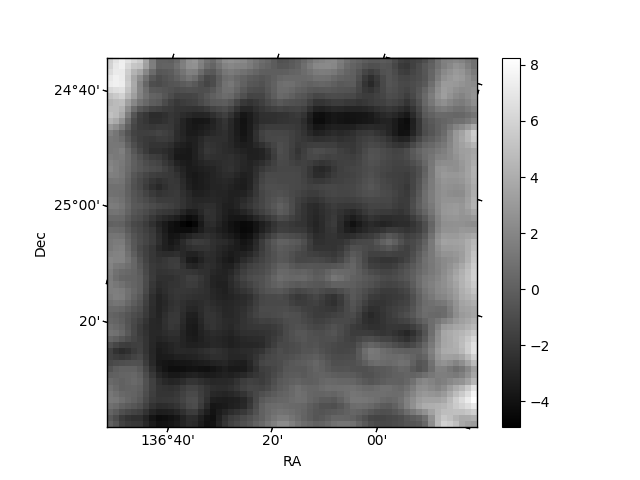
Histogram calculated using DETX and DETY for each event in the final _common_clean file
| Quadrant A | 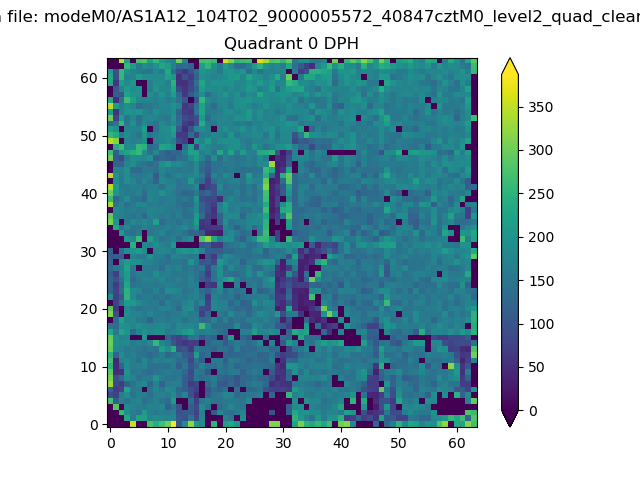 |
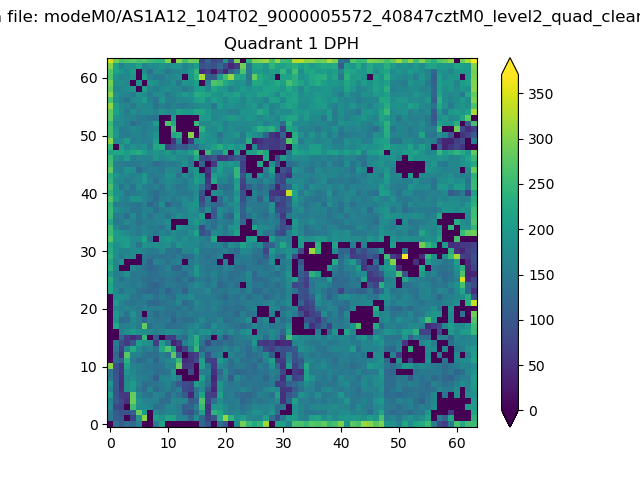 |
Quadrant B |
|---|---|---|---|
| Quadrant D | 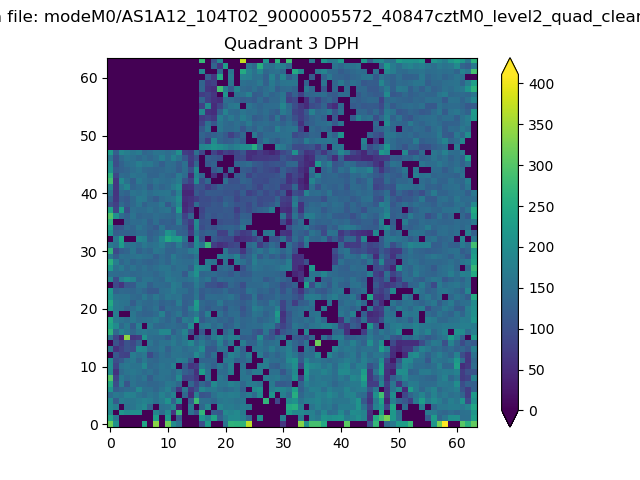 |
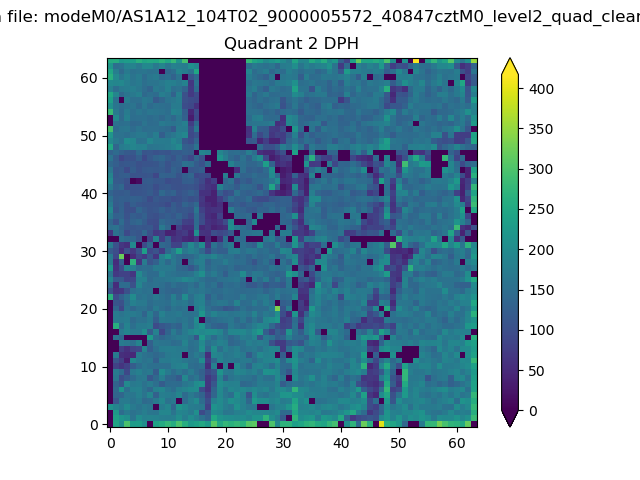 |
Quadrant C |
| Plot type | Count rate plots | Images |
|---|---|---|
| Comparison with Poisson distribution Blue bars denote a histogram of data divided into 1 sec bins. Red curve is a Poisson curve with rate = median count rate of data. |
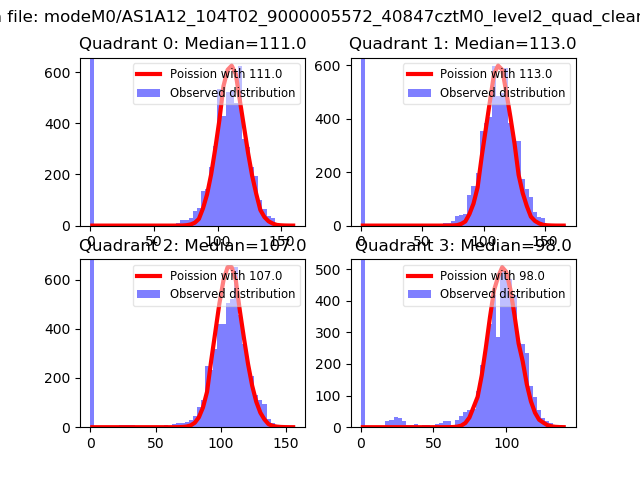 |
 |
| Quadrant-wise count rates Data is divided into 100 sec bins |
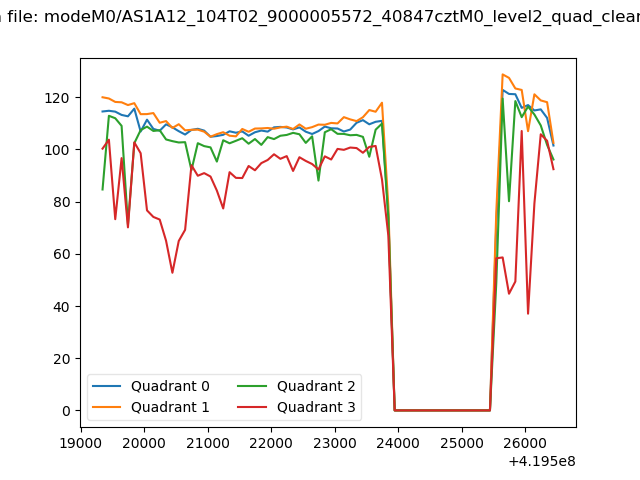 |
|
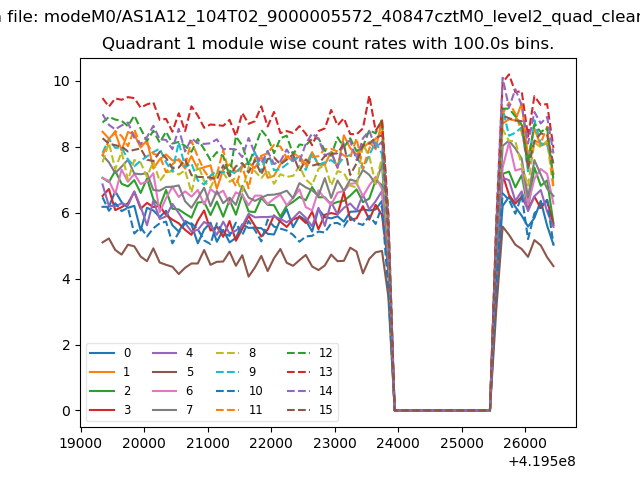
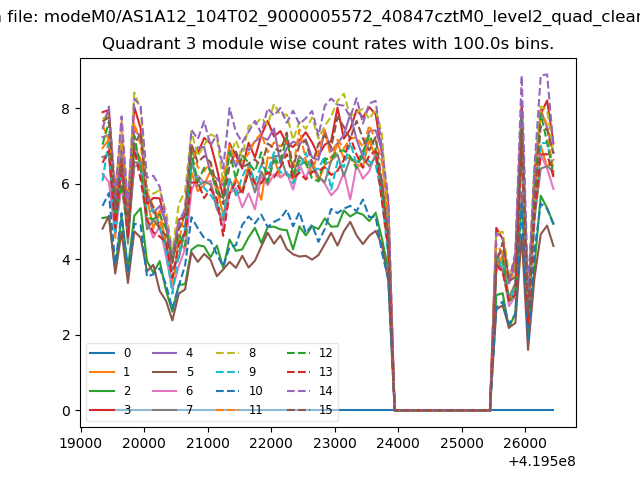
| Module-wise count rates for Quadrant A Data is divided into 100 sec bins |
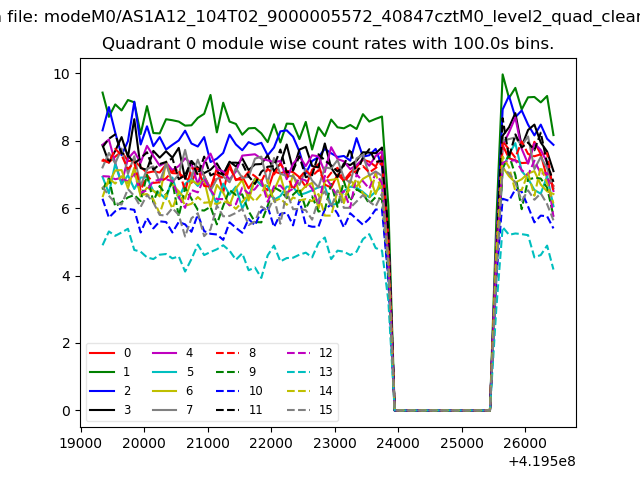 |
 |
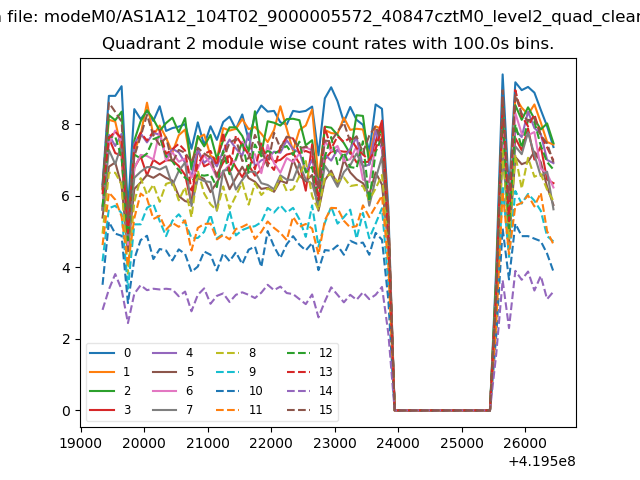
| Module-wise count rates for Quadrant B Data is divided into 100 sec bins |
 |
 |
| Module-wise count rates for Quadrant C Data is divided into 100 sec bins |
 |
 |
| Module-wise count rates for Quadrant D Data is divided into 100 sec bins |
 |
 |
| Parameter | Plot |
|---|---|
| CZT HV Monitor | 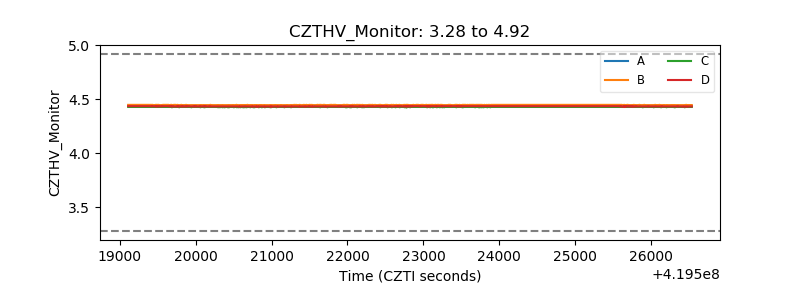 |
| D_VDD | 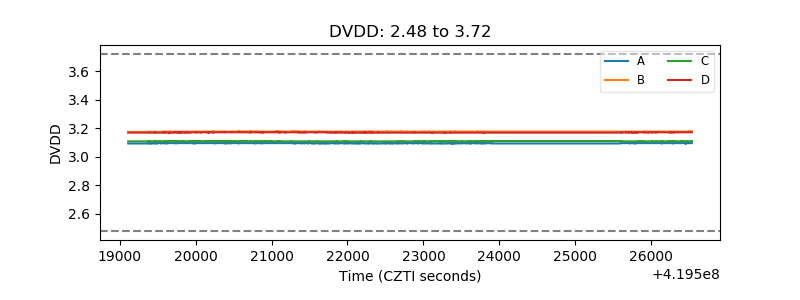 |
| Temperature 1 | 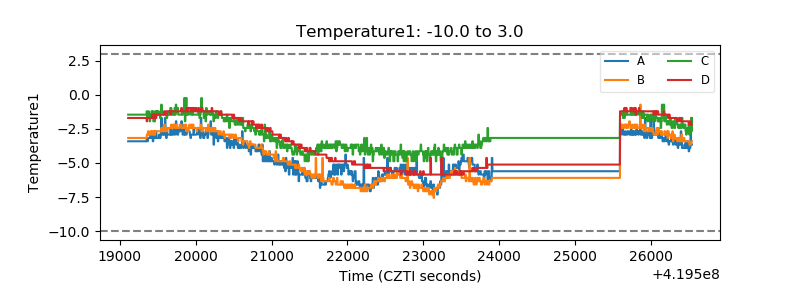 |
| Veto HV Monitor | 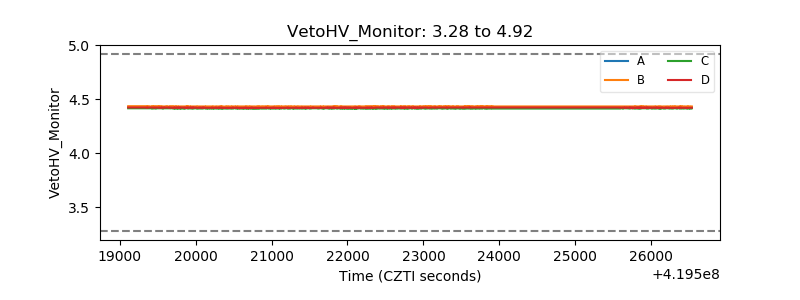 |
| Veto LLD | 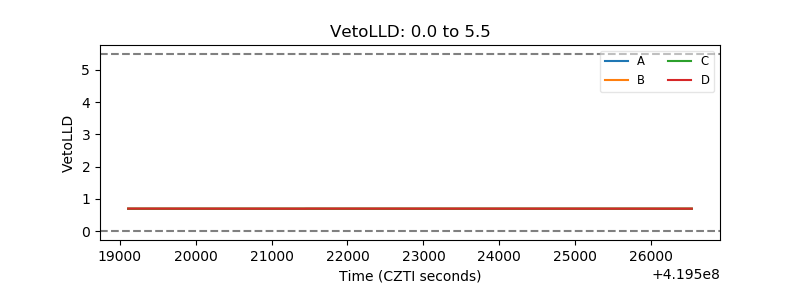 |
| Alpha Counter |  |
| _CPM_Rate |  |
| CZT Counter | 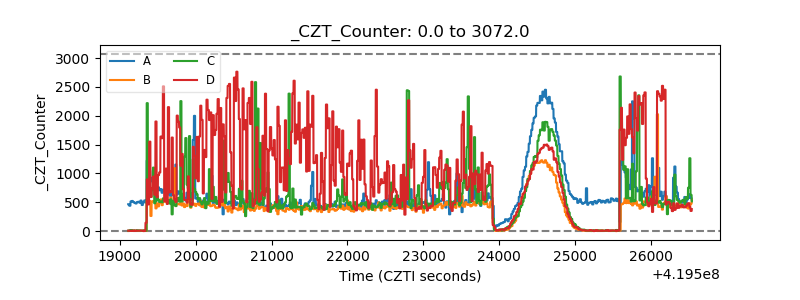 |
| +2.5 Volts monitor |  |
| +5 Volts monitor |  |
| _ROLL_ROT | 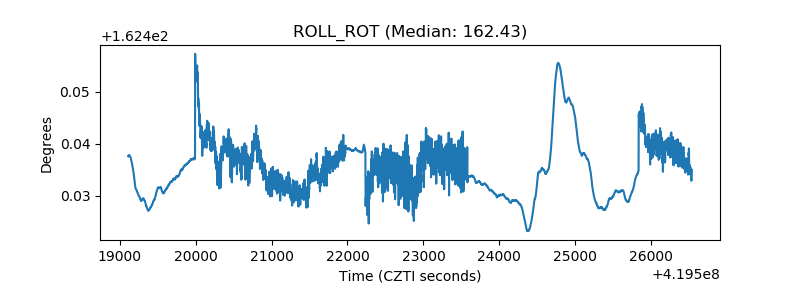 |
| _Roll_DEC | 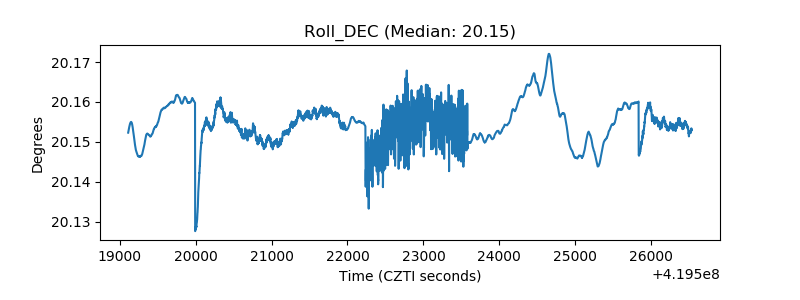 |
| _Roll_RA | 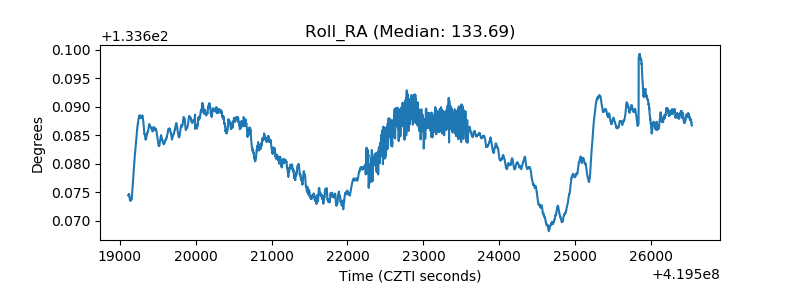 |
| Veto Counter | 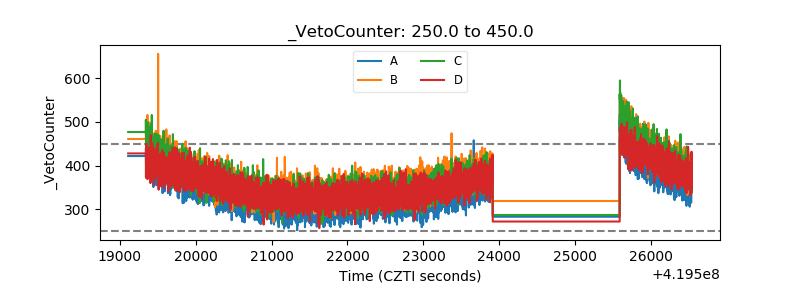 |