| Param | Original file | Final file |
|---|---|---|
| Filename | modeM0/AS1A12_104T02_9000005572_40849cztM0_level2.fits | modeM0/AS1A12_104T02_9000005572_40849cztM0_level2_quad_clean.evt |
| Size (bytes) | 430,024,320 | 85,314,240 |
| Size | 410.1 MB | 81.4 MB |
| Events in quadrant A | 3,006,188 | 596,581 |
| Events in quadrant B | 2,355,934 | 610,020 |
| Events in quadrant C | 2,948,594 | 569,362 |
| Events in quadrant D | 7,199,571 | 439,601 |
| Mode M9 | |||
|---|---|---|---|
| Quadrant | BADHDUFLAG | Total packets | Discarded packets |
| A | 0 | 21 | 0 |
| B | 0 | 21 | 0 |
| C | 0 | 21 | 0 |
| D | 0 | 22 | 0 |
| Mode M0 | |||
|---|---|---|---|
| Quadrant | BADHDUFLAG | Total packets | Discarded packets |
| A | 0 | 12258 | 3 |
| B | 0 | 10743 | 2 |
| C | 0 | 12081 | 2 |
| D | 0 | 25052 | 2 |
| Mode SS | |||
|---|---|---|---|
| Quadrant | BADHDUFLAG | Total packets | Discarded packets |
| A | 0 | 108 | 0 |
| B | 0 | 108 | 0 |
| C | 0 | 108 | 0 |
| D | 0 | 108 | 0 |
| Quadrant | Total seconds | Saturated seconds | Saturation percentage |
|---|---|---|---|
| A | 5245 | 46 | 0.877026% |
| B | 5245 | 27 | 0.514776% |
| C | 5245 | 133 | 2.535748% |
| D | 5245 | 1173 | 22.364156% |
Noise dominated data is calculated using 1-second bins in cleaned event files. If a bin has >2000 counts, and if more than 50% of those come from <1% of pixels, then it is considered to be noise-dominated and hence unusable.
| Quadrant | # 1 sec bins | Bins with >0 counts | Bins with >2000 counts | High rate bins dominated by noise | Noise dominated (total time) | Noise dominated (detector-on time) | Marked lightcurve |
|---|---|---|---|---|---|---|---|
| A | 7067 | 5246 | 27 | 27 | 0.38% | 0.51% | 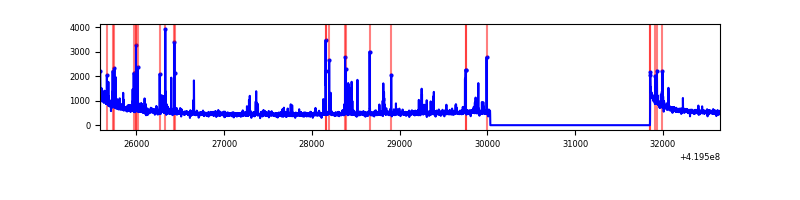 |
| B | 7067 | 5246 | 8 | 8 | 0.11% | 0.15% | 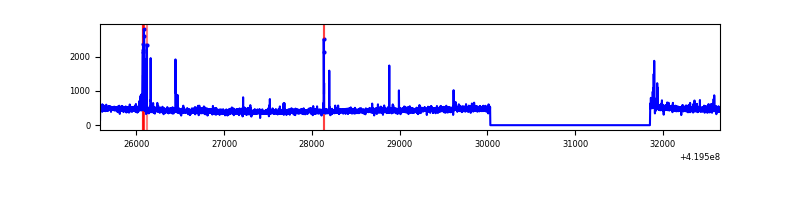 |
| C | 7067 | 5246 | 99 | 99 | 1.40% | 1.89% | 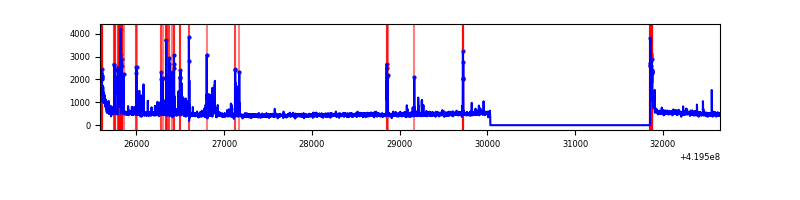 |
| D | 7067 | 5246 | 1445 | 1445 | 20.45% | 27.54% | 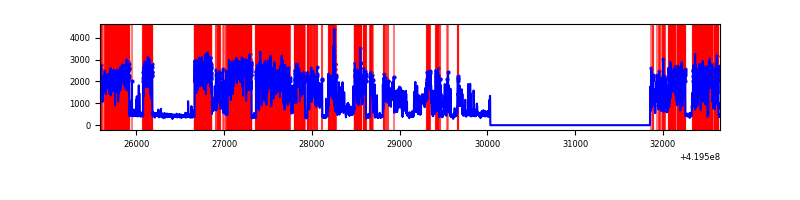 |
Top three noisy pixels from each quadrant. If the there are fewer than three noisy pixels in the level2.evt file, extra rows are filled as -1
| Pixel properties | Quadrant properties | ||||||
|---|---|---|---|---|---|---|---|
| Quadrant | DetID | PixID | Counts | Sigma | Mean | Median | Sigma |
| A | 10 | 83 | 504459 | 4204.71 | 576 | 564 | 119.8 |
| A | 13 | 248 | 229477 | 1910.14 | 576 | 564 | 119.8 |
| A | 12 | 189 | 35151 | 288.61 | 576 | 564 | 119.8 |
| B | 4 | 171 | 66726 | 595.76 | 573 | 557 | 111.1 |
| B | 0 | 190 | 30155 | 266.49 | 573 | 557 | 111.1 |
| B | 12 | 111 | 13681 | 118.16 | 573 | 557 | 111.1 |
| C | 14 | 254 | 368566 | 2823.06 | 558 | 563 | 130.4 |
| C | 15 | 214 | 221081 | 1691.66 | 558 | 563 | 130.4 |
| C | 0 | 10 | 139458 | 1065.5 | 558 | 563 | 130.4 |
| D | 12 | 79 | 4833444 | 36251.96 | 534 | 517 | 133.3 |
| D | 13 | 249 | 123422 | 921.91 | 534 | 517 | 133.3 |
| D | 12 | 16 | 54446 | 404.52 | 534 | 517 | 133.3 |
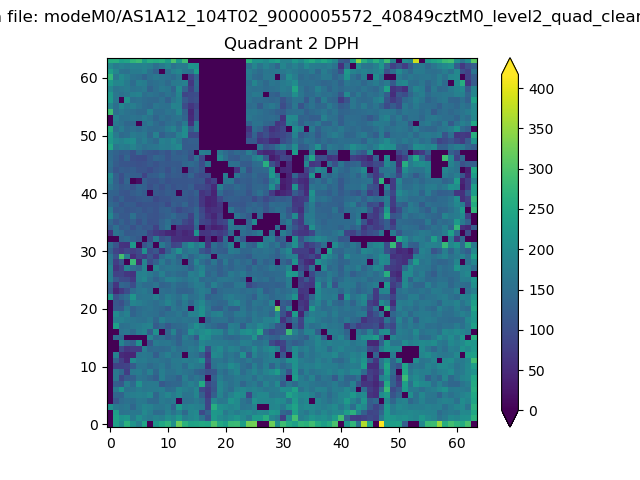
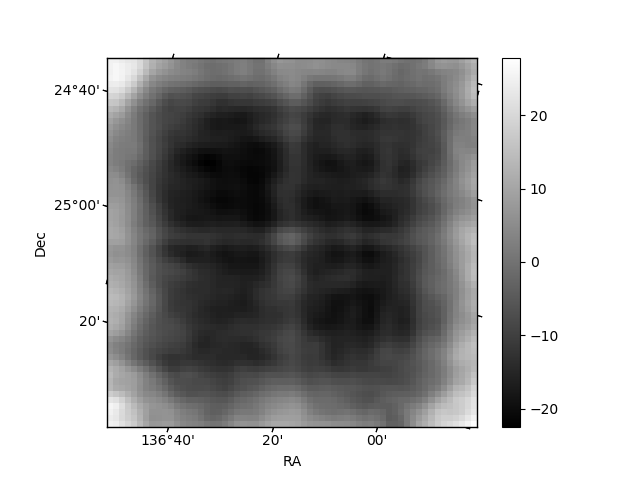
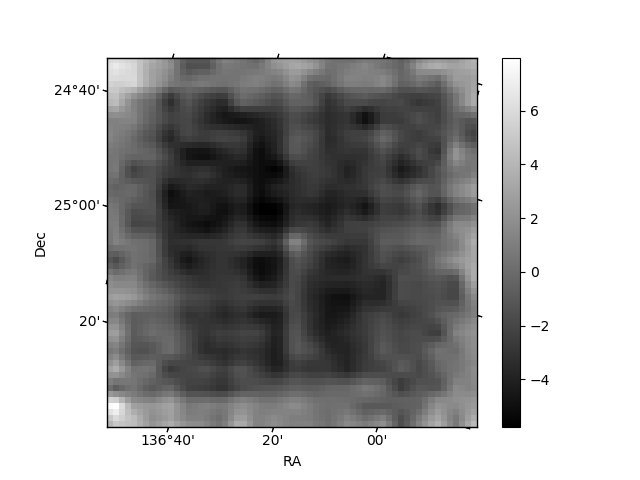
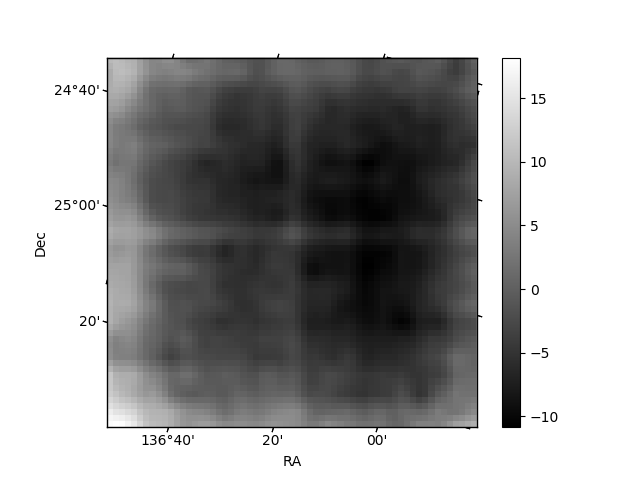
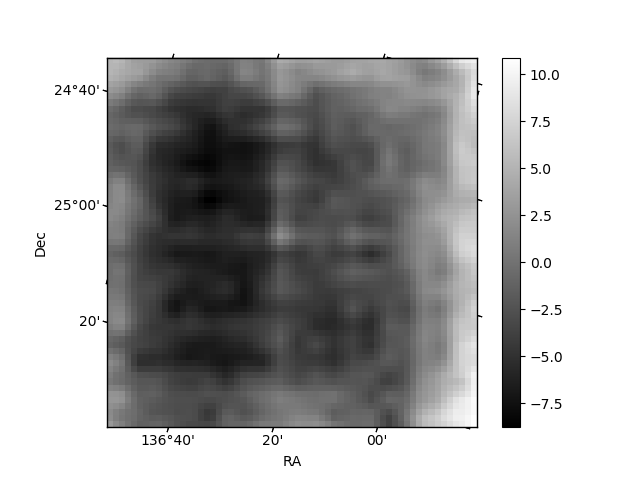
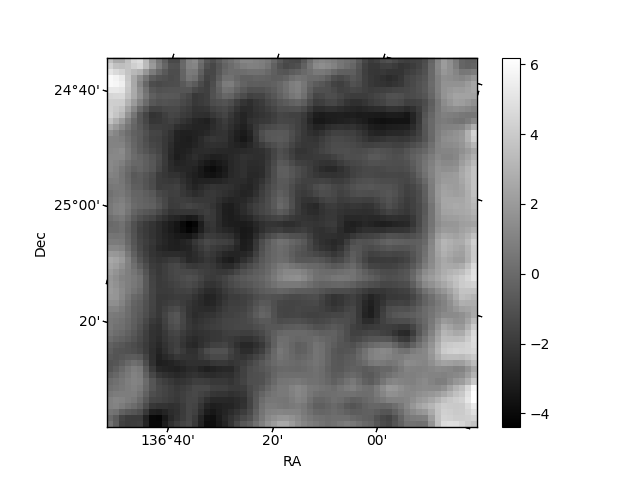
Histogram calculated using DETX and DETY for each event in the final _common_clean file
| Quadrant A | 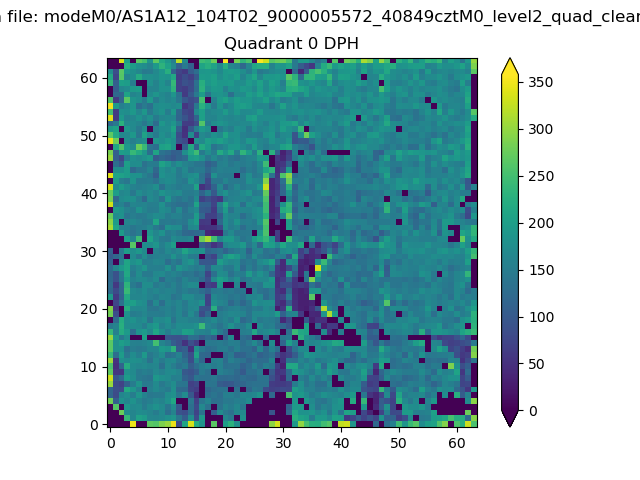 |
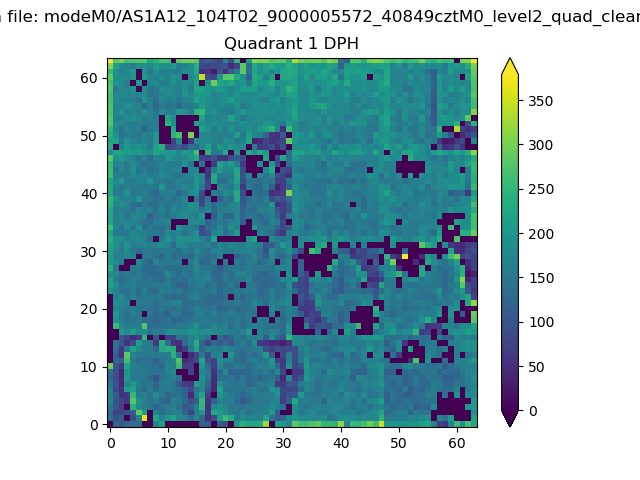 |
Quadrant B |
|---|---|---|---|
| Quadrant D | 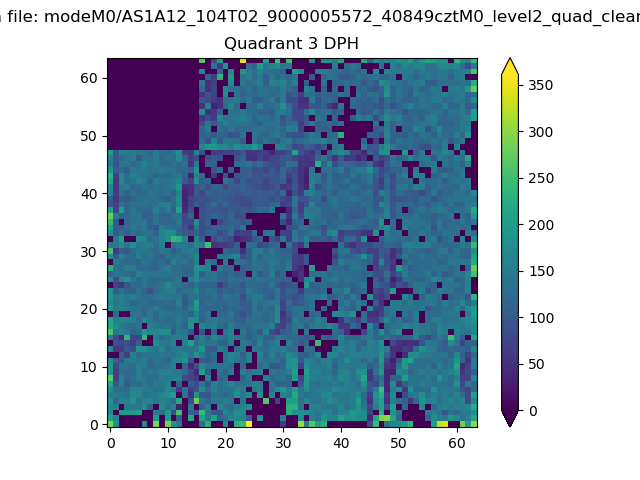 |
 |
Quadrant C |
| Plot type | Count rate plots | Images |
|---|---|---|
| Comparison with Poisson distribution Blue bars denote a histogram of data divided into 1 sec bins. Red curve is a Poisson curve with rate = median count rate of data. |
 |
 |
| Quadrant-wise count rates Data is divided into 100 sec bins |
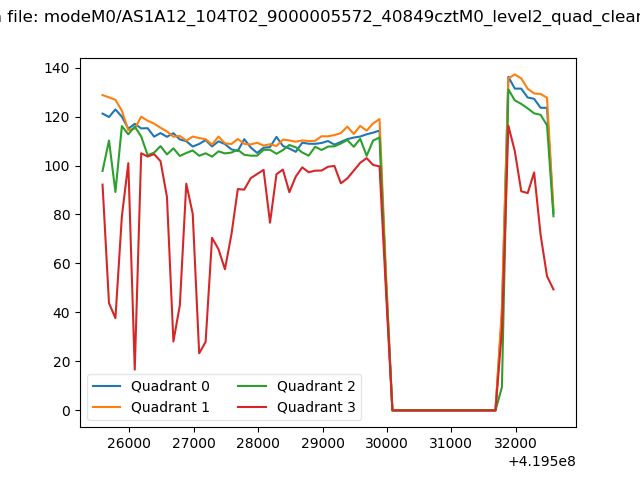 |
|
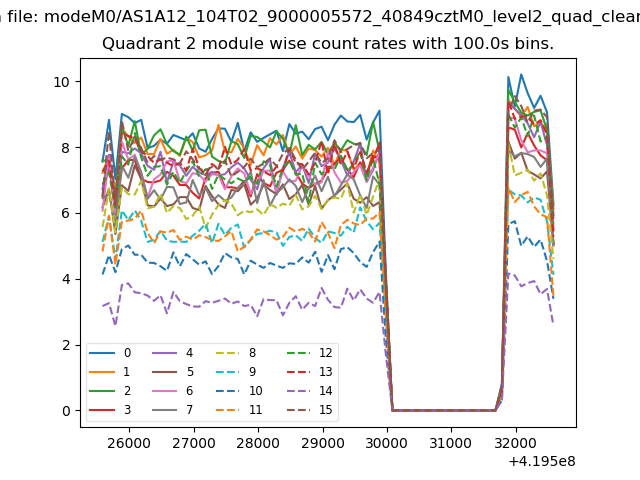
| Module-wise count rates for Quadrant A Data is divided into 100 sec bins |
 |
 |
| Module-wise count rates for Quadrant B Data is divided into 100 sec bins |
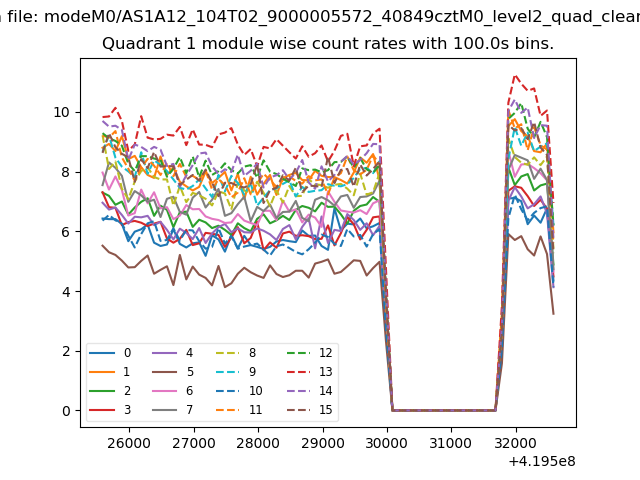 |
 |
| Module-wise count rates for Quadrant C Data is divided into 100 sec bins |
 |
 |
| Module-wise count rates for Quadrant D Data is divided into 100 sec bins |
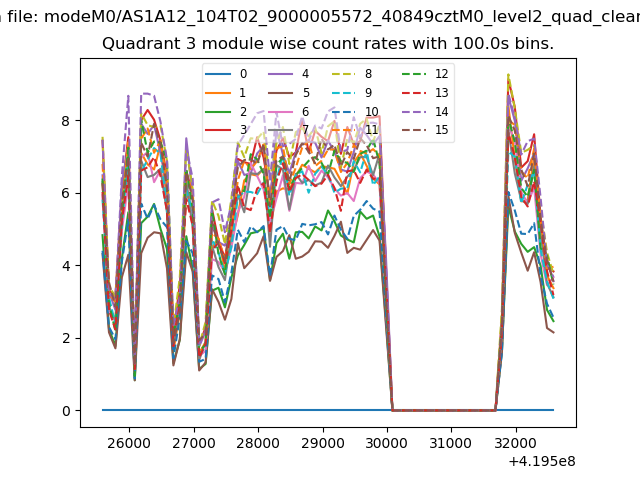 |
 |
| Parameter | Plot |
|---|---|
| CZT HV Monitor | 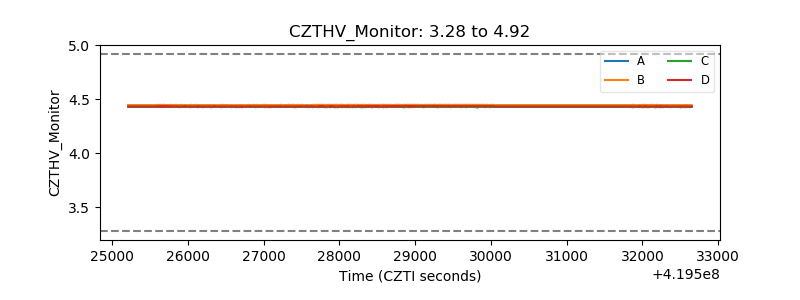 |
| D_VDD | 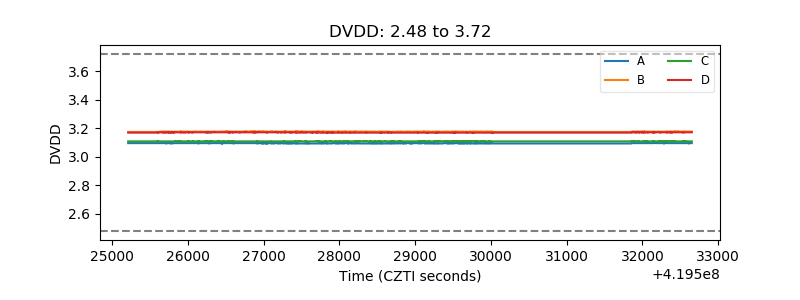 |
| Temperature 1 | 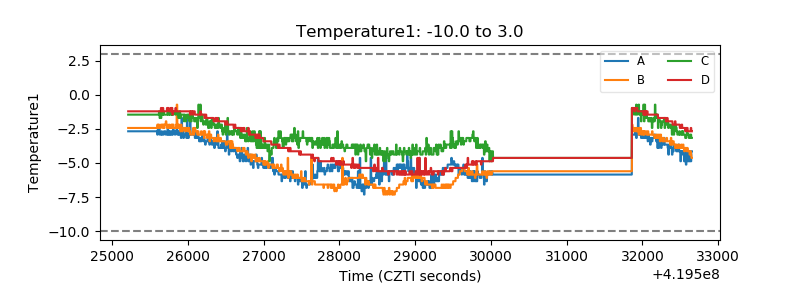 |
| Veto HV Monitor | 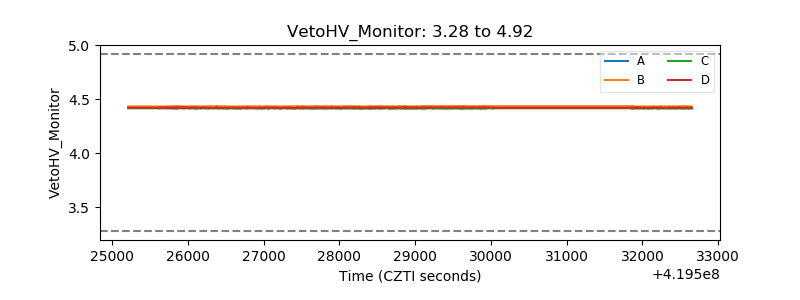 |
| Veto LLD | 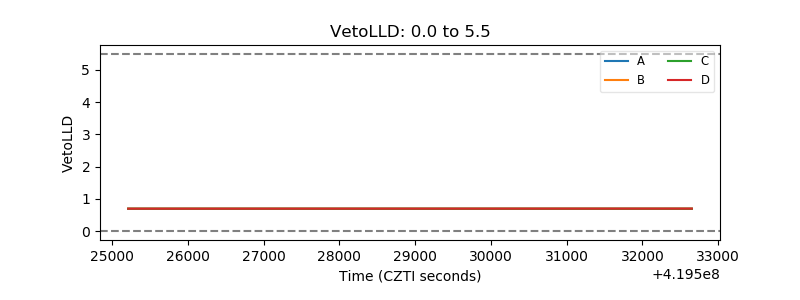 |
| Alpha Counter |  |
| _CPM_Rate |  |
| CZT Counter | 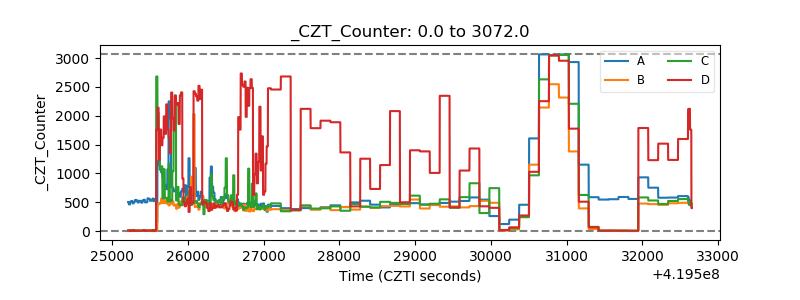 |
| +2.5 Volts monitor | 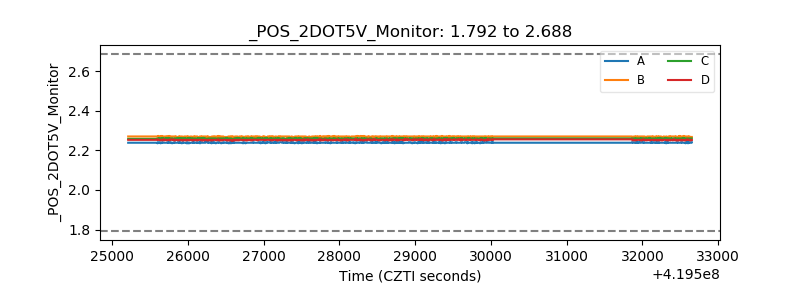 |
| +5 Volts monitor |  |
| _ROLL_ROT | 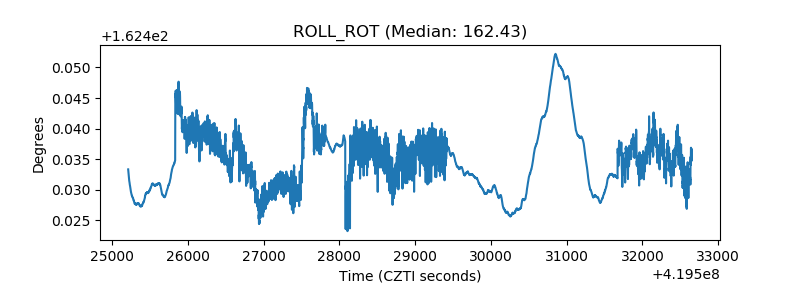 |
| _Roll_DEC | 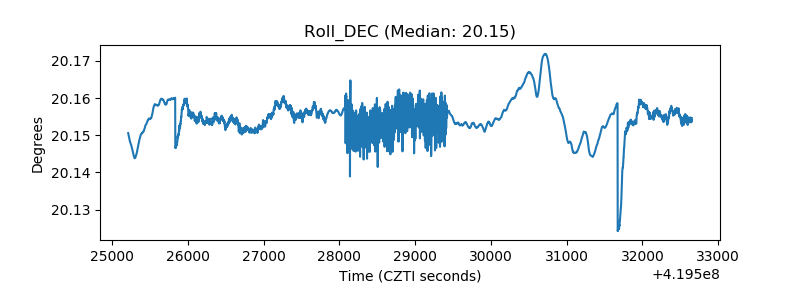 |
| _Roll_RA | 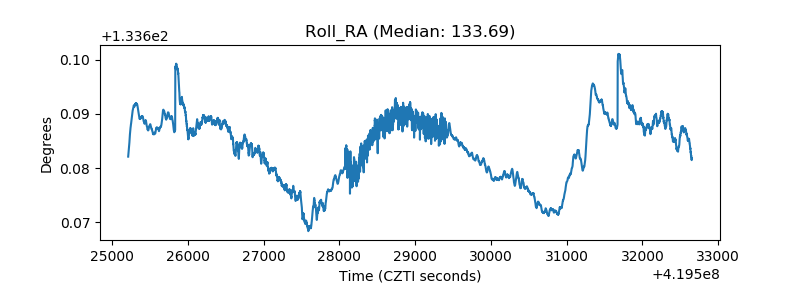 |
| Veto Counter | 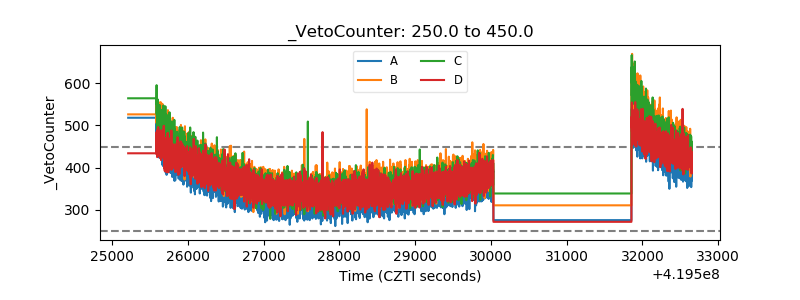 |