| Param | Original file | Final file |
|---|---|---|
| Filename | modeM0/AS1A12_104T02_9000005572_40850cztM0_level2.fits | modeM0/AS1A12_104T02_9000005572_40850cztM0_level2_quad_clean.evt |
| Size (bytes) | 387,748,800 | 88,836,480 |
| Size | 369.8 MB | 84.7 MB |
| Events in quadrant A | 2,811,440 | 615,391 |
| Events in quadrant B | 2,457,026 | 634,151 |
| Events in quadrant C | 2,745,035 | 591,169 |
| Events in quadrant D | 5,936,449 | 486,421 |
| Mode M9 | |||
|---|---|---|---|
| Quadrant | BADHDUFLAG | Total packets | Discarded packets |
| A | 0 | 24 | 0 |
| B | 0 | 24 | 0 |
| C | 0 | 24 | 0 |
| D | 0 | 25 | 0 |
| Mode M0 | |||
|---|---|---|---|
| Quadrant | BADHDUFLAG | Total packets | Discarded packets |
| A | 0 | 11514 | 3 |
| B | 0 | 10684 | 2 |
| C | 0 | 11354 | 2 |
| D | 0 | 21270 | 2 |
| Mode SS | |||
|---|---|---|---|
| Quadrant | BADHDUFLAG | Total packets | Discarded packets |
| A | 0 | 104 | 0 |
| B | 0 | 104 | 0 |
| C | 0 | 104 | 0 |
| D | 0 | 104 | 0 |
| Quadrant | Total seconds | Saturated seconds | Saturation percentage |
|---|---|---|---|
| A | 5184 | 17 | 0.327932% |
| B | 5184 | 12 | 0.231481% |
| C | 5184 | 76 | 1.466049% |
| D | 5184 | 785 | 15.142747% |
Noise dominated data is calculated using 1-second bins in cleaned event files. If a bin has >2000 counts, and if more than 50% of those come from <1% of pixels, then it is considered to be noise-dominated and hence unusable.
| Quadrant | # 1 sec bins | Bins with >0 counts | Bins with >2000 counts | High rate bins dominated by noise | Noise dominated (total time) | Noise dominated (detector-on time) | Marked lightcurve |
|---|---|---|---|---|---|---|---|
| A | 7128 | 5186 | 10 | 10 | 0.14% | 0.19% | 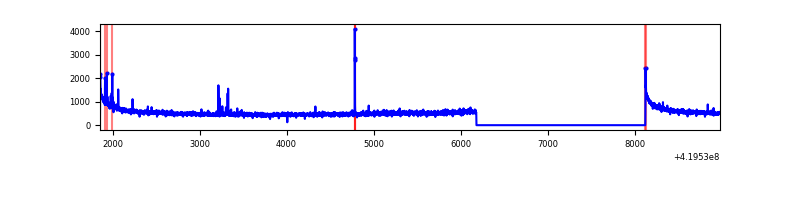 |
| B | 7128 | 5186 | 3 | 3 | 0.04% | 0.06% | 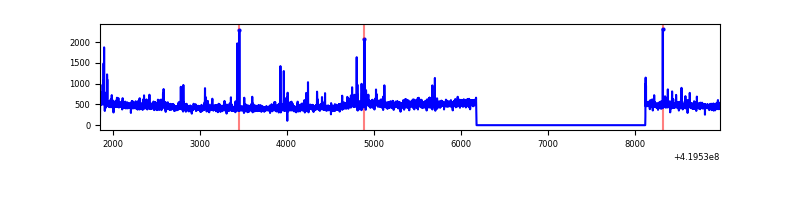 |
| C | 7128 | 5186 | 64 | 64 | 0.90% | 1.23% | 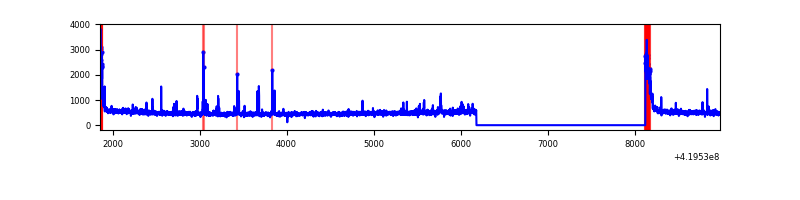 |
| D | 7128 | 5186 | 891 | 891 | 12.50% | 17.18% | 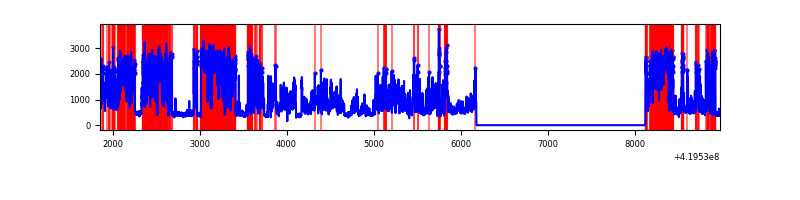 |
Top three noisy pixels from each quadrant. If the there are fewer than three noisy pixels in the level2.evt file, extra rows are filled as -1
| Pixel properties | Quadrant properties | ||||||
|---|---|---|---|---|---|---|---|
| Quadrant | DetID | PixID | Counts | Sigma | Mean | Median | Sigma |
| A | 10 | 83 | 495545 | 4150.88 | 580 | 569 | 119.2 |
| A | 12 | 189 | 25569 | 209.65 | 580 | 569 | 119.2 |
| A | 13 | 248 | 24420 | 200.01 | 580 | 569 | 119.2 |
| B | 0 | 190 | 74729 | 665.67 | 581 | 565 | 111.4 |
| B | 7 | 202 | 68101 | 606.18 | 581 | 565 | 111.4 |
| B | 4 | 171 | 28090 | 247.05 | 581 | 565 | 111.4 |
| C | 15 | 214 | 221041 | 1679.46 | 566 | 571 | 131.3 |
| C | 0 | 10 | 180991 | 1374.37 | 566 | 571 | 131.3 |
| C | 14 | 254 | 99695 | 755.09 | 566 | 571 | 131.3 |
| D | 12 | 79 | 3395316 | 25465.13 | 545 | 529 | 133.3 |
| D | 13 | 249 | 260975 | 1953.67 | 545 | 529 | 133.3 |
| D | 2 | 249 | 81813 | 609.73 | 545 | 529 | 133.3 |
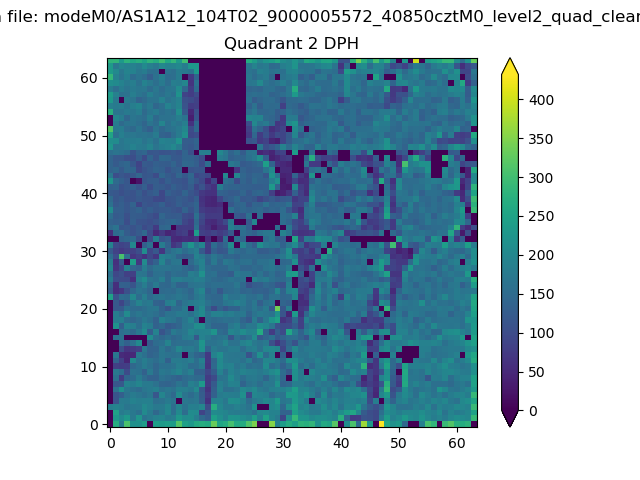
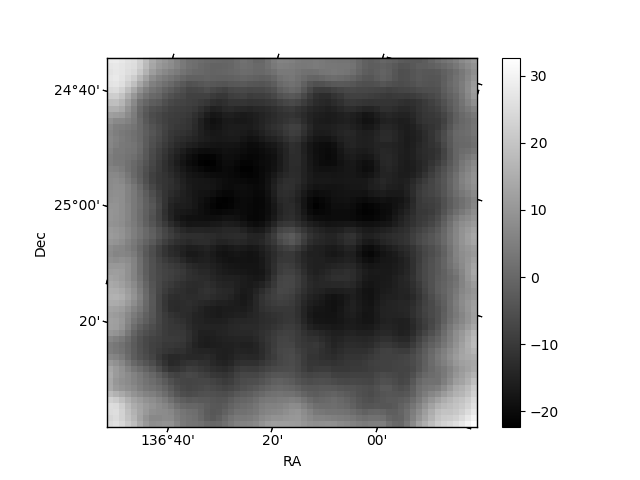
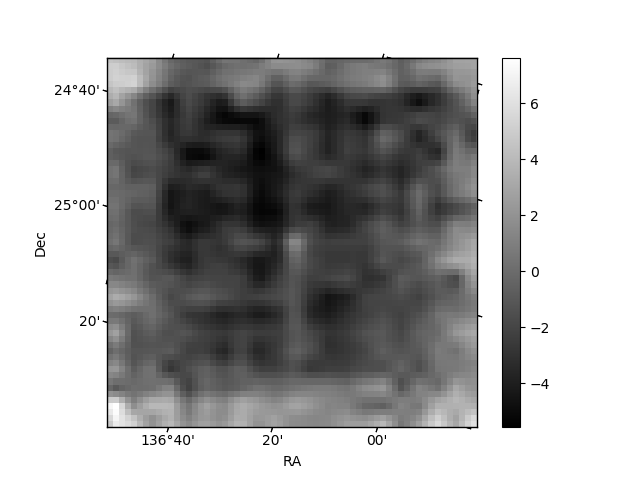
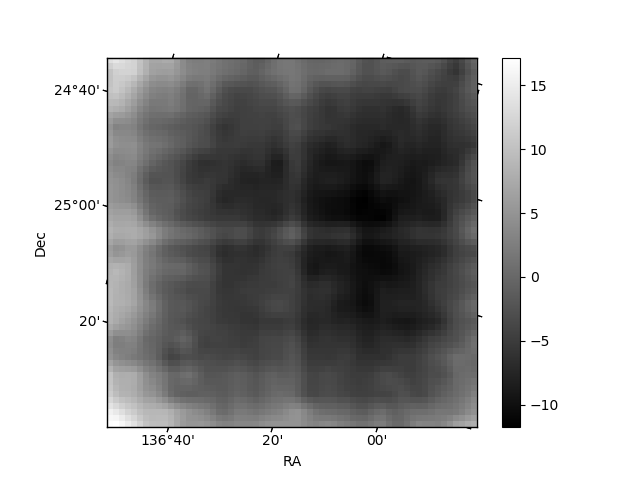
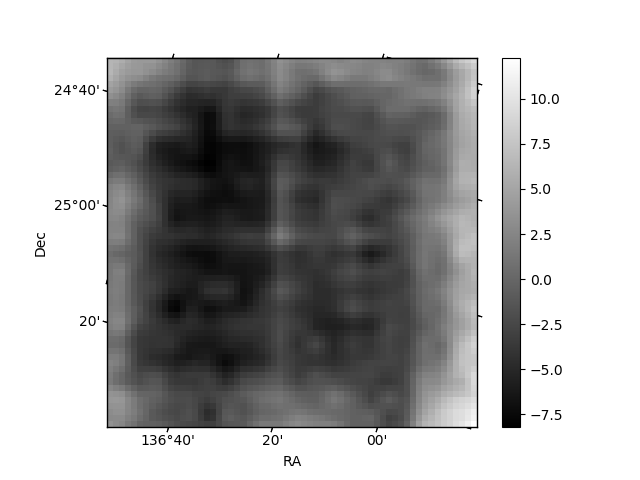
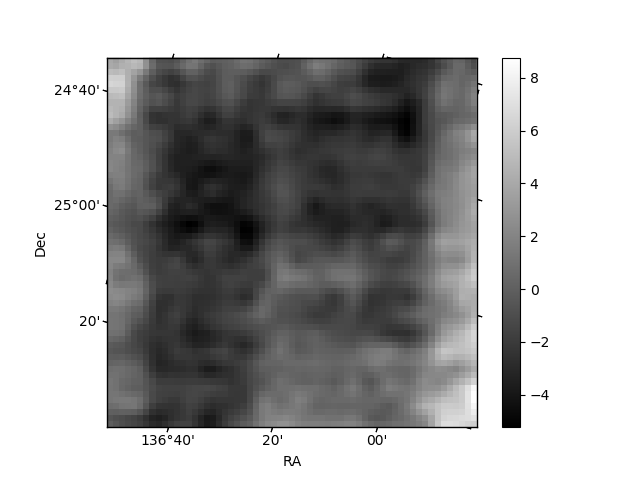
Histogram calculated using DETX and DETY for each event in the final _common_clean file
| Quadrant A | 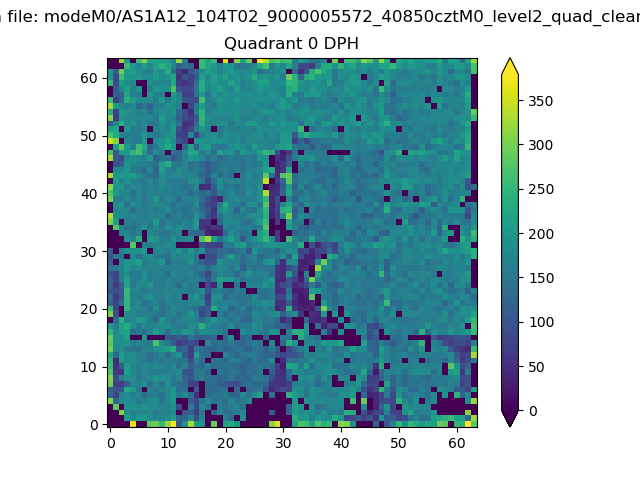 |
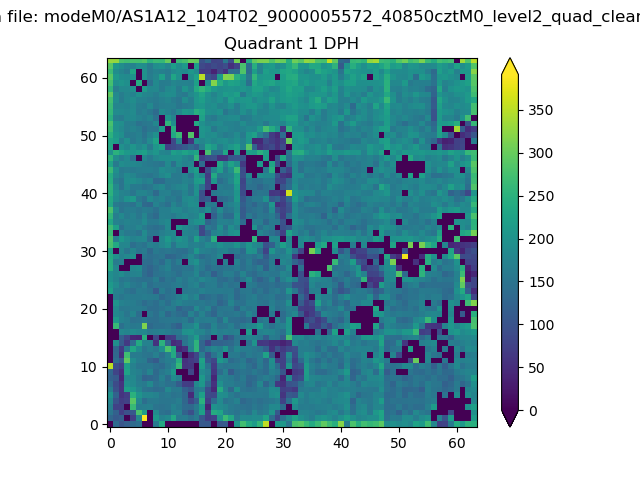 |
Quadrant B |
|---|---|---|---|
| Quadrant D | 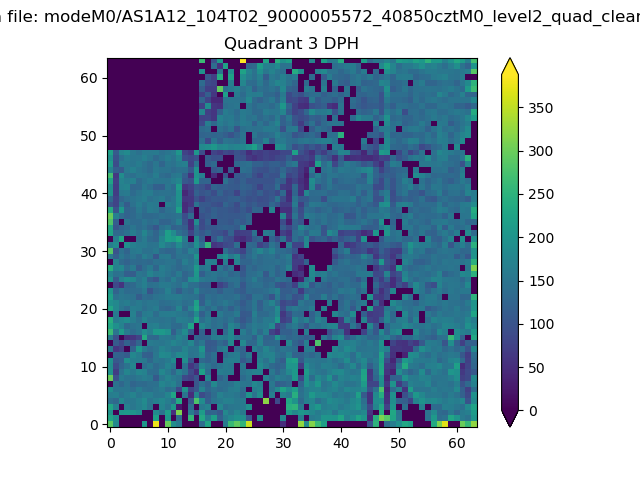 |
 |
Quadrant C |
| Plot type | Count rate plots | Images |
|---|---|---|
| Comparison with Poisson distribution Blue bars denote a histogram of data divided into 1 sec bins. Red curve is a Poisson curve with rate = median count rate of data. |
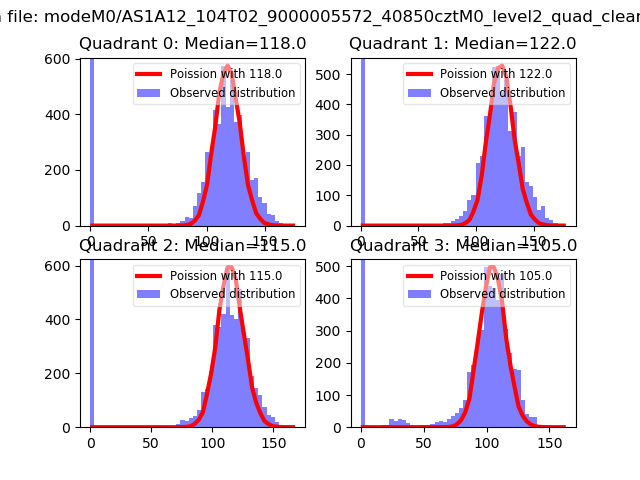 |
 |
| Quadrant-wise count rates Data is divided into 100 sec bins |
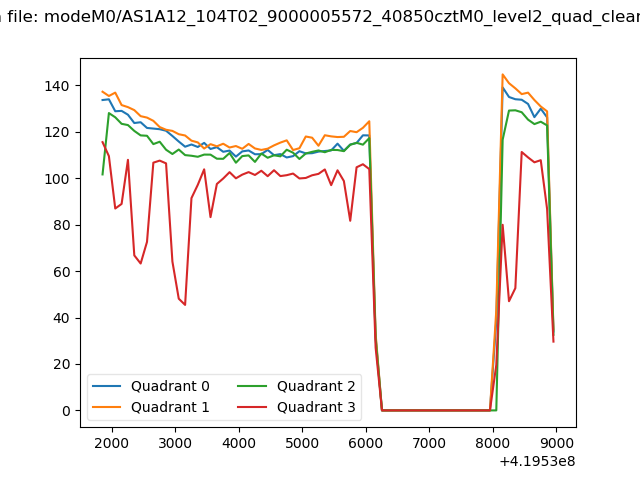 |
|
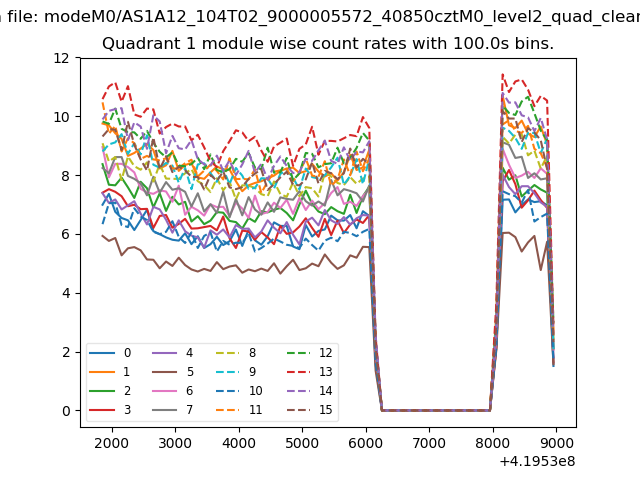
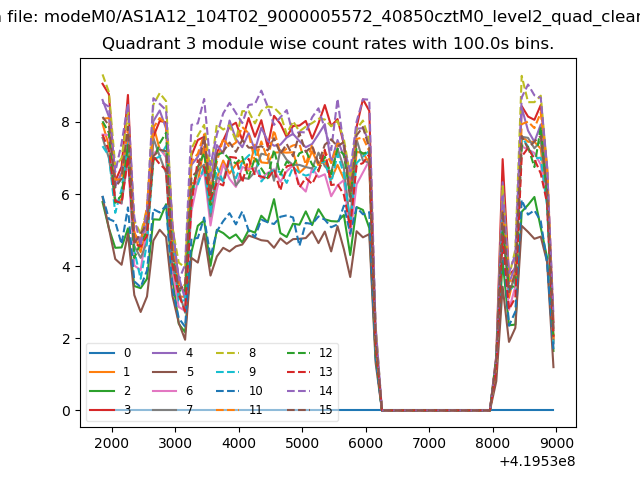
| Module-wise count rates for Quadrant A Data is divided into 100 sec bins |
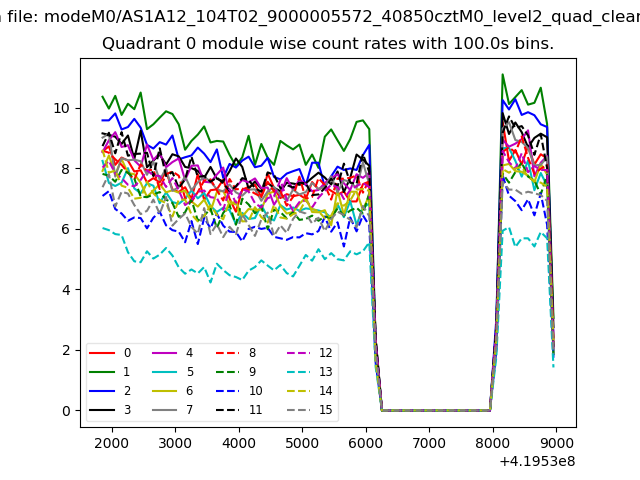 |
 |
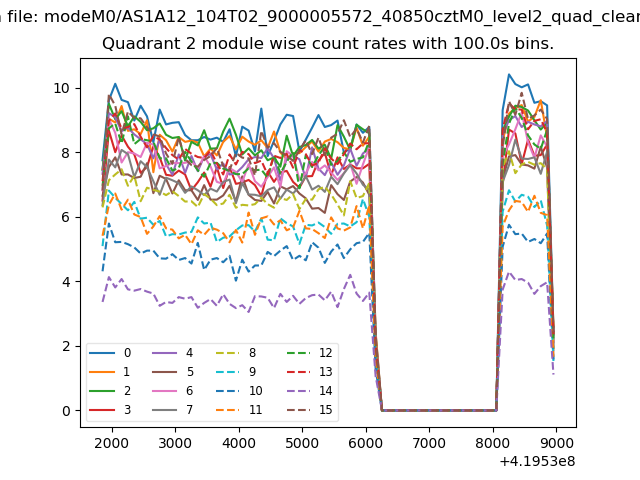
| Module-wise count rates for Quadrant B Data is divided into 100 sec bins |
 |
 |
| Module-wise count rates for Quadrant C Data is divided into 100 sec bins |
 |
 |
| Module-wise count rates for Quadrant D Data is divided into 100 sec bins |
 |
 |
| Parameter | Plot |
|---|---|
| CZT HV Monitor | 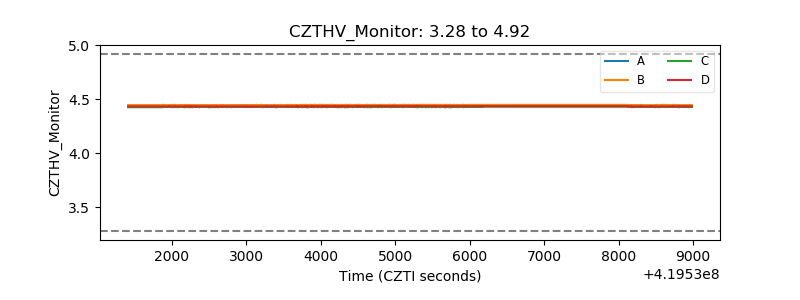 |
| D_VDD | 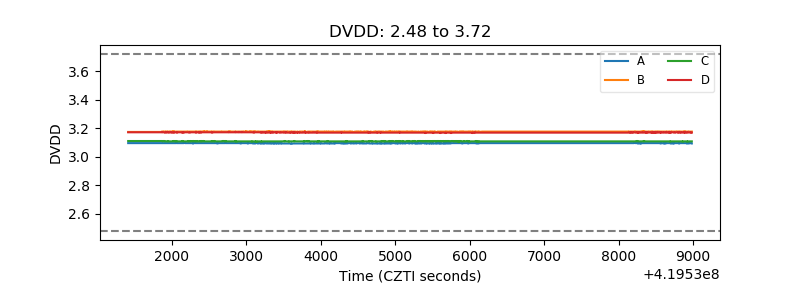 |
| Temperature 1 | 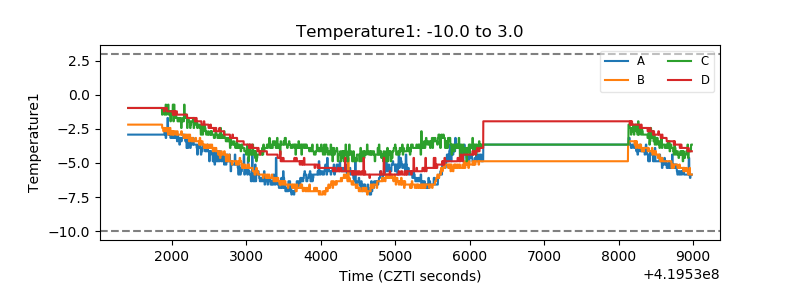 |
| Veto HV Monitor | 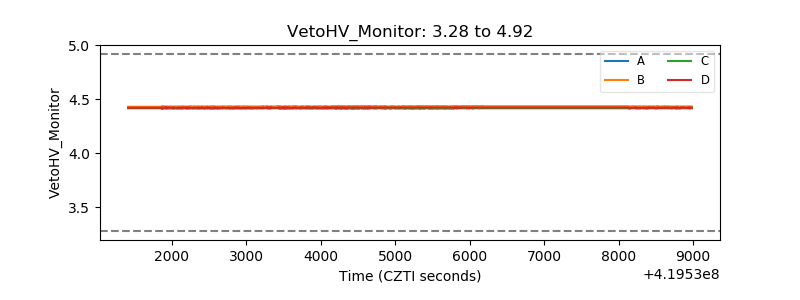 |
| Veto LLD | 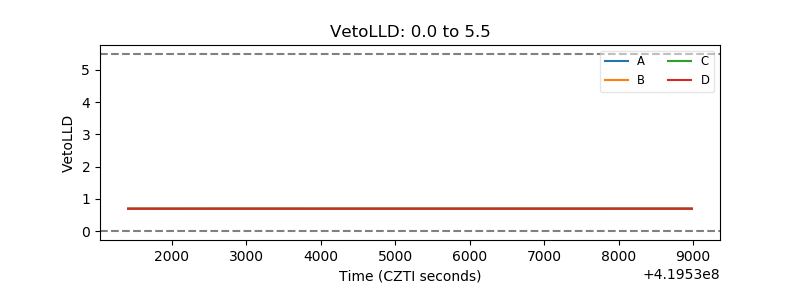 |
| Alpha Counter | 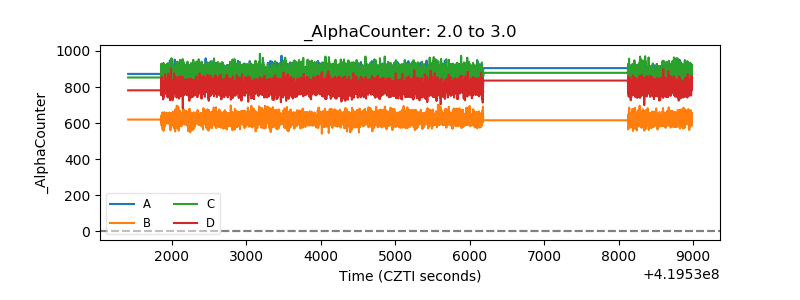 |
| _CPM_Rate | 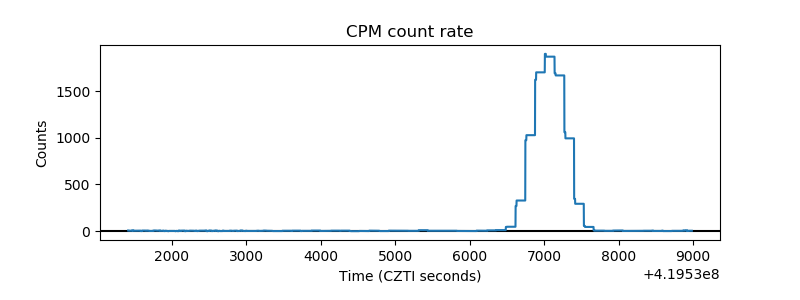 |
| CZT Counter | 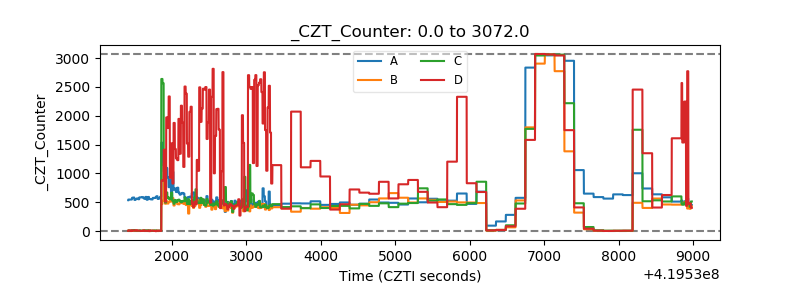 |
| +2.5 Volts monitor |  |
| +5 Volts monitor |  |
| _ROLL_ROT | 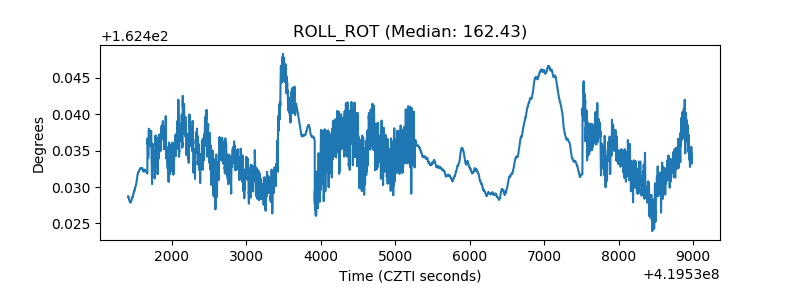 |
| _Roll_DEC | 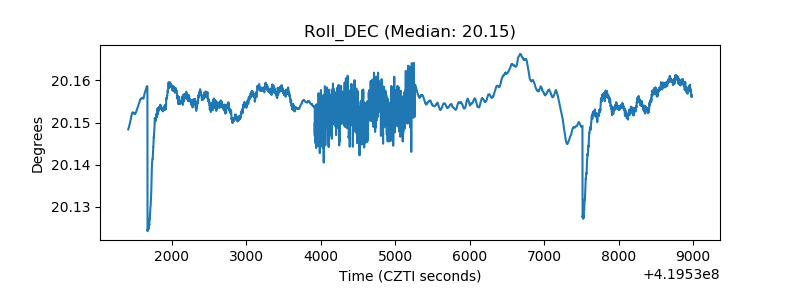 |
| _Roll_RA | 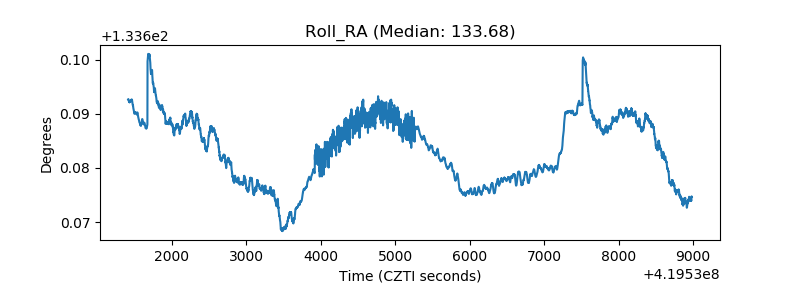 |
| Veto Counter | 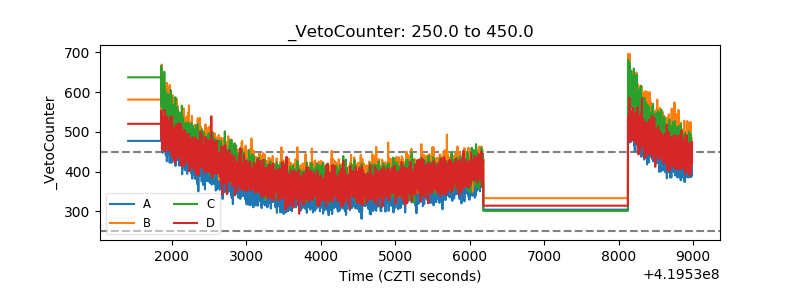 |