| Param | Original file | Final file |
|---|---|---|
| Filename | modeM0/AS1A12_104T02_9000005572_40851cztM0_level2.fits | modeM0/AS1A12_104T02_9000005572_40851cztM0_level2_quad_clean.evt |
| Size (bytes) | 384,050,880 | 87,212,160 |
| Size | 366.3 MB | 83.2 MB |
| Events in quadrant A | 2,831,477 | 606,584 |
| Events in quadrant B | 2,545,525 | 630,196 |
| Events in quadrant C | 2,909,044 | 583,618 |
| Events in quadrant D | 5,539,451 | 468,579 |
| Mode M9 | |||
|---|---|---|---|
| Quadrant | BADHDUFLAG | Total packets | Discarded packets |
| A | 0 | 35 | 0 |
| B | 0 | 35 | 0 |
| C | 0 | 35 | 0 |
| D | 0 | 36 | 0 |
| Mode M0 | |||
|---|---|---|---|
| Quadrant | BADHDUFLAG | Total packets | Discarded packets |
| A | 0 | 11459 | 3 |
| B | 0 | 10874 | 2 |
| C | 0 | 11785 | 2 |
| D | 0 | 19963 | 2 |
| Mode SS | |||
|---|---|---|---|
| Quadrant | BADHDUFLAG | Total packets | Discarded packets |
| A | 0 | 102 | 0 |
| B | 0 | 102 | 0 |
| C | 0 | 102 | 0 |
| D | 0 | 102 | 0 |
| Quadrant | Total seconds | Saturated seconds | Saturation percentage |
|---|---|---|---|
| A | 5022 | 35 | 0.696933% |
| B | 5022 | 14 | 0.278773% |
| C | 5022 | 104 | 2.070888% |
| D | 5022 | 790 | 15.730785% |
Noise dominated data is calculated using 1-second bins in cleaned event files. If a bin has >2000 counts, and if more than 50% of those come from <1% of pixels, then it is considered to be noise-dominated and hence unusable.
| Quadrant | # 1 sec bins | Bins with >0 counts | Bins with >2000 counts | High rate bins dominated by noise | Noise dominated (total time) | Noise dominated (detector-on time) | Marked lightcurve |
|---|---|---|---|---|---|---|---|
| A | 7084 | 5023 | 21 | 21 | 0.30% | 0.42% | 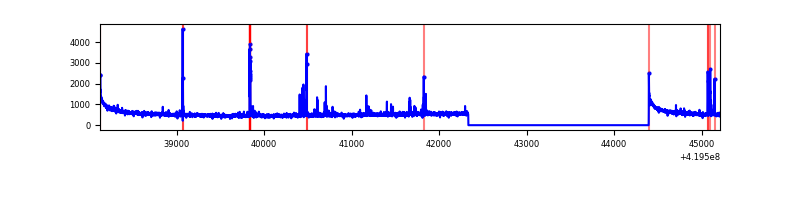 |
| B | 7084 | 5023 | 9 | 9 | 0.13% | 0.18% | 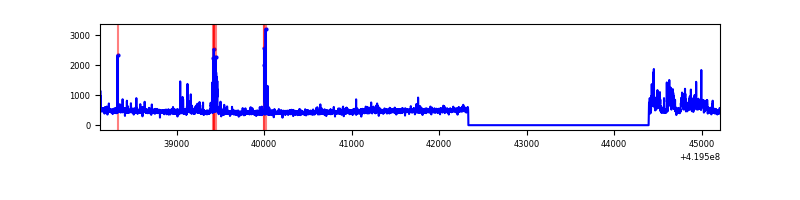 |
| C | 7084 | 5023 | 100 | 100 | 1.41% | 1.99% | 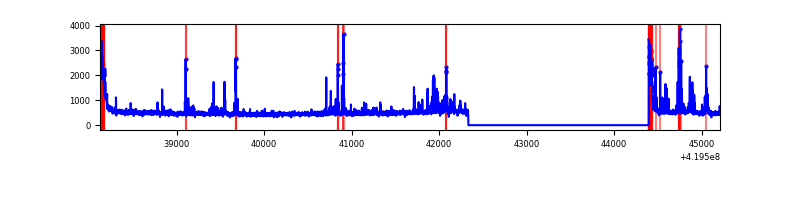 |
| D | 7084 | 5023 | 871 | 871 | 12.30% | 17.34% | 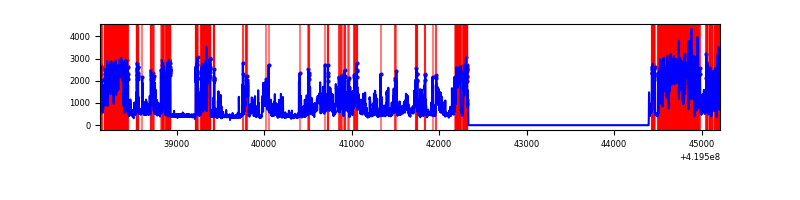 |
Top three noisy pixels from each quadrant. If the there are fewer than three noisy pixels in the level2.evt file, extra rows are filled as -1
| Pixel properties | Quadrant properties | ||||||
|---|---|---|---|---|---|---|---|
| Quadrant | DetID | PixID | Counts | Sigma | Mean | Median | Sigma |
| A | 10 | 83 | 475321 | 4078.63 | 570 | 560 | 116.4 |
| A | 13 | 248 | 127728 | 1092.49 | 570 | 560 | 116.4 |
| A | 12 | 189 | 13294 | 109.4 | 570 | 560 | 116.4 |
| B | 7 | 202 | 146273 | 1327.77 | 572 | 558 | 109.7 |
| B | 4 | 171 | 78793 | 712.89 | 572 | 558 | 109.7 |
| B | 0 | 190 | 54084 | 487.74 | 572 | 558 | 109.7 |
| C | 14 | 254 | 286621 | 2215.47 | 554 | 559 | 129.1 |
| C | 15 | 214 | 212737 | 1643.26 | 554 | 559 | 129.1 |
| C | 0 | 10 | 212528 | 1641.64 | 554 | 559 | 129.1 |
| D | 12 | 79 | 3124959 | 23773.59 | 528 | 513 | 131.4 |
| D | 13 | 249 | 179914 | 1365.04 | 528 | 513 | 131.4 |
| D | 2 | 249 | 121993 | 924.33 | 528 | 513 | 131.4 |
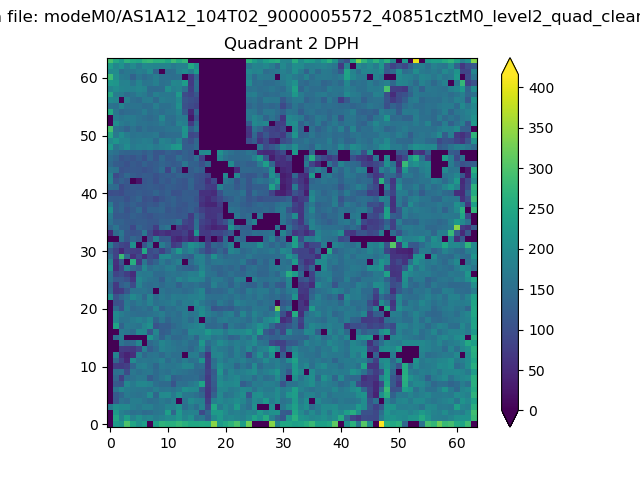
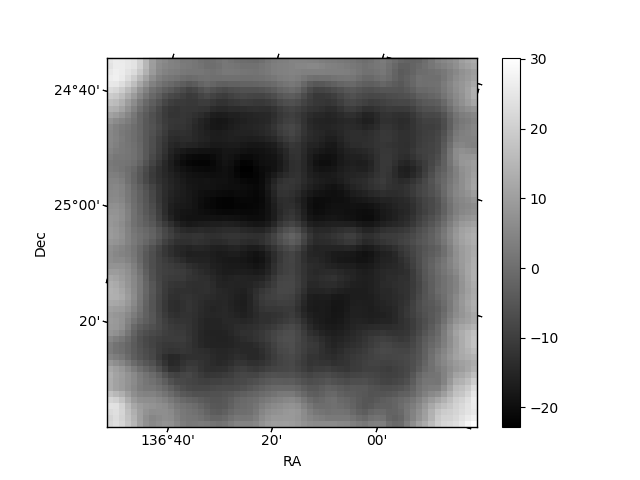
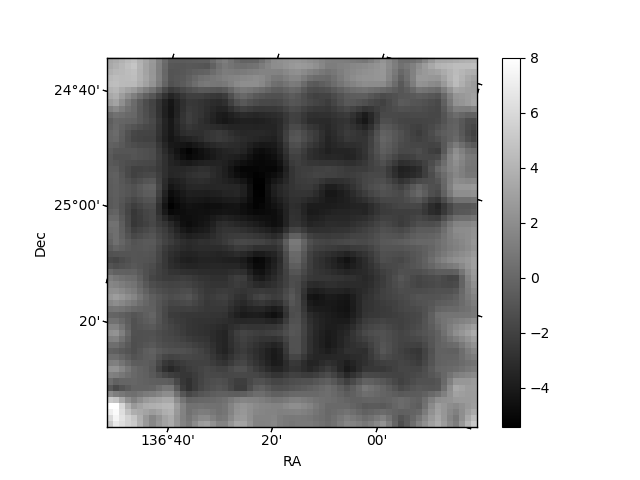
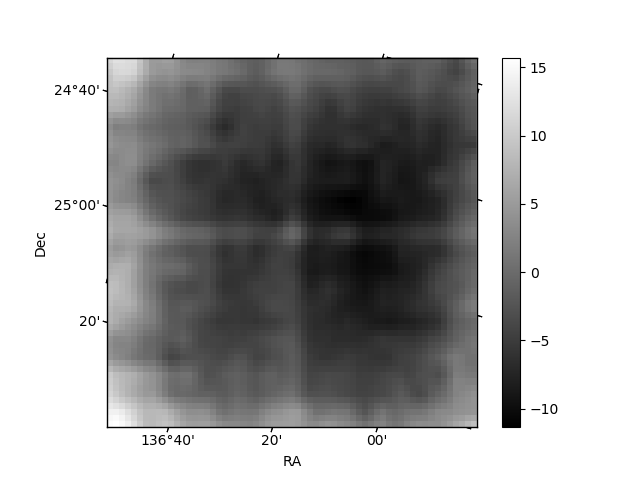
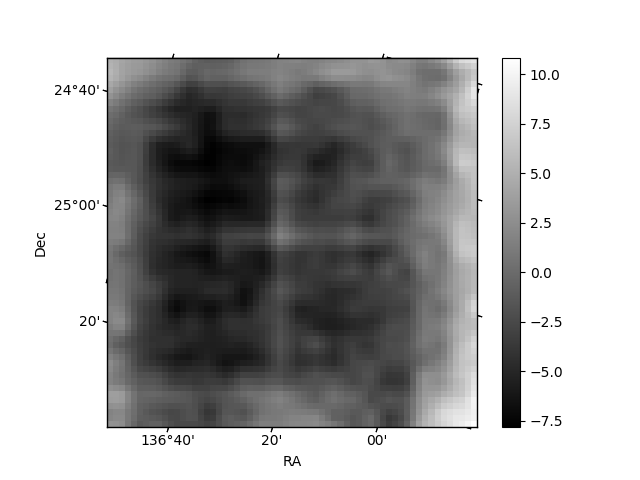
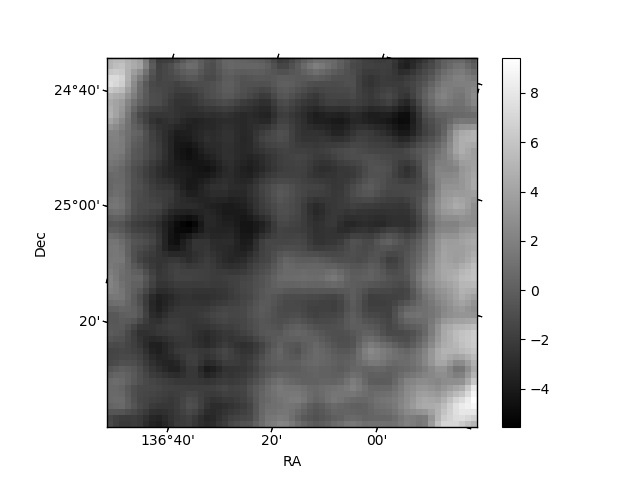
Histogram calculated using DETX and DETY for each event in the final _common_clean file
| Quadrant A | 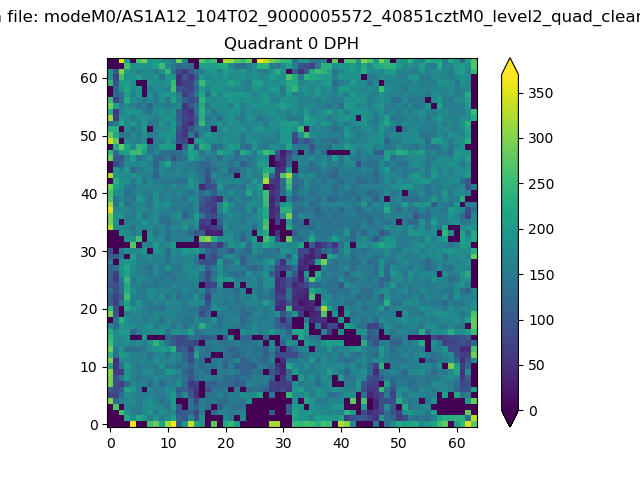 |
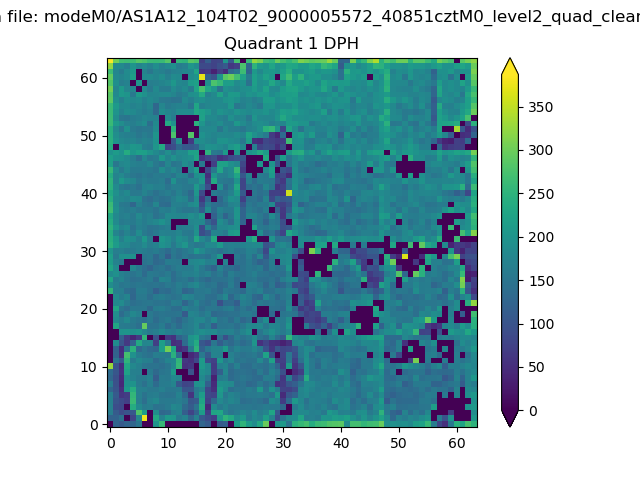 |
Quadrant B |
|---|---|---|---|
| Quadrant D | 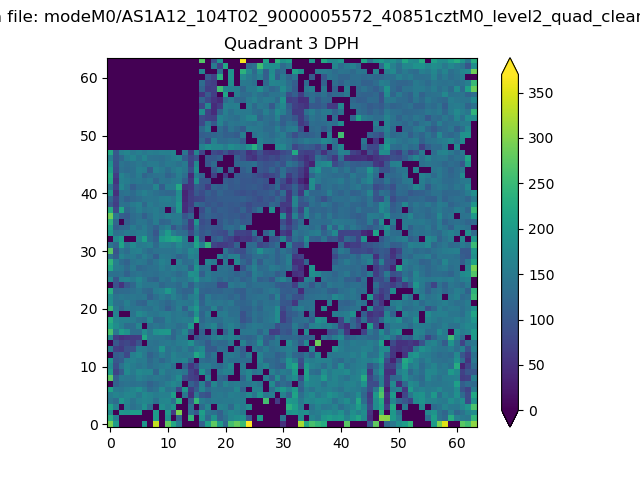 |
 |
Quadrant C |
| Plot type | Count rate plots | Images |
|---|---|---|
| Comparison with Poisson distribution Blue bars denote a histogram of data divided into 1 sec bins. Red curve is a Poisson curve with rate = median count rate of data. |
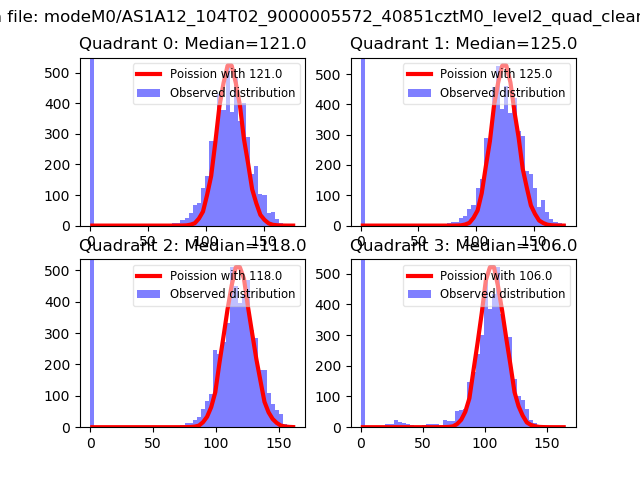 |
 |
| Quadrant-wise count rates Data is divided into 100 sec bins |
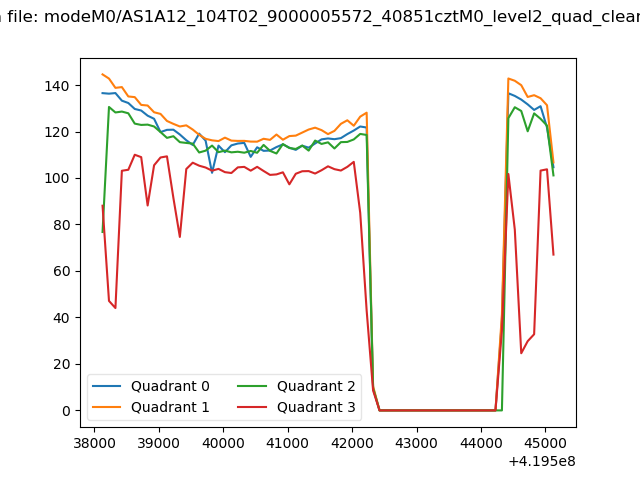 |
|
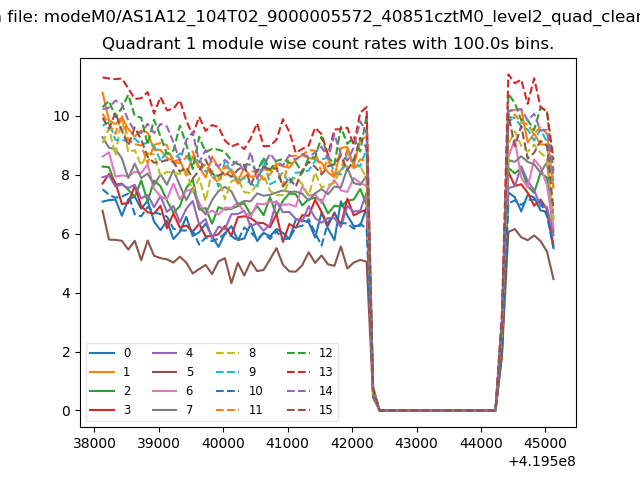
| Module-wise count rates for Quadrant A Data is divided into 100 sec bins |
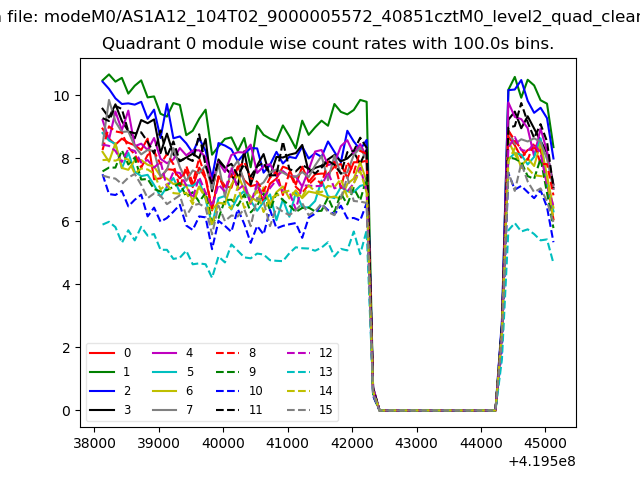 |
 |
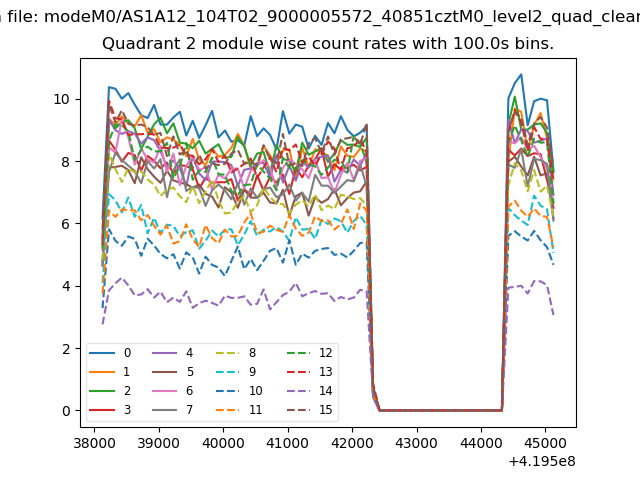
| Module-wise count rates for Quadrant B Data is divided into 100 sec bins |
 |
 |
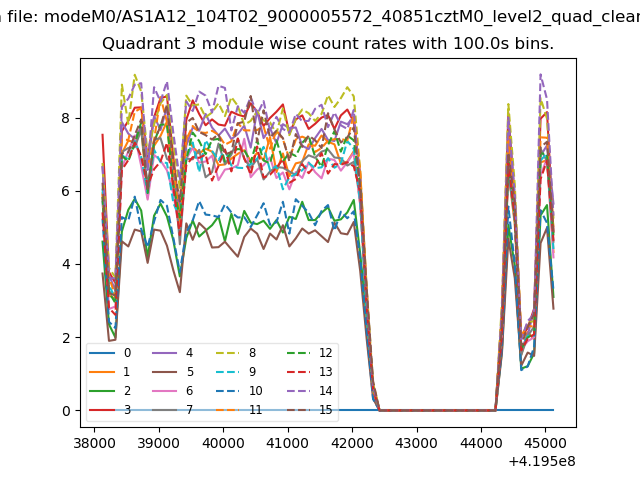
| Module-wise count rates for Quadrant C Data is divided into 100 sec bins |
 |
 |
| Module-wise count rates for Quadrant D Data is divided into 100 sec bins |
 |
 |
| Parameter | Plot |
|---|---|
| CZT HV Monitor | 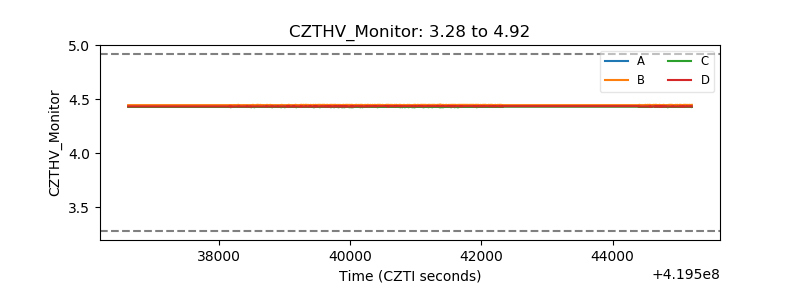 |
| D_VDD | 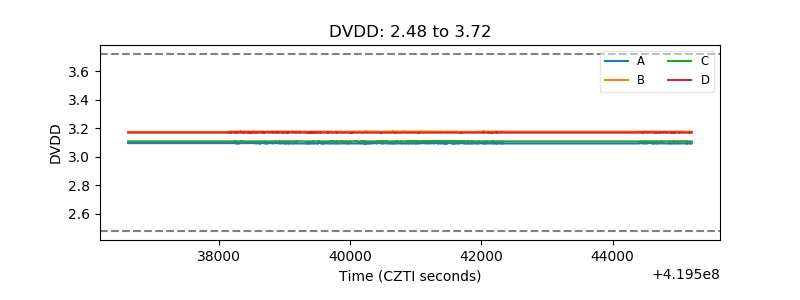 |
| Temperature 1 | 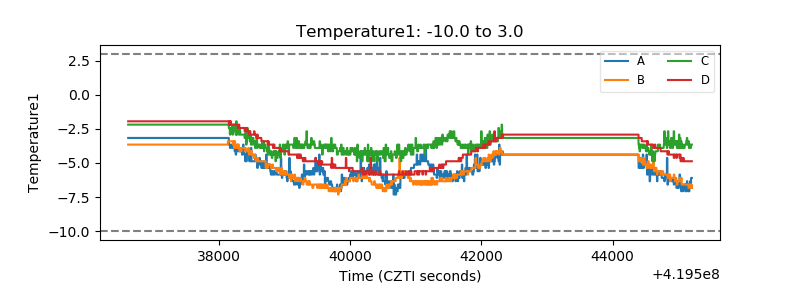 |
| Veto HV Monitor | 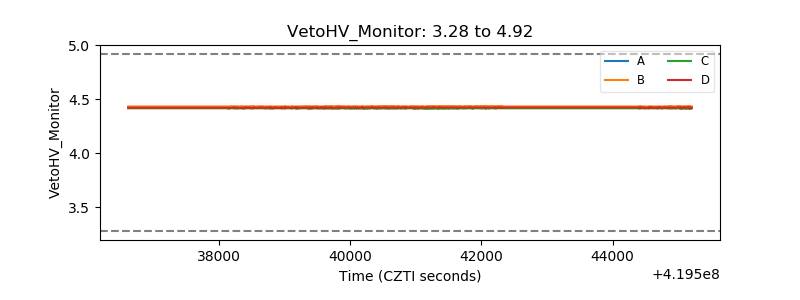 |
| Veto LLD | 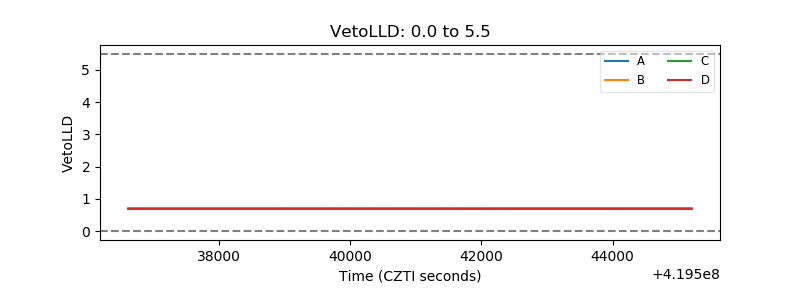 |
| Alpha Counter | 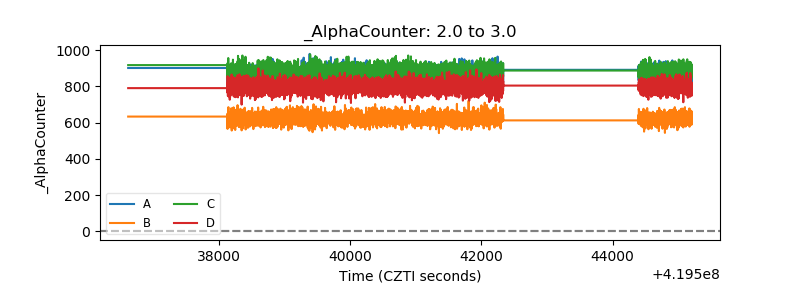 |
| _CPM_Rate |  |
| CZT Counter | 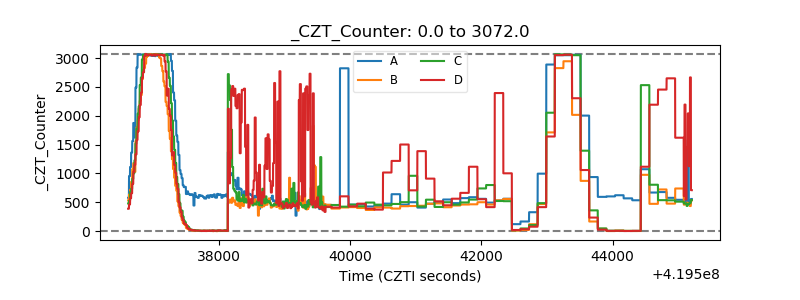 |
| +2.5 Volts monitor |  |
| +5 Volts monitor |  |
| _ROLL_ROT | 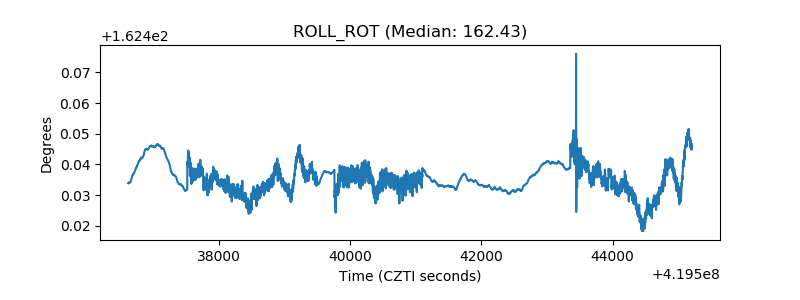 |
| _Roll_DEC | 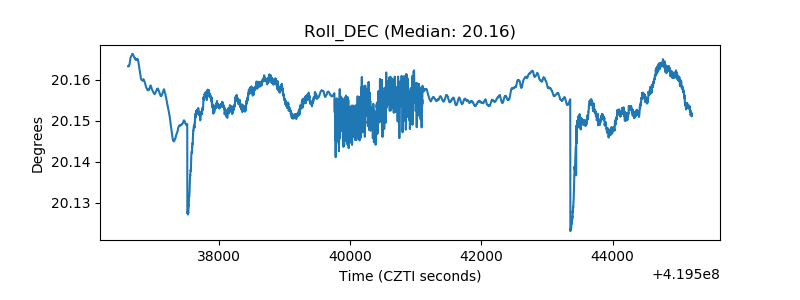 |
| _Roll_RA | 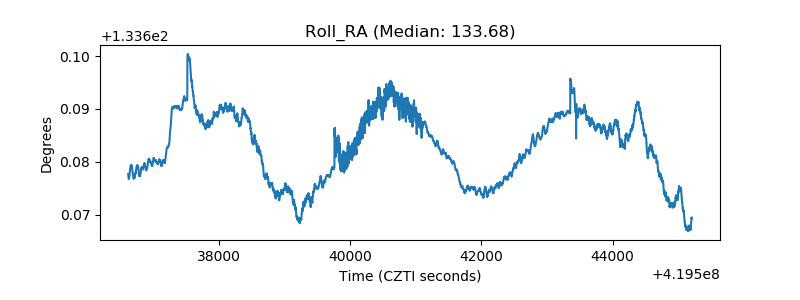 |
| Veto Counter | 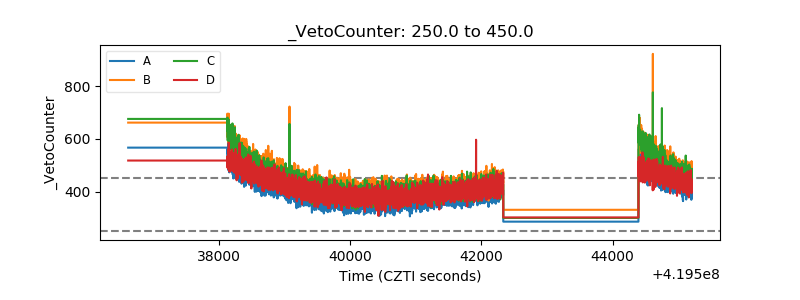 |