| Param | Original file | Final file |
|---|---|---|
| Filename | modeM0/AS1A12_104T02_9000005572_40852cztM0_level2.fits | modeM0/AS1A12_104T02_9000005572_40852cztM0_level2_quad_clean.evt |
| Size (bytes) | 416,082,240 | 84,502,080 |
| Size | 396.8 MB | 80.6 MB |
| Events in quadrant A | 2,843,680 | 593,958 |
| Events in quadrant B | 2,503,842 | 619,375 |
| Events in quadrant C | 2,746,945 | 576,482 |
| Events in quadrant D | 6,921,586 | 420,756 |
| Mode M9 | |||
|---|---|---|---|
| Quadrant | BADHDUFLAG | Total packets | Discarded packets |
| A | 0 | 35 | 0 |
| B | 0 | 35 | 0 |
| C | 0 | 35 | 0 |
| D | 0 | 36 | 0 |
| Mode M0 | |||
|---|---|---|---|
| Quadrant | BADHDUFLAG | Total packets | Discarded packets |
| A | 0 | 11480 | 3 |
| B | 0 | 10815 | 2 |
| C | 0 | 11172 | 2 |
| D | 0 | 23994 | 2 |
| Mode SS | |||
|---|---|---|---|
| Quadrant | BADHDUFLAG | Total packets | Discarded packets |
| A | 0 | 102 | 0 |
| B | 0 | 102 | 0 |
| C | 0 | 102 | 0 |
| D | 0 | 102 | 0 |
| Quadrant | Total seconds | Saturated seconds | Saturation percentage |
|---|---|---|---|
| A | 4963 | 34 | 0.685070% |
| B | 4963 | 22 | 0.443280% |
| C | 4963 | 80 | 1.611928% |
| D | 4963 | 1262 | 25.428168% |
Noise dominated data is calculated using 1-second bins in cleaned event files. If a bin has >2000 counts, and if more than 50% of those come from <1% of pixels, then it is considered to be noise-dominated and hence unusable.
| Quadrant | # 1 sec bins | Bins with >0 counts | Bins with >2000 counts | High rate bins dominated by noise | Noise dominated (total time) | Noise dominated (detector-on time) | Marked lightcurve |
|---|---|---|---|---|---|---|---|
| A | 7084 | 4964 | 17 | 17 | 0.24% | 0.34% | 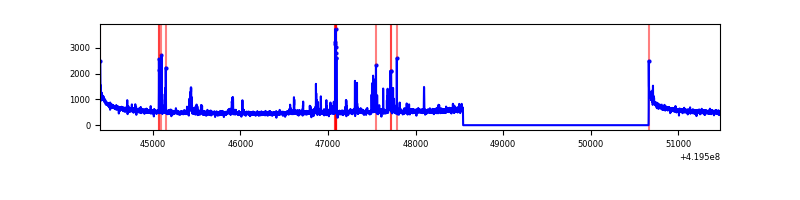 |
| B | 7084 | 4964 | 8 | 8 | 0.11% | 0.16% | 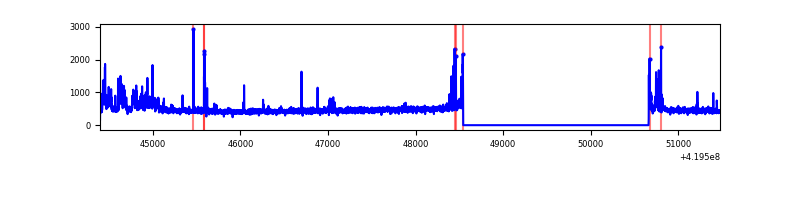 |
| C | 7084 | 4964 | 78 | 78 | 1.10% | 1.57% | 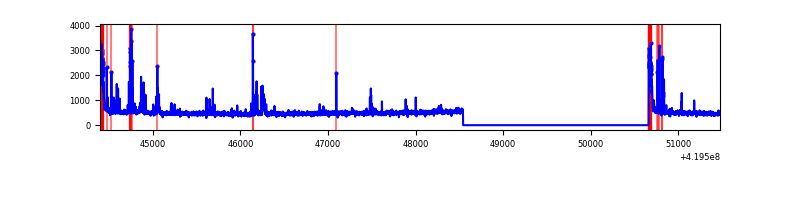 |
| D | 7084 | 4964 | 1423 | 1423 | 20.09% | 28.67% | 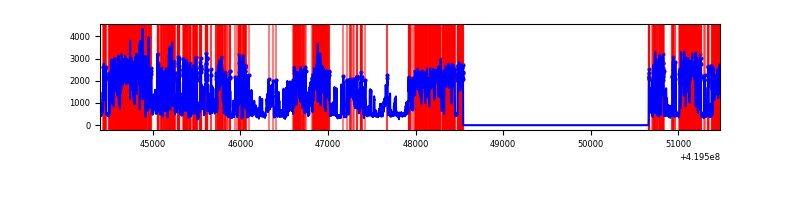 |
Top three noisy pixels from each quadrant. If the there are fewer than three noisy pixels in the level2.evt file, extra rows are filled as -1
| Pixel properties | Quadrant properties | ||||||
|---|---|---|---|---|---|---|---|
| Quadrant | DetID | PixID | Counts | Sigma | Mean | Median | Sigma |
| A | 10 | 83 | 461659 | 4000.37 | 562 | 552 | 115.3 |
| A | 13 | 248 | 104400 | 900.94 | 562 | 552 | 115.3 |
| A | 12 | 189 | 54044 | 464.07 | 562 | 552 | 115.3 |
| B | 7 | 202 | 148792 | 1365.95 | 565 | 550 | 108.5 |
| B | 4 | 171 | 89598 | 820.52 | 565 | 550 | 108.5 |
| B | 0 | 190 | 23570 | 212.11 | 565 | 550 | 108.5 |
| C | 14 | 254 | 211097 | 1653.18 | 547 | 552 | 127.4 |
| C | 15 | 214 | 210824 | 1651.03 | 547 | 552 | 127.4 |
| C | 0 | 10 | 178680 | 1398.64 | 547 | 552 | 127.4 |
| D | 12 | 79 | 4560516 | 36258.7 | 507 | 493 | 125.8 |
| D | 13 | 249 | 225736 | 1791.0 | 507 | 493 | 125.8 |
| D | 2 | 249 | 166100 | 1316.81 | 507 | 493 | 125.8 |
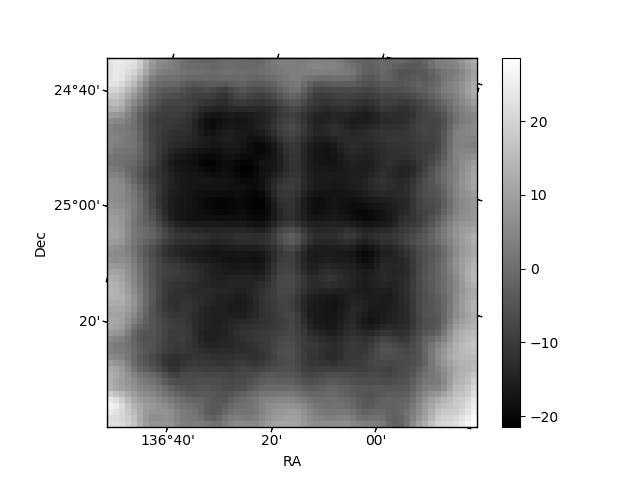
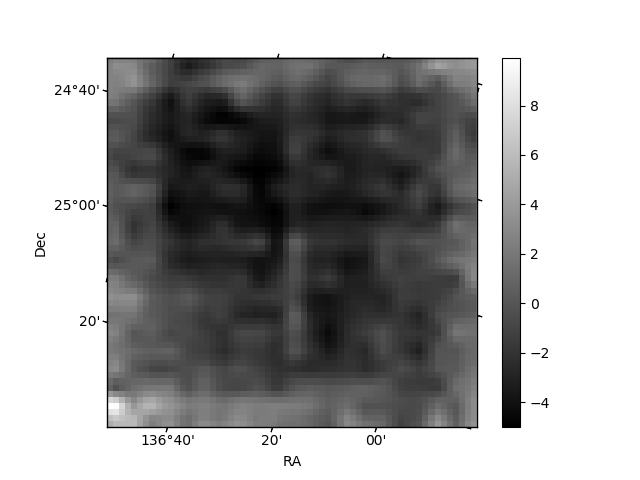
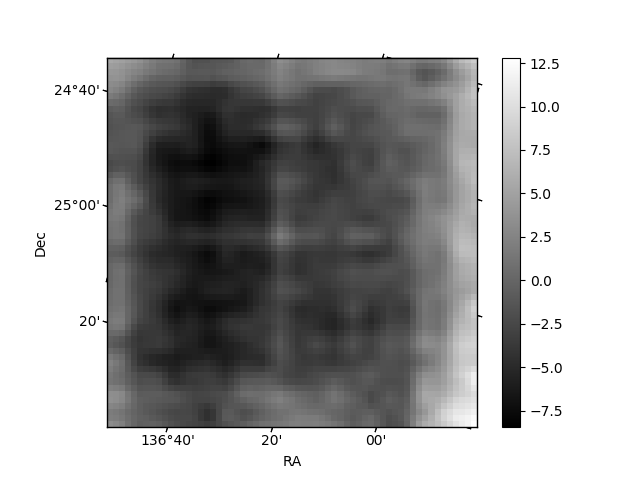
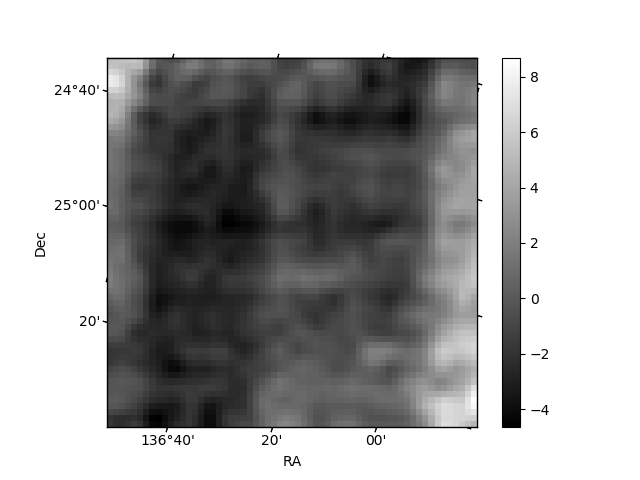
Histogram calculated using DETX and DETY for each event in the final _common_clean file
| Quadrant A | 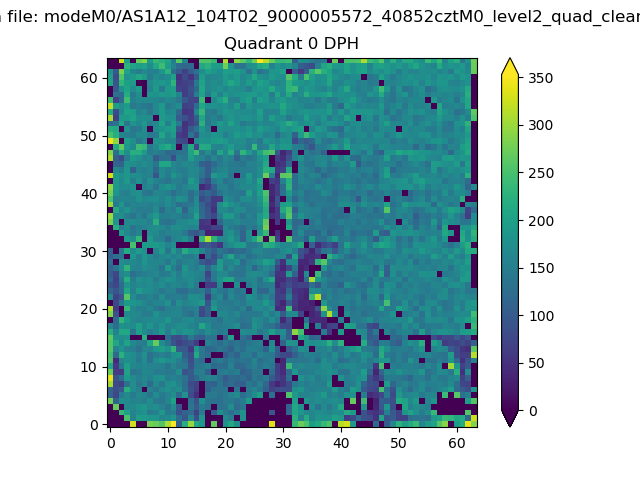 |
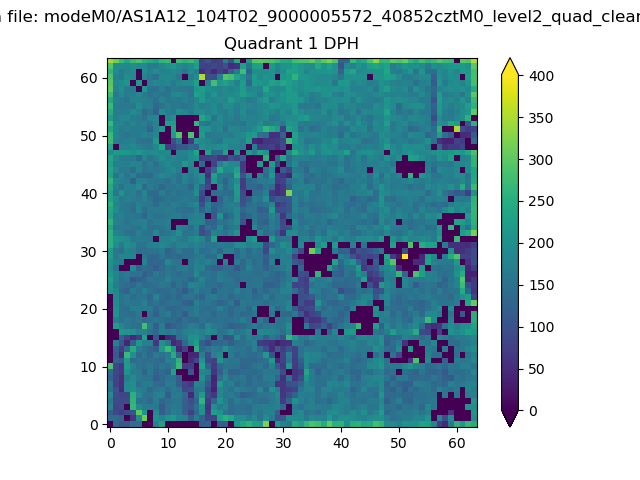 |
Quadrant B |
|---|---|---|---|
| Quadrant D | 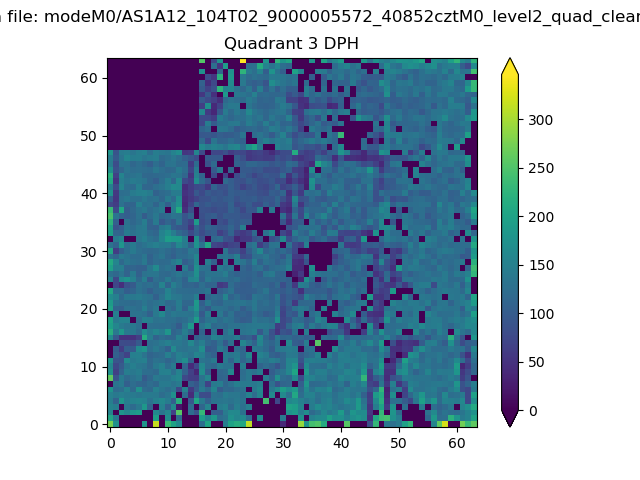 |
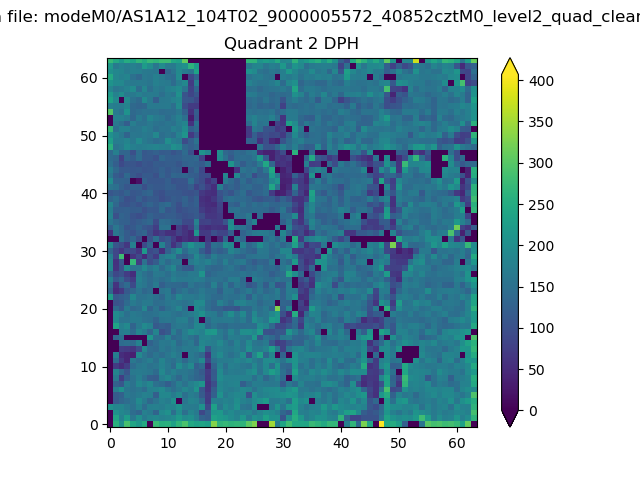 |
Quadrant C |
| Plot type | Count rate plots | Images |
|---|---|---|
| Comparison with Poisson distribution Blue bars denote a histogram of data divided into 1 sec bins. Red curve is a Poisson curve with rate = median count rate of data. |
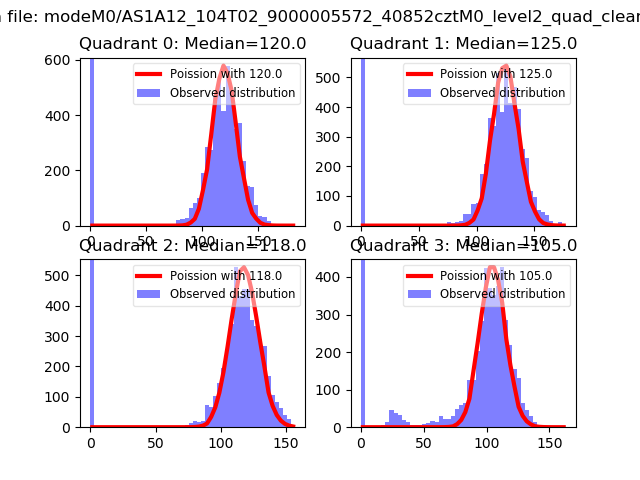 |
 |
| Quadrant-wise count rates Data is divided into 100 sec bins |
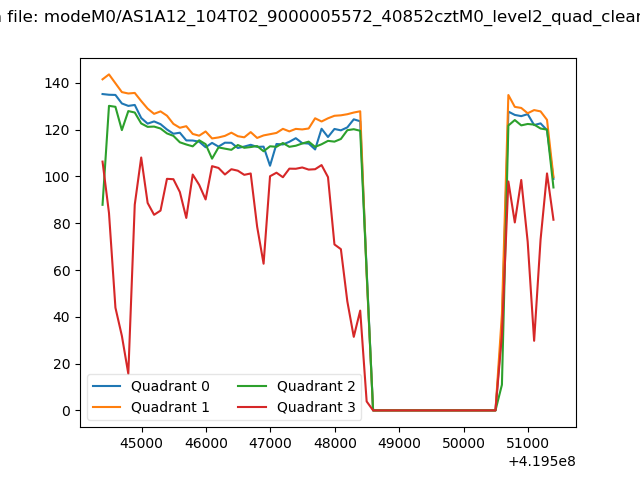 |
|
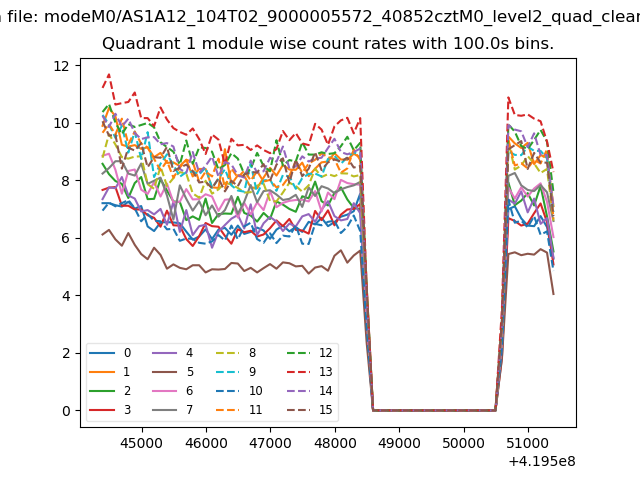
| Module-wise count rates for Quadrant A Data is divided into 100 sec bins |
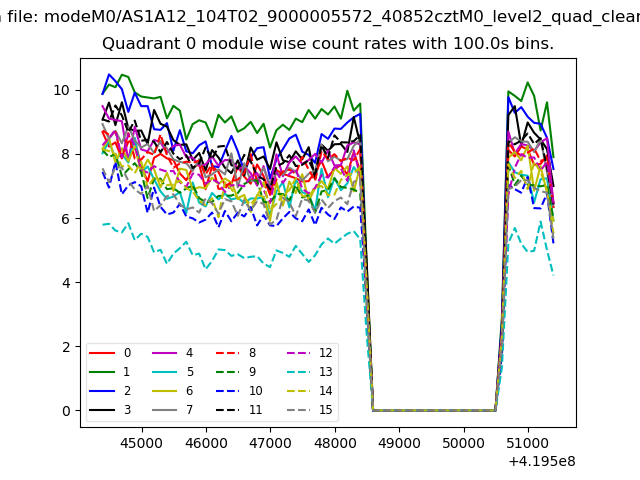 |
 |
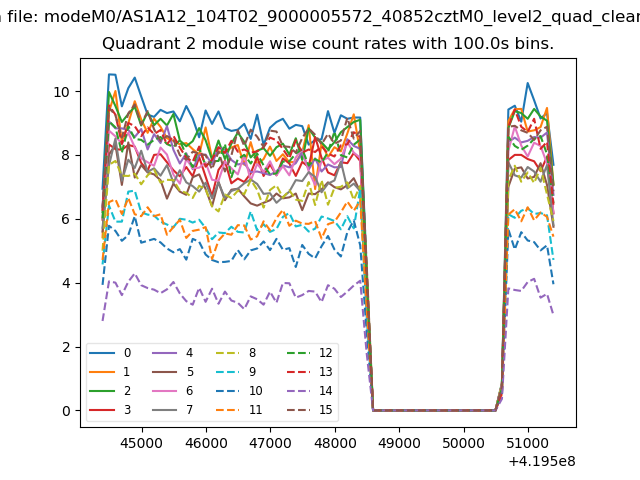
| Module-wise count rates for Quadrant B Data is divided into 100 sec bins |
 |
 |
| Module-wise count rates for Quadrant C Data is divided into 100 sec bins |
 |
 |
| Module-wise count rates for Quadrant D Data is divided into 100 sec bins |
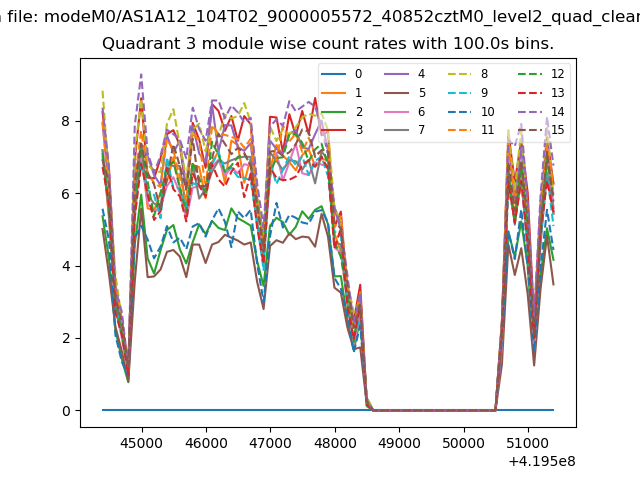 |
 |
| Parameter | Plot |
|---|---|
| CZT HV Monitor | 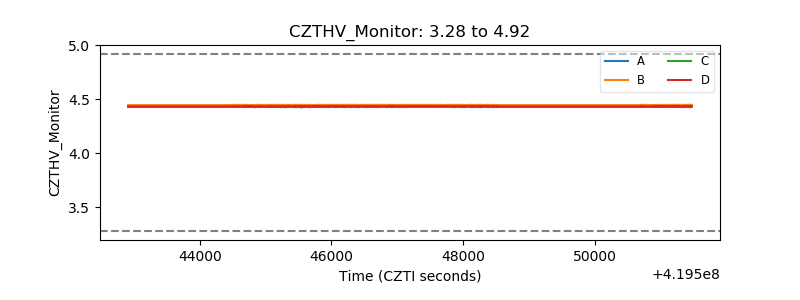 |
| D_VDD | 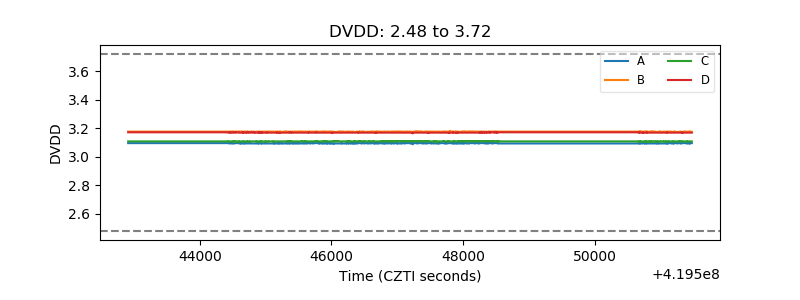 |
| Temperature 1 | 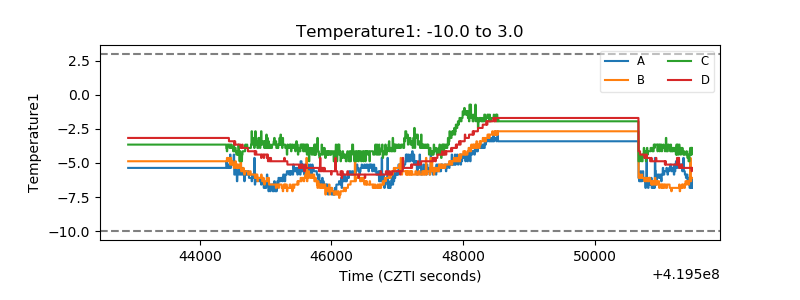 |
| Veto HV Monitor | 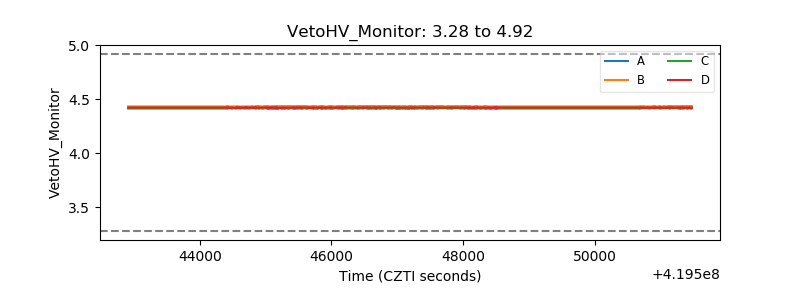 |
| Veto LLD | 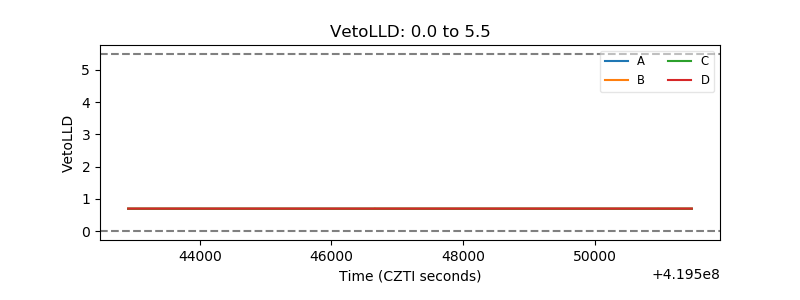 |
| Alpha Counter | 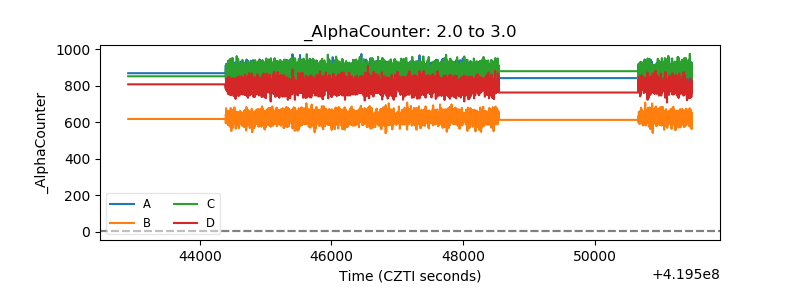 |
| _CPM_Rate |  |
| CZT Counter | 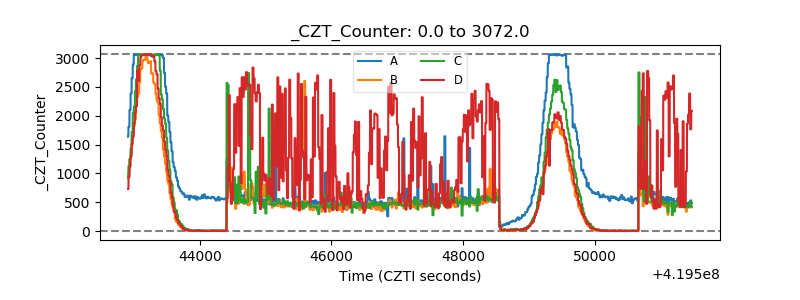 |
| +2.5 Volts monitor |  |
| +5 Volts monitor | 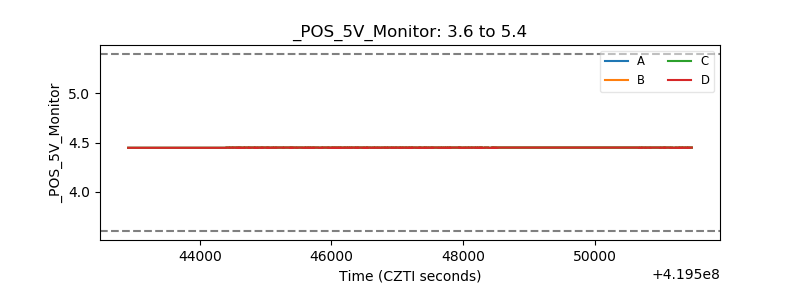 |
| _ROLL_ROT | 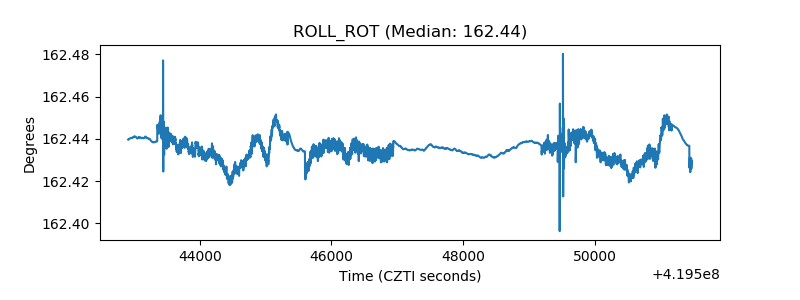 |
| _Roll_DEC | 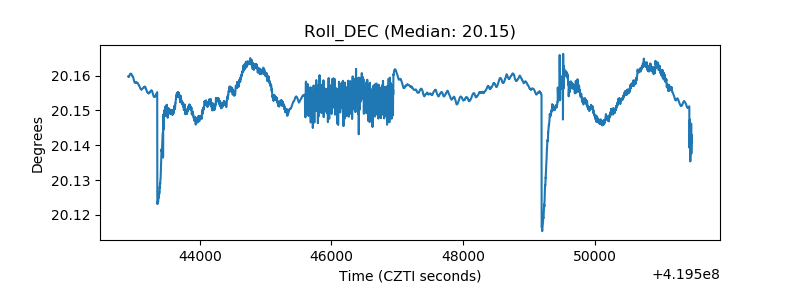 |
| _Roll_RA | 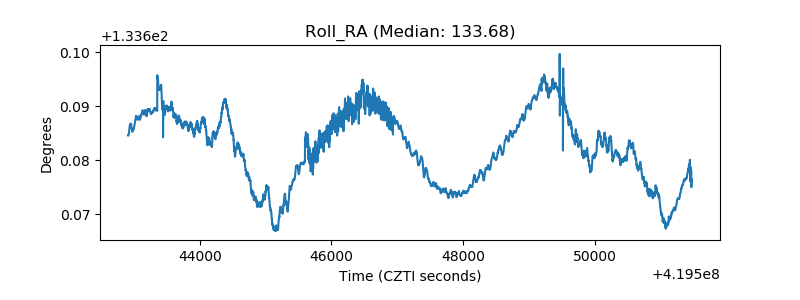 |
| Veto Counter | 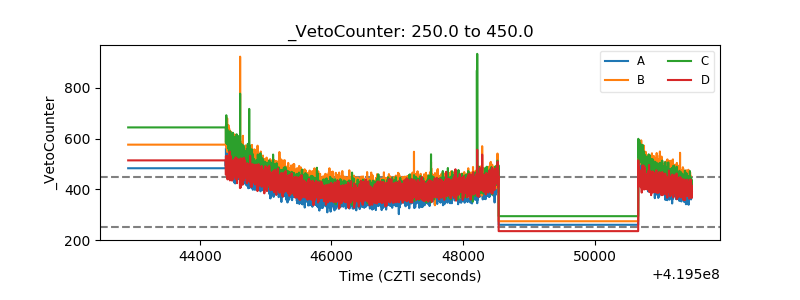 |