| Param | Original file | Final file |
|---|---|---|
| Filename | modeM0/AS1A12_104T02_9000005572_40853cztM0_level2.fits | modeM0/AS1A12_104T02_9000005572_40853cztM0_level2_quad_clean.evt |
| Size (bytes) | 356,330,880 | 81,025,920 |
| Size | 339.8 MB | 77.3 MB |
| Events in quadrant A | 2,601,839 | 555,607 |
| Events in quadrant B | 2,220,439 | 576,936 |
| Events in quadrant C | 2,722,779 | 538,011 |
| Events in quadrant D | 5,271,165 | 445,972 |
| Mode M9 | |||
|---|---|---|---|
| Quadrant | BADHDUFLAG | Total packets | Discarded packets |
| A | 0 | 37 | 0 |
| B | 0 | 37 | 0 |
| C | 0 | 37 | 0 |
| D | 0 | 38 | 0 |
| Mode M0 | |||
|---|---|---|---|
| Quadrant | BADHDUFLAG | Total packets | Discarded packets |
| A | 0 | 10609 | 3 |
| B | 0 | 9901 | 2 |
| C | 0 | 11034 | 2 |
| D | 0 | 19028 | 2 |
| Mode SS | |||
|---|---|---|---|
| Quadrant | BADHDUFLAG | Total packets | Discarded packets |
| A | 0 | 98 | 0 |
| B | 0 | 98 | 0 |
| C | 0 | 98 | 0 |
| D | 0 | 98 | 0 |
| Quadrant | Total seconds | Saturated seconds | Saturation percentage |
|---|---|---|---|
| A | 4801 | 14 | 0.291606% |
| B | 4801 | 16 | 0.333264% |
| C | 4801 | 98 | 2.041241% |
| D | 4801 | 679 | 14.142887% |
Noise dominated data is calculated using 1-second bins in cleaned event files. If a bin has >2000 counts, and if more than 50% of those come from <1% of pixels, then it is considered to be noise-dominated and hence unusable.
| Quadrant | # 1 sec bins | Bins with >0 counts | Bins with >2000 counts | High rate bins dominated by noise | Noise dominated (total time) | Noise dominated (detector-on time) | Marked lightcurve |
|---|---|---|---|---|---|---|---|
| A | 6954 | 4802 | 8 | 8 | 0.12% | 0.17% | 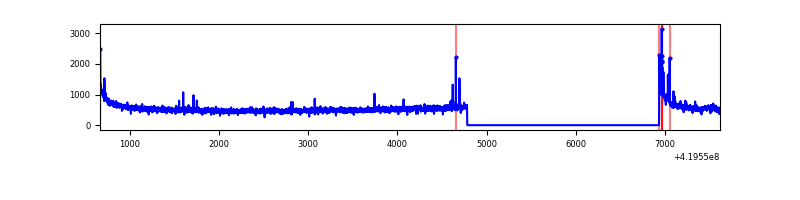 |
| B | 6954 | 4802 | 5 | 5 | 0.07% | 0.10% | 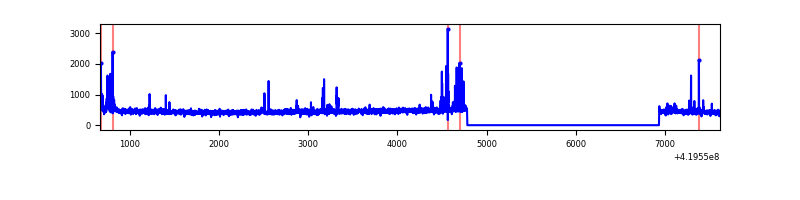 |
| C | 6954 | 4802 | 87 | 87 | 1.25% | 1.81% | 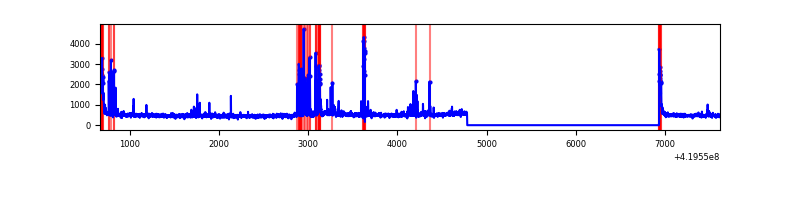 |
| D | 6954 | 4802 | 853 | 853 | 12.27% | 17.76% | 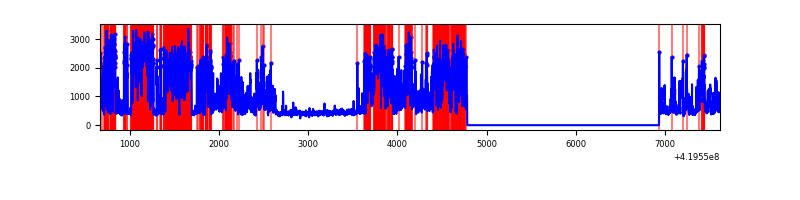 |
Top three noisy pixels from each quadrant. If the there are fewer than three noisy pixels in the level2.evt file, extra rows are filled as -1
| Pixel properties | Quadrant properties | ||||||
|---|---|---|---|---|---|---|---|
| Quadrant | DetID | PixID | Counts | Sigma | Mean | Median | Sigma |
| A | 10 | 83 | 445915 | 4040.85 | 536 | 527 | 110.2 |
| A | 2 | 79 | 41940 | 375.73 | 536 | 527 | 110.2 |
| A | 12 | 189 | 28056 | 249.76 | 536 | 527 | 110.2 |
| B | 4 | 171 | 105036 | 1002.44 | 538 | 525 | 104.3 |
| B | 12 | 111 | 13148 | 121.08 | 538 | 525 | 104.3 |
| B | 11 | 111 | 12184 | 111.83 | 538 | 525 | 104.3 |
| C | 14 | 254 | 291402 | 2406.24 | 520 | 525 | 120.9 |
| C | 15 | 214 | 205341 | 1694.31 | 520 | 525 | 120.9 |
| C | 0 | 10 | 135045 | 1112.8 | 520 | 525 | 120.9 |
| D | 12 | 79 | 3146703 | 25334.71 | 500 | 486 | 124.2 |
| D | 2 | 249 | 87651 | 701.89 | 500 | 486 | 124.2 |
| D | 13 | 249 | 56189 | 448.54 | 500 | 486 | 124.2 |
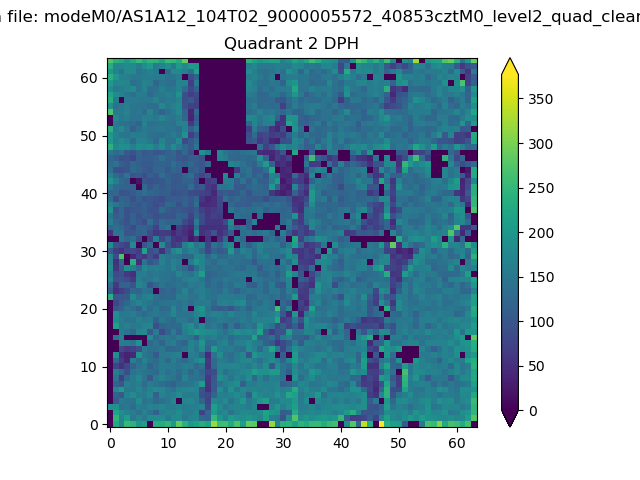
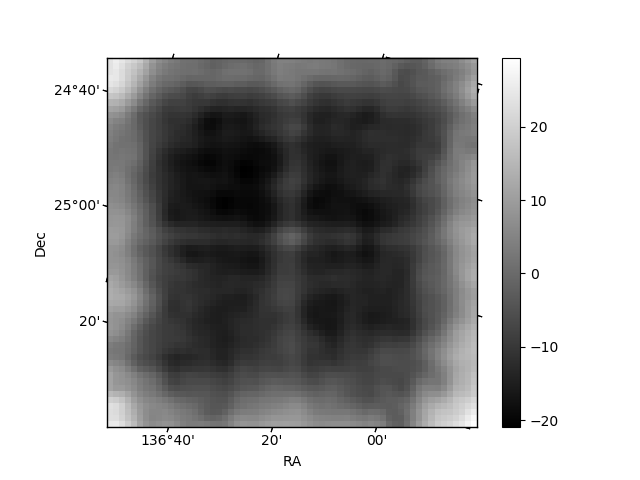
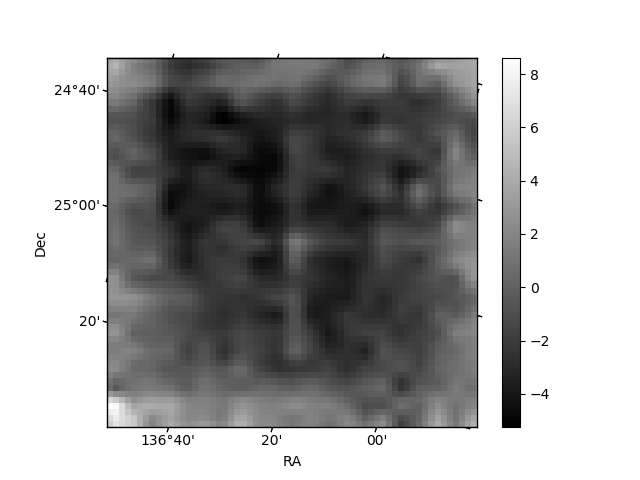
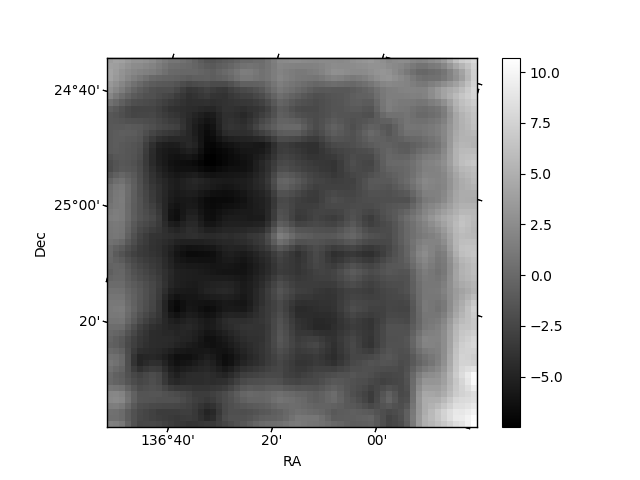
Histogram calculated using DETX and DETY for each event in the final _common_clean file
| Quadrant A | 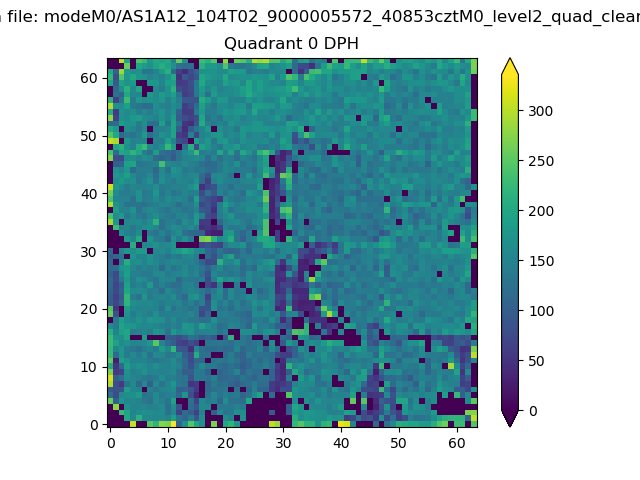 |
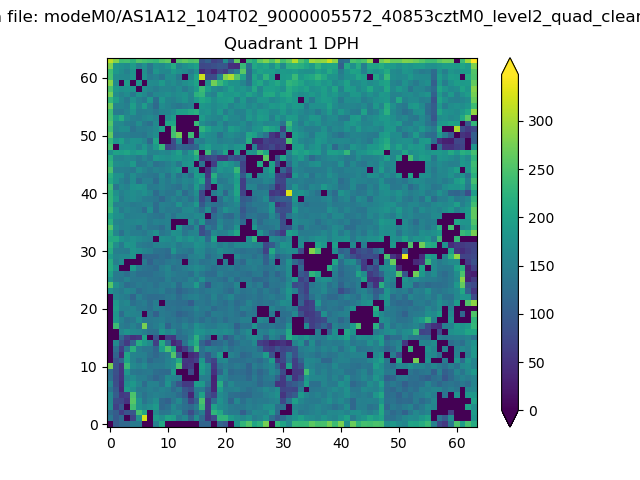 |
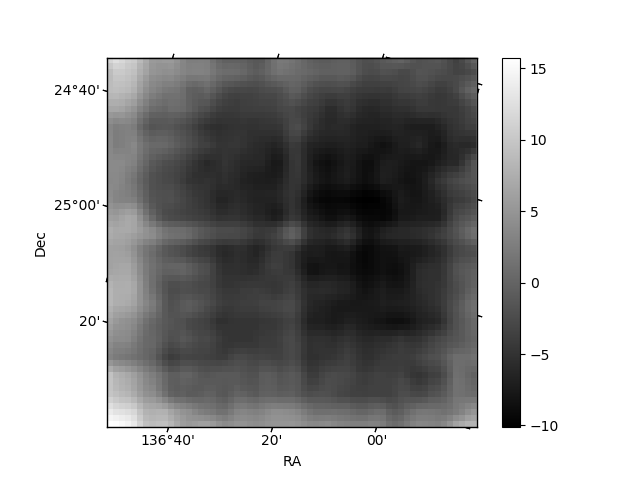
Quadrant B |
|---|---|---|---|
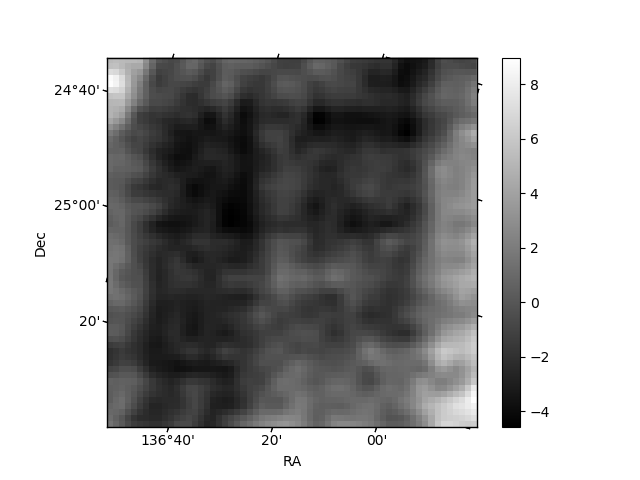
| Quadrant D | 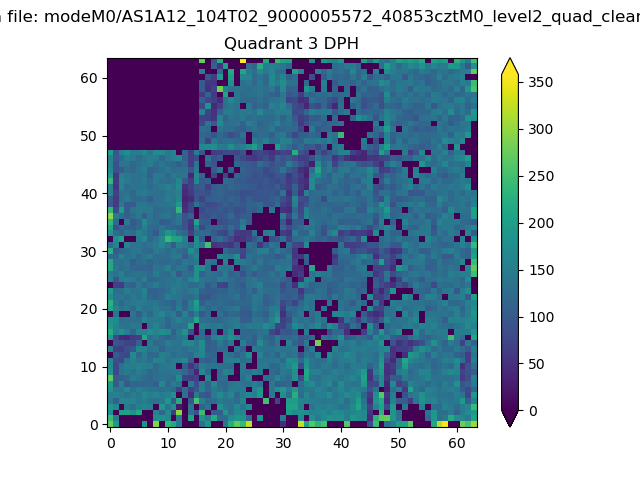 |
 |
Quadrant C |
| Plot type | Count rate plots | Images |
|---|---|---|
| Comparison with Poisson distribution Blue bars denote a histogram of data divided into 1 sec bins. Red curve is a Poisson curve with rate = median count rate of data. |
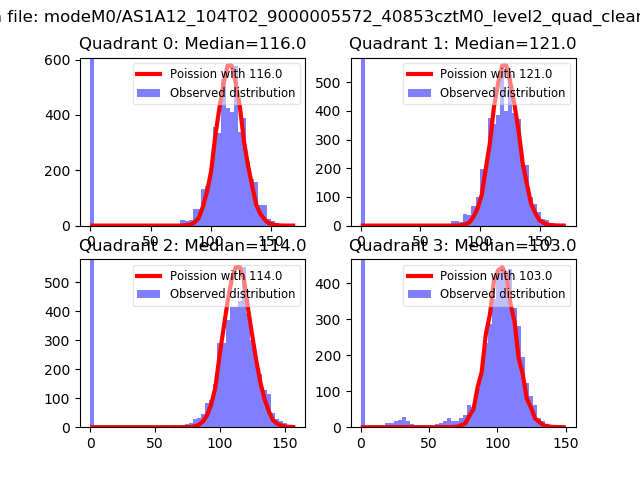 |
 |
| Quadrant-wise count rates Data is divided into 100 sec bins |
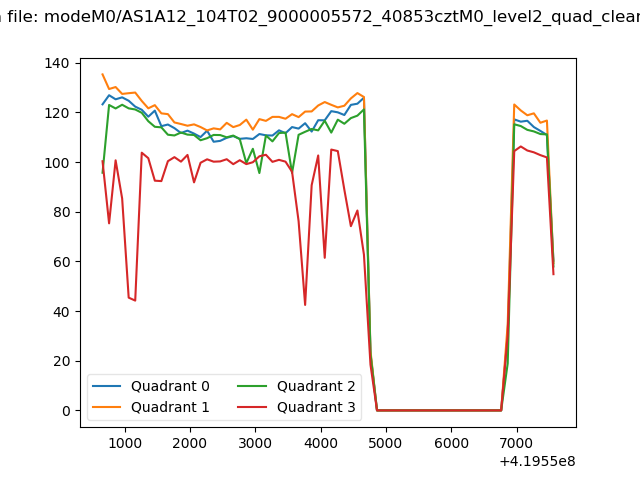 |
|
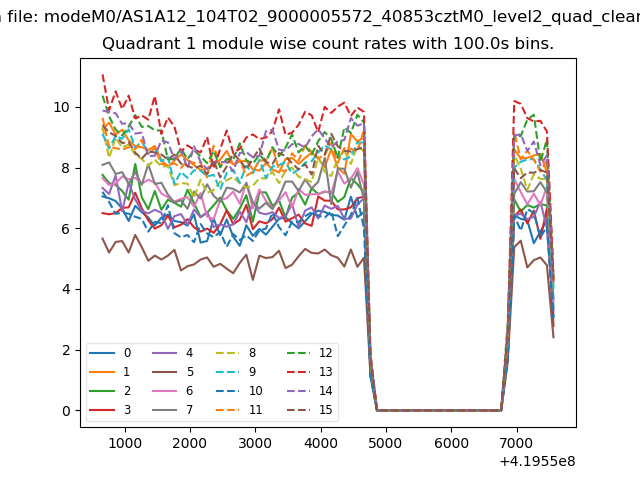
| Module-wise count rates for Quadrant A Data is divided into 100 sec bins |
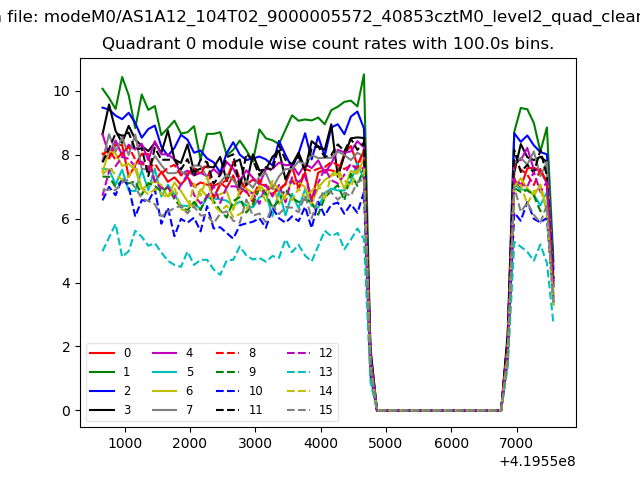 |
 |
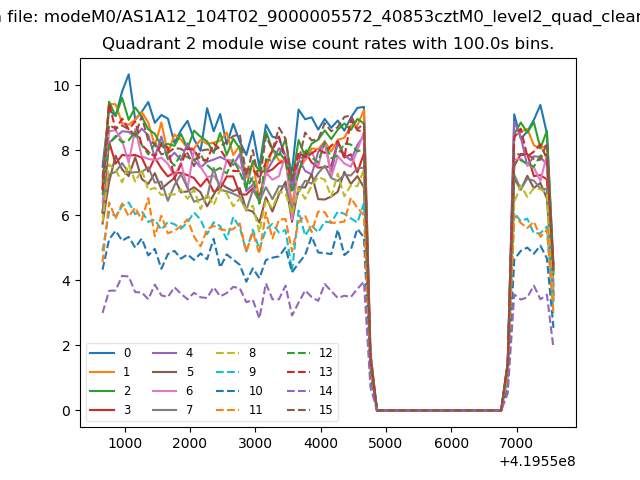
| Module-wise count rates for Quadrant B Data is divided into 100 sec bins |
 |
 |
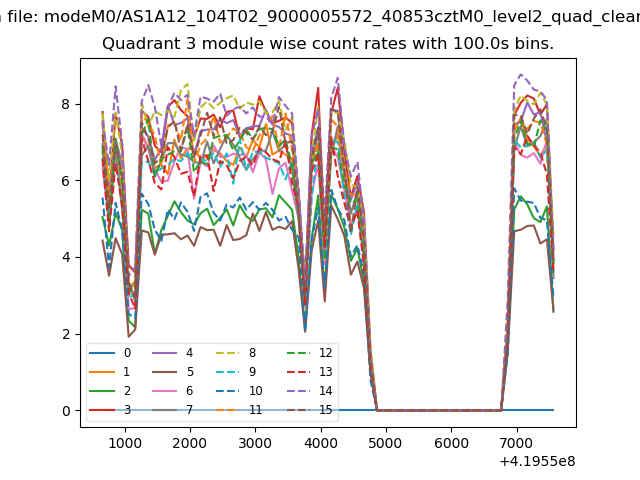
| Module-wise count rates for Quadrant C Data is divided into 100 sec bins |
 |
 |
| Module-wise count rates for Quadrant D Data is divided into 100 sec bins |
 |
 |
| Parameter | Plot |
|---|---|
| CZT HV Monitor | 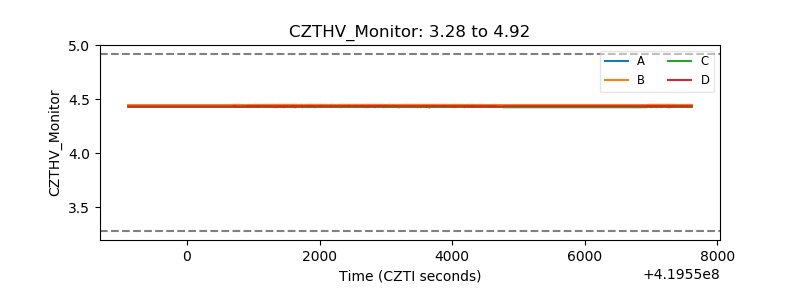 |
| D_VDD | 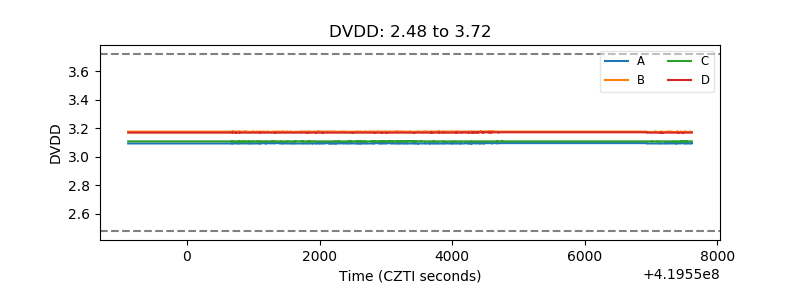 |
| Temperature 1 | 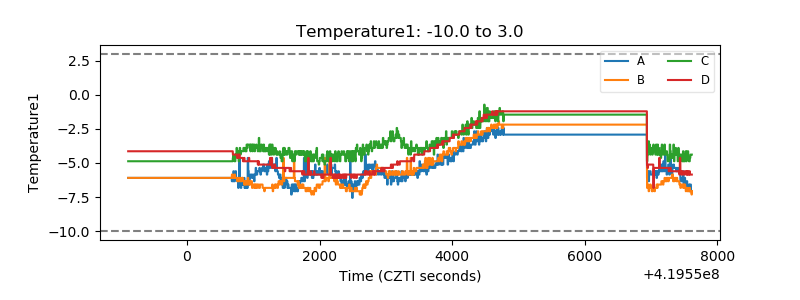 |
| Veto HV Monitor | 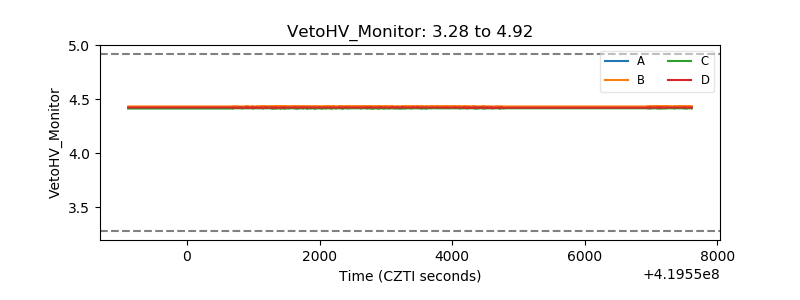 |
| Veto LLD | 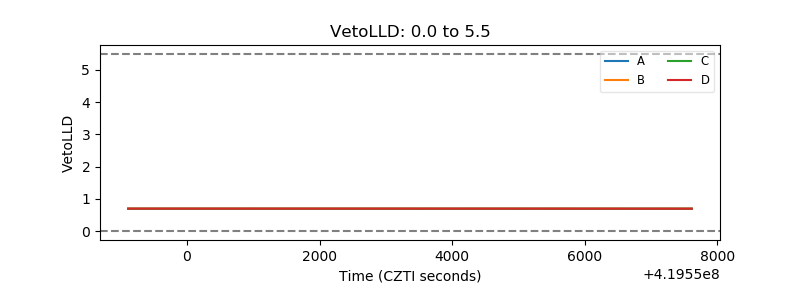 |
| Alpha Counter | 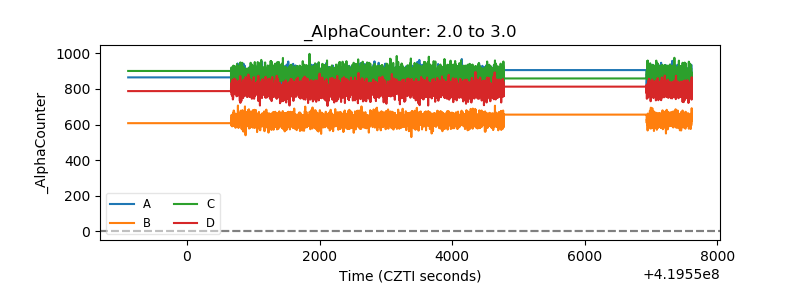 |
| _CPM_Rate | 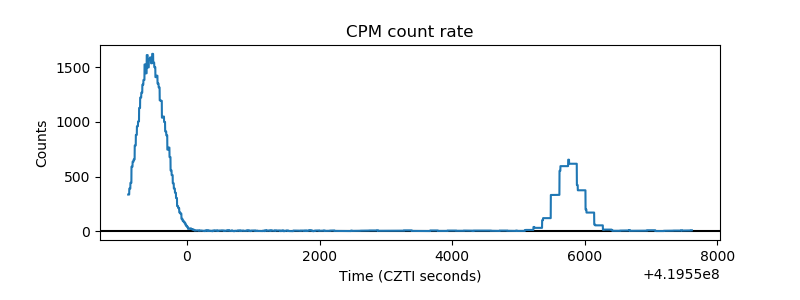 |
| CZT Counter | 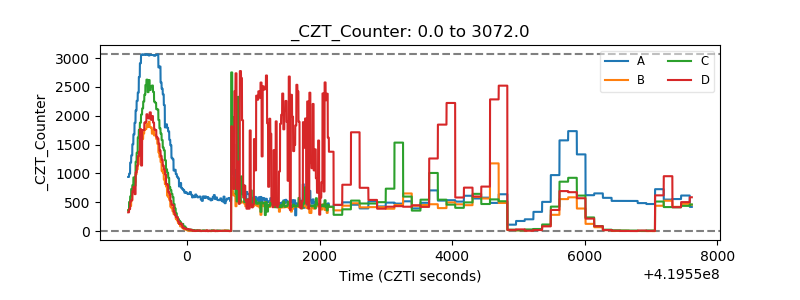 |
| +2.5 Volts monitor |  |
| +5 Volts monitor | 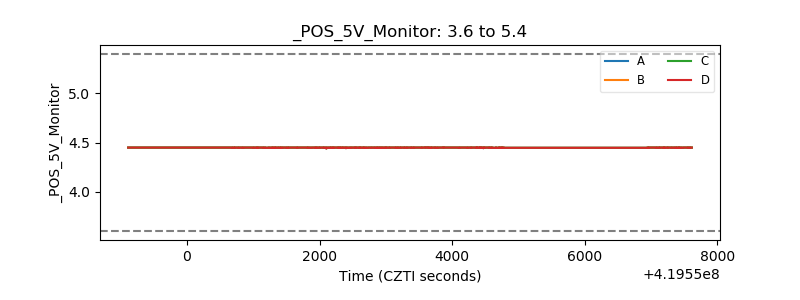 |
| _ROLL_ROT |  |
| _Roll_DEC | 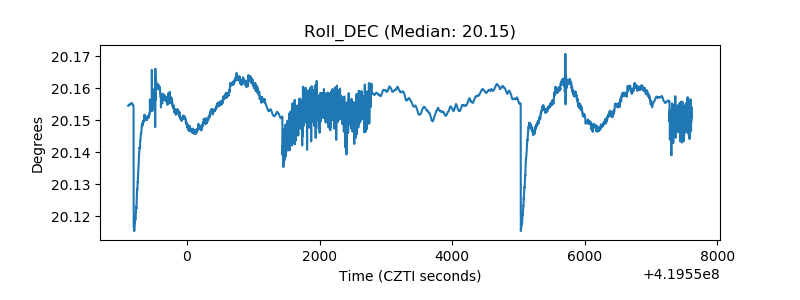 |
| _Roll_RA | 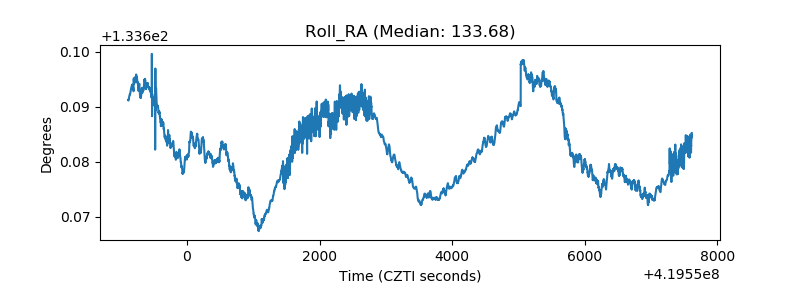 |
| Veto Counter | 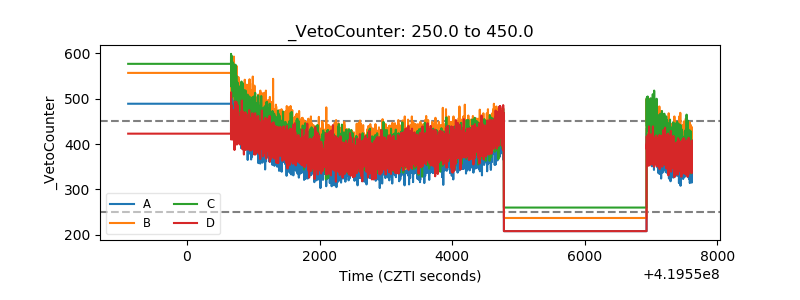 |