| Param | Original file | Final file |
|---|---|---|
| Filename | modeM0/AS1A12_104T02_9000005572_40854cztM0_level2.fits | modeM0/AS1A12_104T02_9000005572_40854cztM0_level2_quad_clean.evt |
| Size (bytes) | 366,713,280 | 83,606,400 |
| Size | 349.7 MB | 79.7 MB |
| Events in quadrant A | 2,803,672 | 566,695 |
| Events in quadrant B | 2,677,103 | 572,460 |
| Events in quadrant C | 3,244,127 | 544,819 |
| Events in quadrant D | 4,453,124 | 490,402 |
| Mode M9 | |||
|---|---|---|---|
| Quadrant | BADHDUFLAG | Total packets | Discarded packets |
| A | 0 | 39 | 0 |
| B | 0 | 39 | 0 |
| C | 0 | 39 | 0 |
| D | 0 | 40 | 0 |
| Mode M0 | |||
|---|---|---|---|
| Quadrant | BADHDUFLAG | Total packets | Discarded packets |
| A | 0 | 11435 | 3 |
| B | 0 | 11564 | 2 |
| C | 0 | 12780 | 2 |
| D | 0 | 16757 | 2 |
| Mode SS | |||
|---|---|---|---|
| Quadrant | BADHDUFLAG | Total packets | Discarded packets |
| A | 0 | 104 | 0 |
| B | 0 | 104 | 0 |
| C | 0 | 104 | 0 |
| D | 0 | 104 | 0 |
| Quadrant | Total seconds | Saturated seconds | Saturation percentage |
|---|---|---|---|
| A | 5095 | 16 | 0.314033% |
| B | 5095 | 150 | 2.944063% |
| C | 5095 | 130 | 2.551521% |
| D | 5095 | 283 | 5.554465% |
Noise dominated data is calculated using 1-second bins in cleaned event files. If a bin has >2000 counts, and if more than 50% of those come from <1% of pixels, then it is considered to be noise-dominated and hence unusable.
| Quadrant | # 1 sec bins | Bins with >0 counts | Bins with >2000 counts | High rate bins dominated by noise | Noise dominated (total time) | Noise dominated (detector-on time) | Marked lightcurve |
|---|---|---|---|---|---|---|---|
| A | 7097 | 5096 | 12 | 12 | 0.17% | 0.24% | 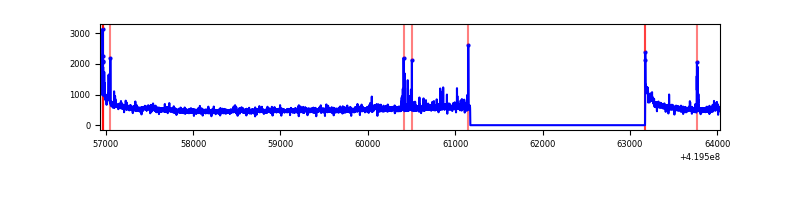 |
| B | 7097 | 5096 | 84 | 84 | 1.18% | 1.65% | 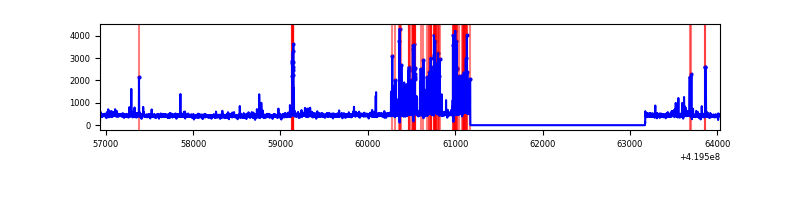 |
| C | 7097 | 5096 | 140 | 140 | 1.97% | 2.75% | 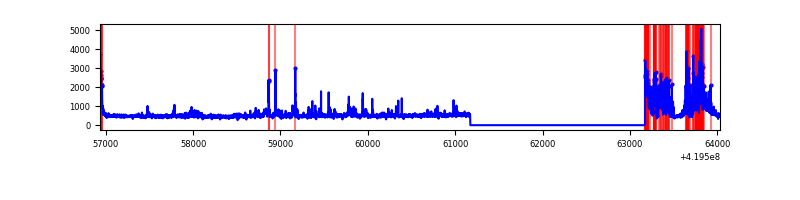 |
| D | 7097 | 5096 | 261 | 261 | 3.68% | 5.12% | 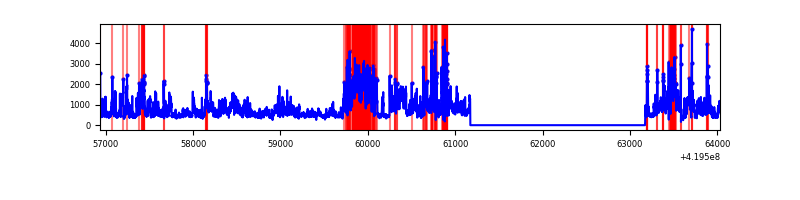 |
Top three noisy pixels from each quadrant. If the there are fewer than three noisy pixels in the level2.evt file, extra rows are filled as -1
| Pixel properties | Quadrant properties | ||||||
|---|---|---|---|---|---|---|---|
| Quadrant | DetID | PixID | Counts | Sigma | Mean | Median | Sigma |
| A | 10 | 83 | 477633 | 4128.52 | 560 | 548 | 115.6 |
| A | 12 | 189 | 67778 | 581.78 | 560 | 548 | 115.6 |
| A | 13 | 248 | 44416 | 379.62 | 560 | 548 | 115.6 |
| B | 4 | 171 | 474604 | 4385.12 | 553 | 537 | 108.1 |
| B | 5 | 255 | 23332 | 210.85 | 553 | 537 | 108.1 |
| B | 12 | 111 | 13584 | 120.68 | 553 | 537 | 108.1 |
| C | 14 | 254 | 617476 | 4866.46 | 542 | 546 | 126.8 |
| C | 15 | 214 | 218050 | 1715.71 | 542 | 546 | 126.8 |
| C | 3 | 233 | 146872 | 1154.25 | 542 | 546 | 126.8 |
| D | 12 | 79 | 1415827 | 10834.34 | 530 | 515 | 130.6 |
| D | 13 | 249 | 690593 | 5282.61 | 530 | 515 | 130.6 |
| D | 1 | 47 | 188325 | 1437.7 | 530 | 515 | 130.6 |
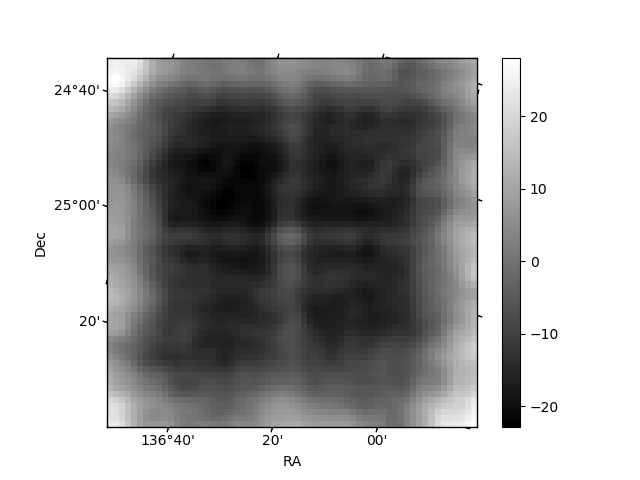
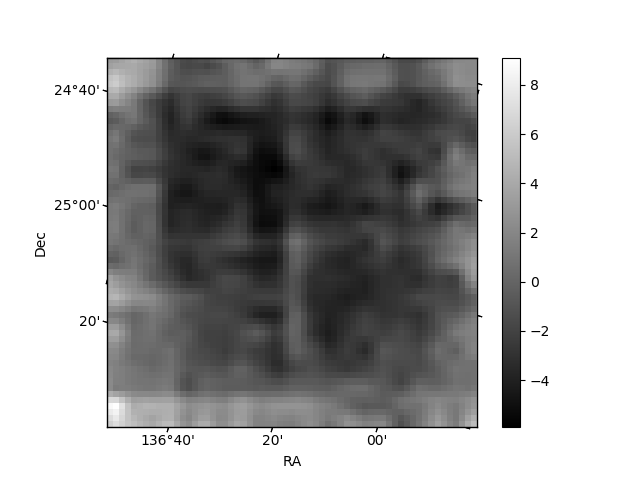
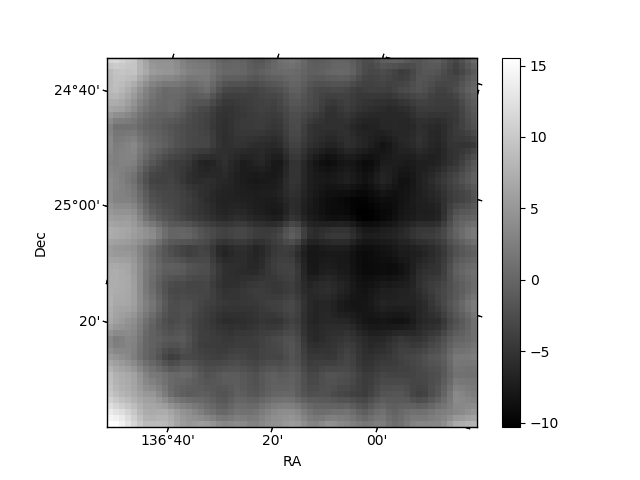
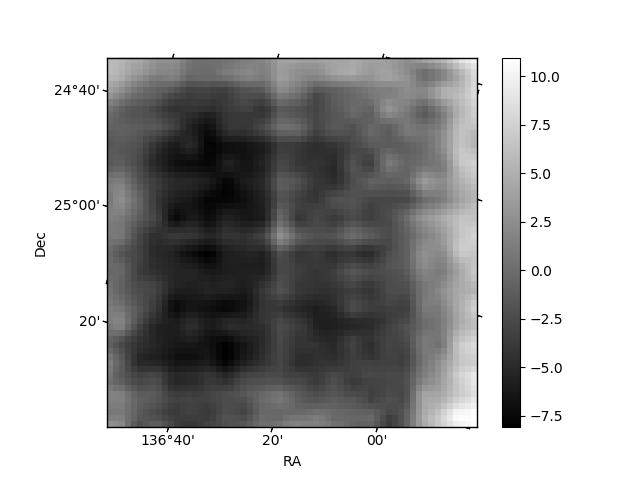
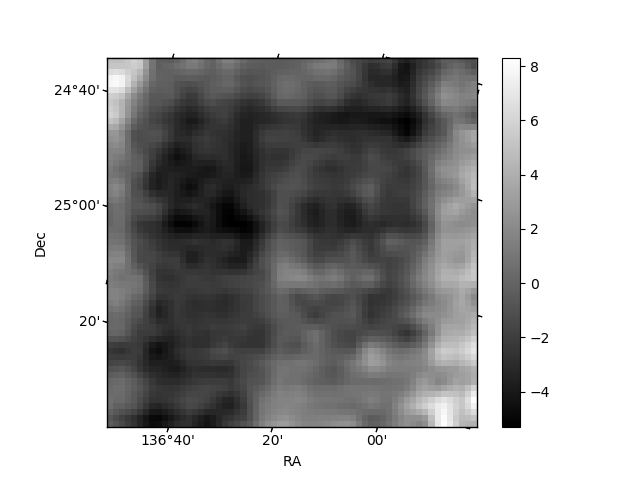
Histogram calculated using DETX and DETY for each event in the final _common_clean file
| Quadrant A | 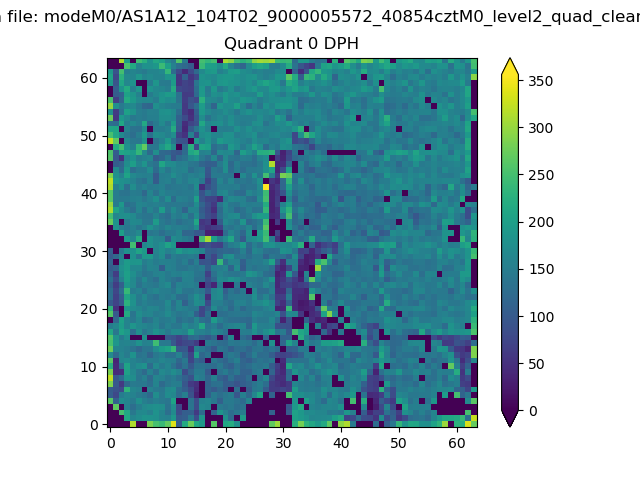 |
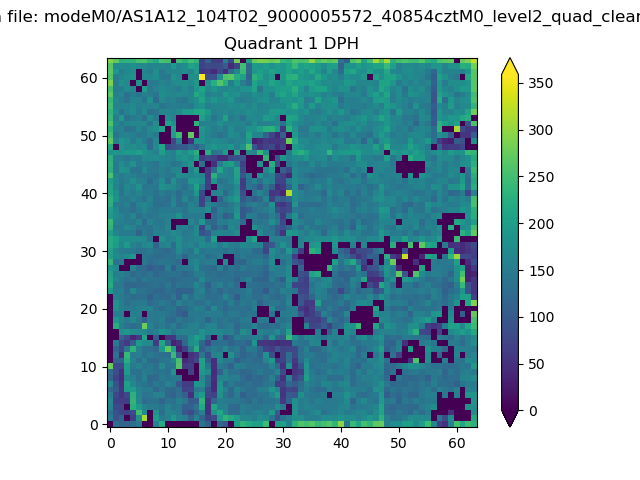 |
Quadrant B |
|---|---|---|---|
| Quadrant D | 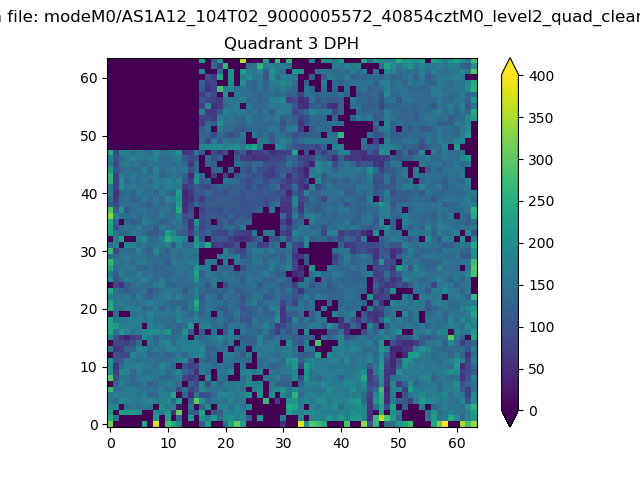 |
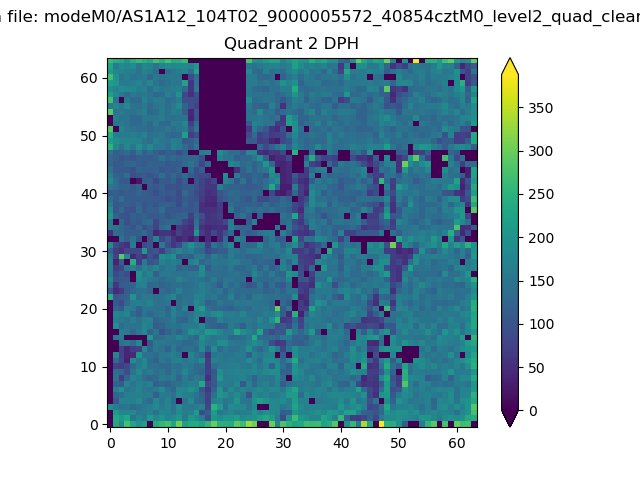 |
Quadrant C |
| Plot type | Count rate plots | Images |
|---|---|---|
| Comparison with Poisson distribution Blue bars denote a histogram of data divided into 1 sec bins. Red curve is a Poisson curve with rate = median count rate of data. |
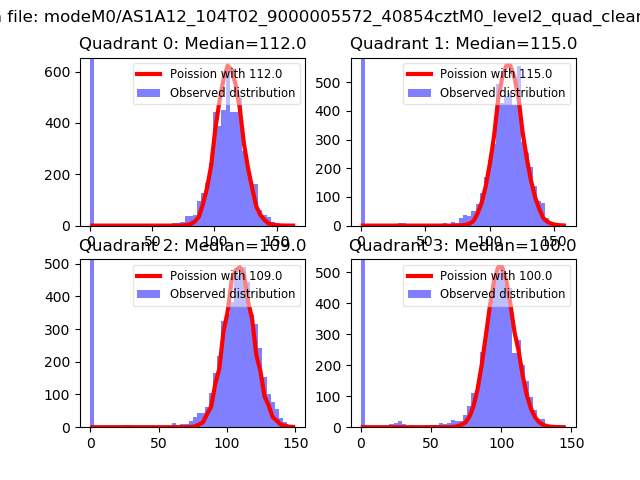 |
 |
| Quadrant-wise count rates Data is divided into 100 sec bins |
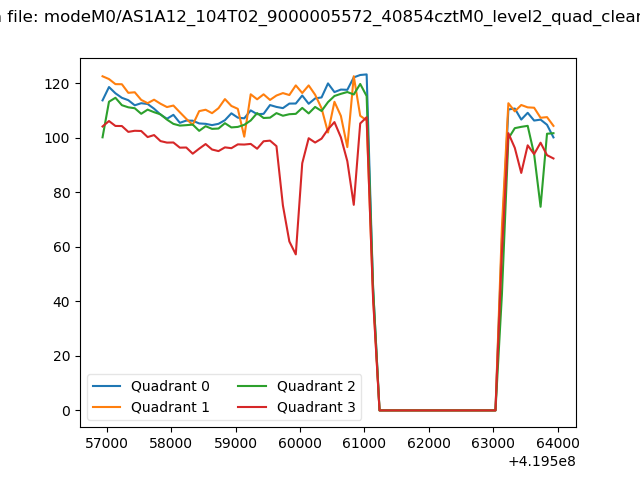 |
|
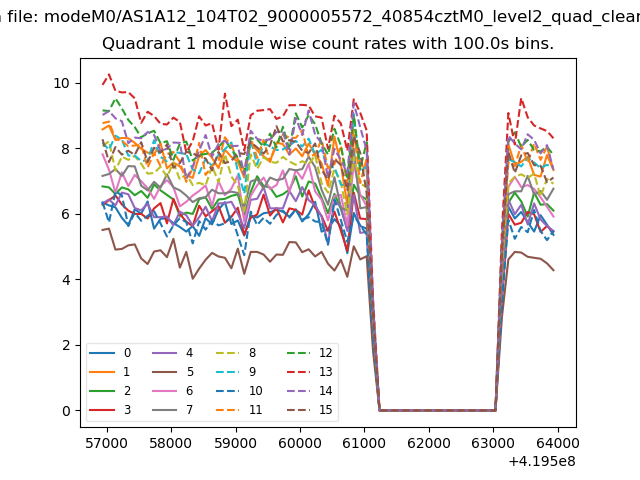
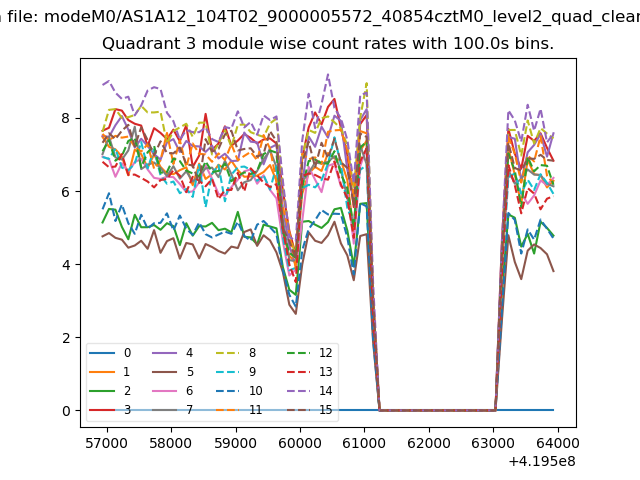
| Module-wise count rates for Quadrant A Data is divided into 100 sec bins |
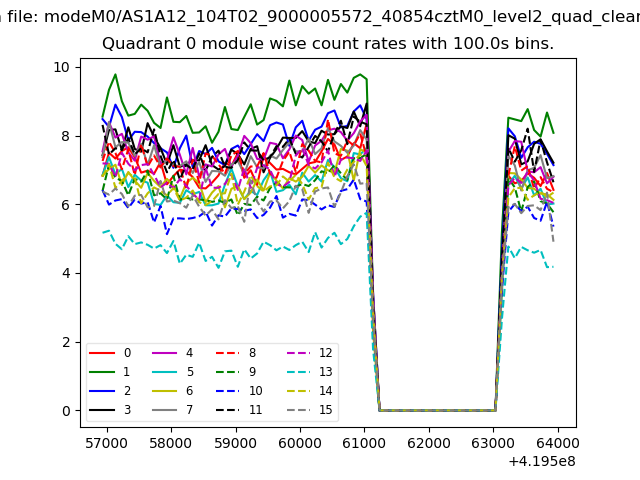 |
 |
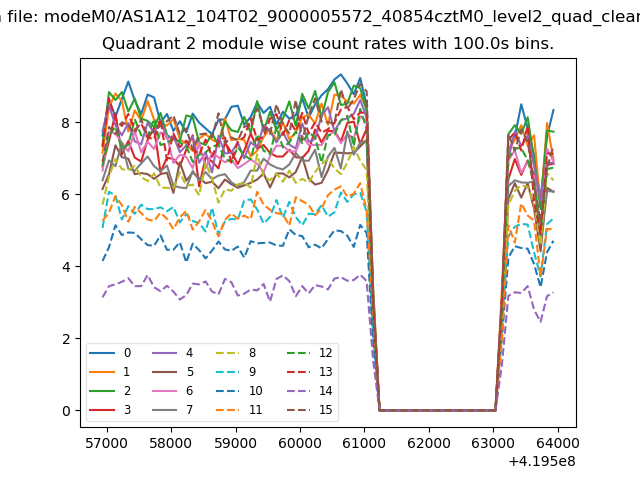
| Module-wise count rates for Quadrant B Data is divided into 100 sec bins |
 |
 |
| Module-wise count rates for Quadrant C Data is divided into 100 sec bins |
 |
 |
| Module-wise count rates for Quadrant D Data is divided into 100 sec bins |
 |
 |
| Parameter | Plot |
|---|---|
| CZT HV Monitor | 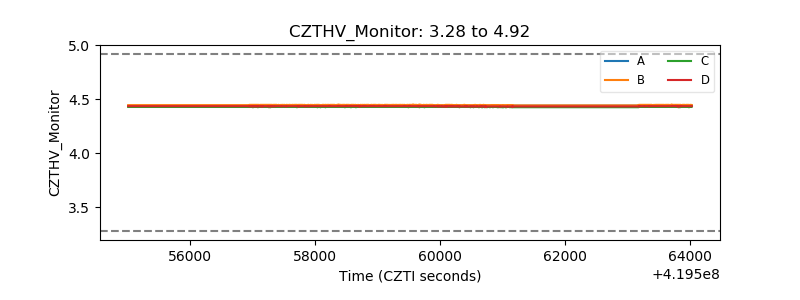 |
| D_VDD | 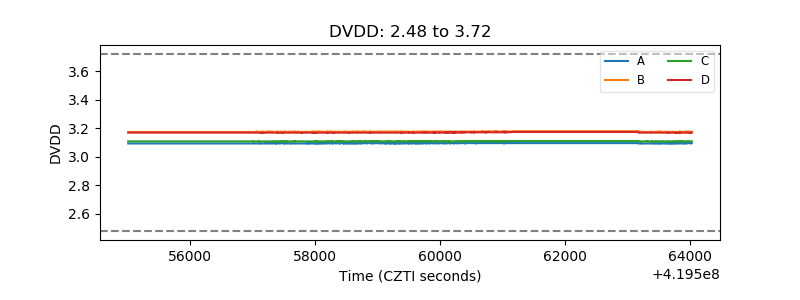 |
| Temperature 1 | 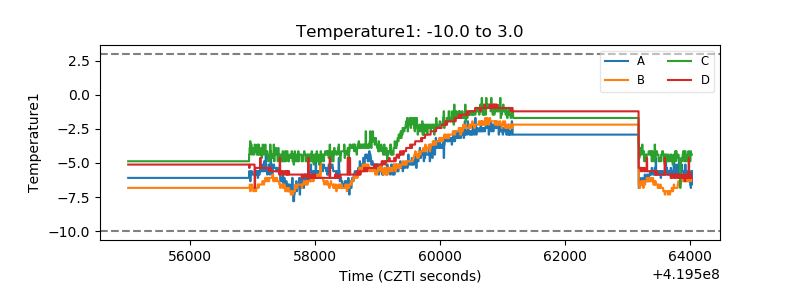 |
| Veto HV Monitor | 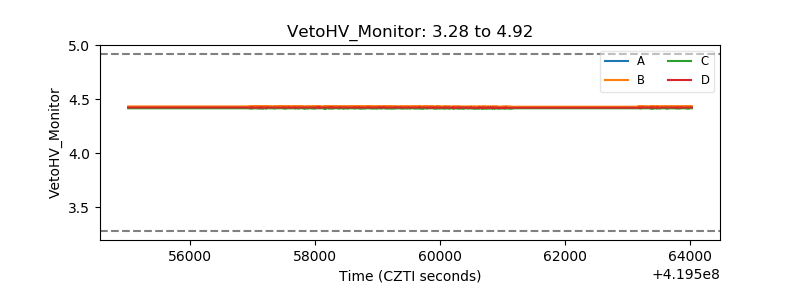 |
| Veto LLD | 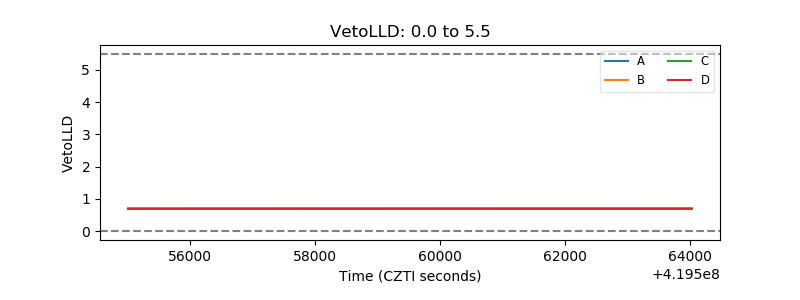 |
| Alpha Counter |  |
| _CPM_Rate |  |
| CZT Counter | 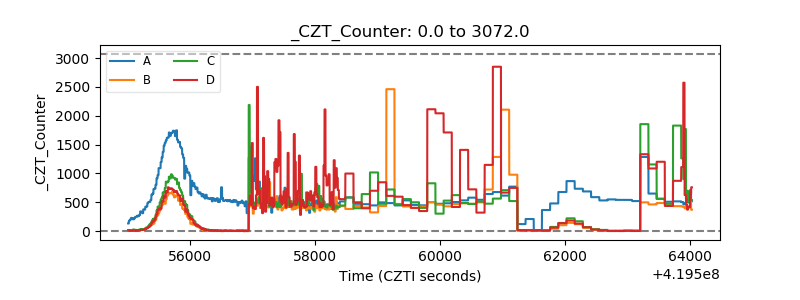 |
| +2.5 Volts monitor |  |
| +5 Volts monitor |  |
| _ROLL_ROT | 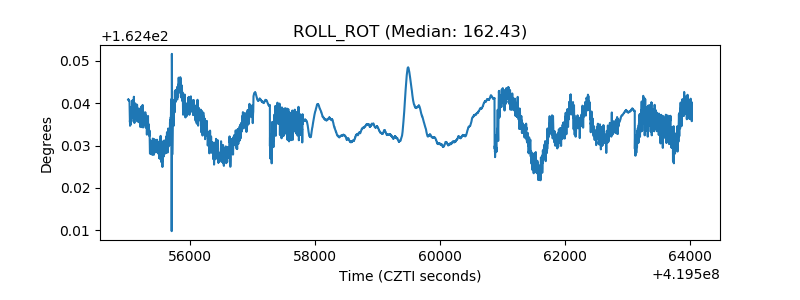 |
| _Roll_DEC | 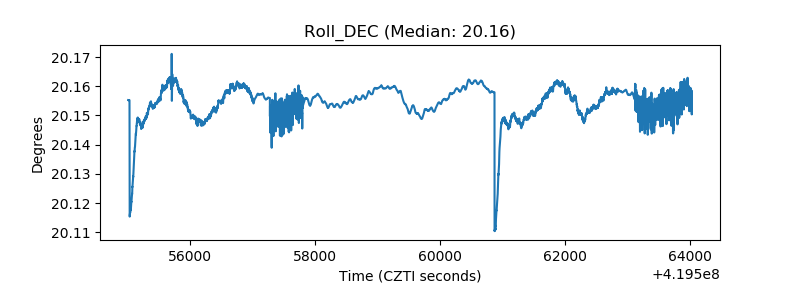 |
| _Roll_RA | 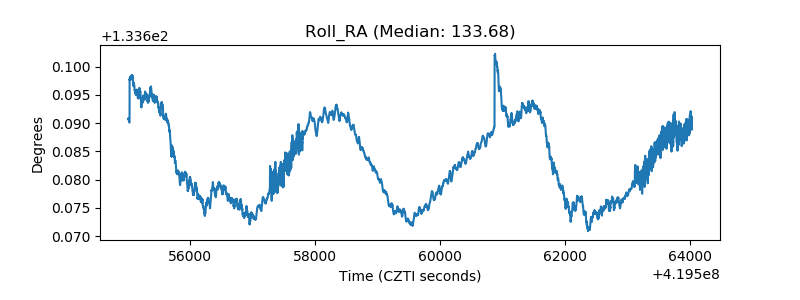 |
| Veto Counter | 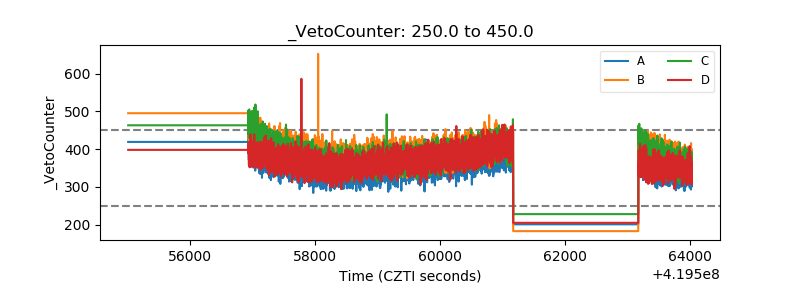 |