| Param | Original file | Final file |
|---|---|---|
| Filename | modeM0/AS1A12_104T02_9000005572_40855cztM0_level2.fits | modeM0/AS1A12_104T02_9000005572_40855cztM0_level2_quad_clean.evt |
| Size (bytes) | 467,161,920 | 84,637,440 |
| Size | 445.5 MB | 80.7 MB |
| Events in quadrant A | 3,009,766 | 585,076 |
| Events in quadrant B | 2,901,115 | 591,142 |
| Events in quadrant C | 4,446,532 | 528,801 |
| Events in quadrant D | 6,514,853 | 478,617 |
| Mode M9 | |||
|---|---|---|---|
| Quadrant | BADHDUFLAG | Total packets | Discarded packets |
| A | 0 | 30 | 0 |
| B | 0 | 30 | 0 |
| C | 0 | 30 | 0 |
| D | 0 | 31 | 0 |
| Mode M0 | |||
|---|---|---|---|
| Quadrant | BADHDUFLAG | Total packets | Discarded packets |
| A | 0 | 12145 | 3 |
| B | 0 | 12422 | 2 |
| C | 0 | 16709 | 2 |
| D | 0 | 23140 | 2 |
| Mode SS | |||
|---|---|---|---|
| Quadrant | BADHDUFLAG | Total packets | Discarded packets |
| A | 0 | 110 | 0 |
| B | 0 | 110 | 0 |
| C | 0 | 110 | 0 |
| D | 0 | 110 | 0 |
| Quadrant | Total seconds | Saturated seconds | Saturation percentage |
|---|---|---|---|
| A | 5415 | 20 | 0.369344% |
| B | 5415 | 160 | 2.954755% |
| C | 5415 | 537 | 9.916898% |
| D | 5415 | 764 | 14.108957% |
Noise dominated data is calculated using 1-second bins in cleaned event files. If a bin has >2000 counts, and if more than 50% of those come from <1% of pixels, then it is considered to be noise-dominated and hence unusable.
| Quadrant | # 1 sec bins | Bins with >0 counts | Bins with >2000 counts | High rate bins dominated by noise | Noise dominated (total time) | Noise dominated (detector-on time) | Marked lightcurve |
|---|---|---|---|---|---|---|---|
| A | 7118 | 5416 | 10 | 10 | 0.14% | 0.18% | 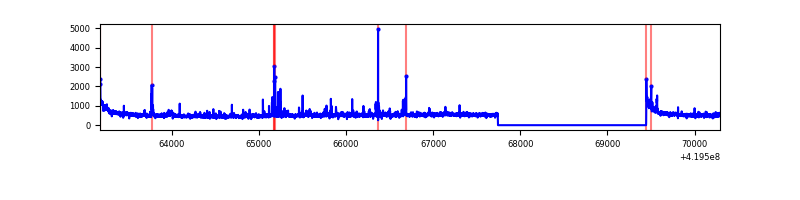 |
| B | 7118 | 5416 | 88 | 88 | 1.24% | 1.62% | 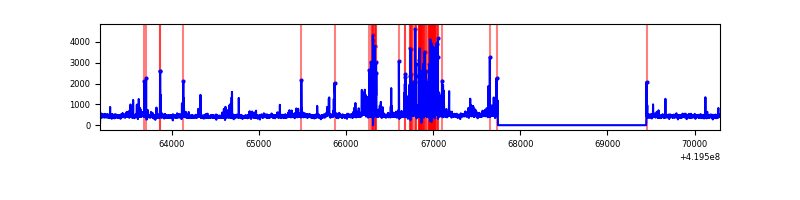 |
| C | 7118 | 5416 | 441 | 441 | 6.20% | 8.14% | 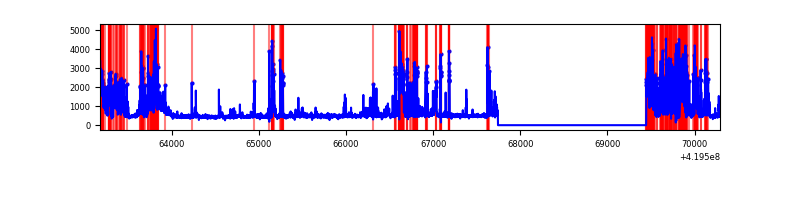 |
| D | 7118 | 5416 | 698 | 698 | 9.81% | 12.89% | 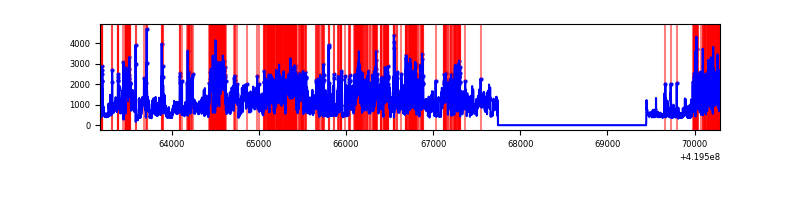 |
Top three noisy pixels from each quadrant. If the there are fewer than three noisy pixels in the level2.evt file, extra rows are filled as -1
| Pixel properties | Quadrant properties | ||||||
|---|---|---|---|---|---|---|---|
| Quadrant | DetID | PixID | Counts | Sigma | Mean | Median | Sigma |
| A | 10 | 83 | 514148 | 4211.18 | 592 | 579 | 122.0 |
| A | 13 | 248 | 103518 | 844.08 | 592 | 579 | 122.0 |
| A | 12 | 189 | 52787 | 428.1 | 592 | 579 | 122.0 |
| B | 4 | 171 | 546199 | 4813.39 | 581 | 565 | 113.4 |
| B | 0 | 190 | 38392 | 333.7 | 581 | 565 | 113.4 |
| B | 5 | 255 | 24174 | 208.27 | 581 | 565 | 113.4 |
| C | 14 | 254 | 1897943 | 14678.83 | 550 | 554 | 129.3 |
| C | 15 | 214 | 222587 | 1717.72 | 550 | 554 | 129.3 |
| C | 0 | 10 | 93801 | 721.39 | 550 | 554 | 129.3 |
| D | 13 | 249 | 2158815 | 15999.44 | 551 | 536 | 134.9 |
| D | 12 | 79 | 1926570 | 14277.8 | 551 | 536 | 134.9 |
| D | 2 | 249 | 166144 | 1227.66 | 551 | 536 | 134.9 |
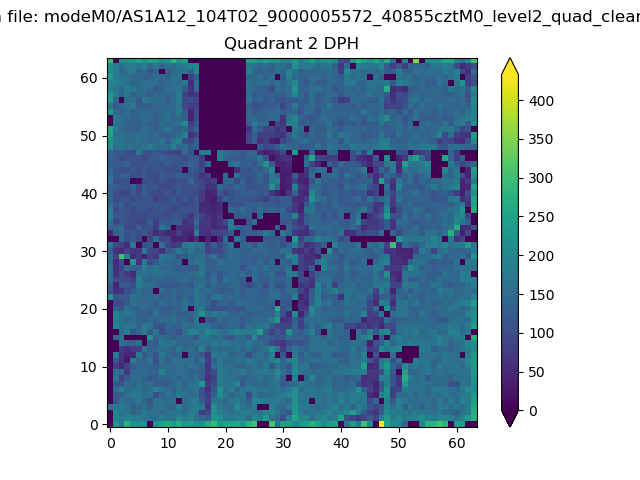
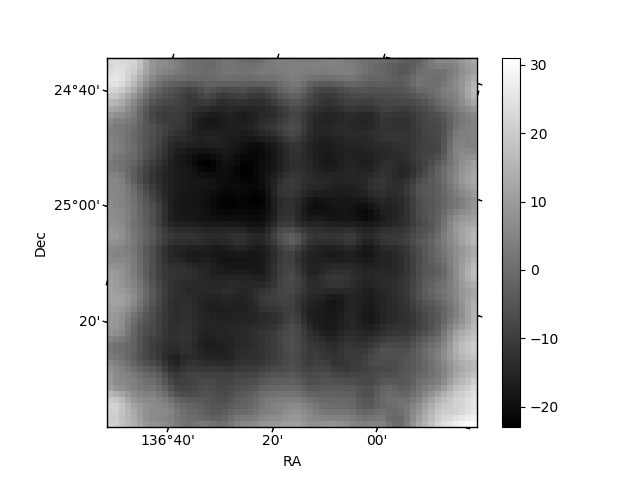
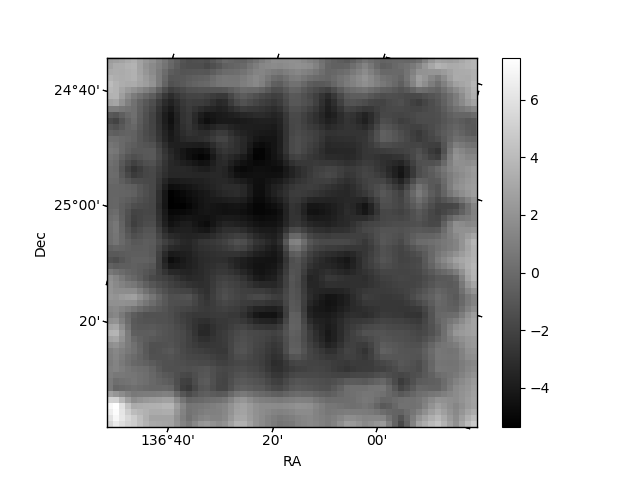
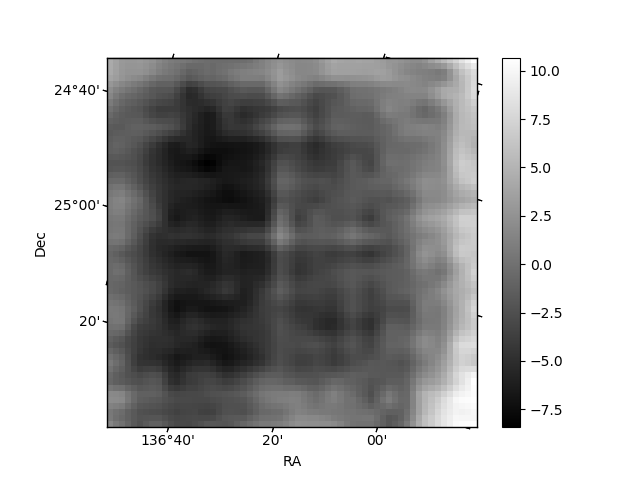
Histogram calculated using DETX and DETY for each event in the final _common_clean file
| Quadrant A | 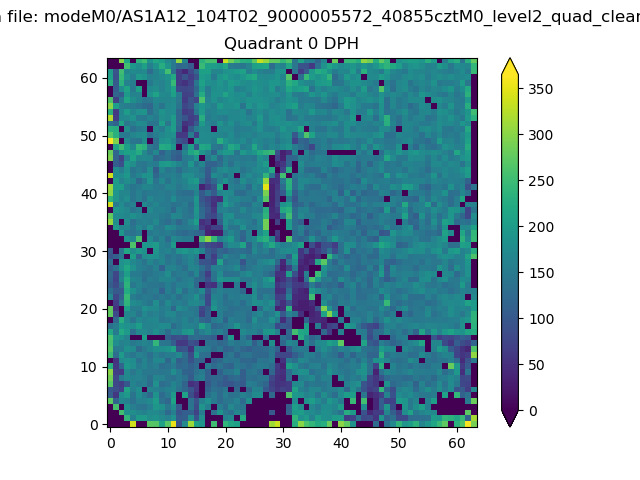 |
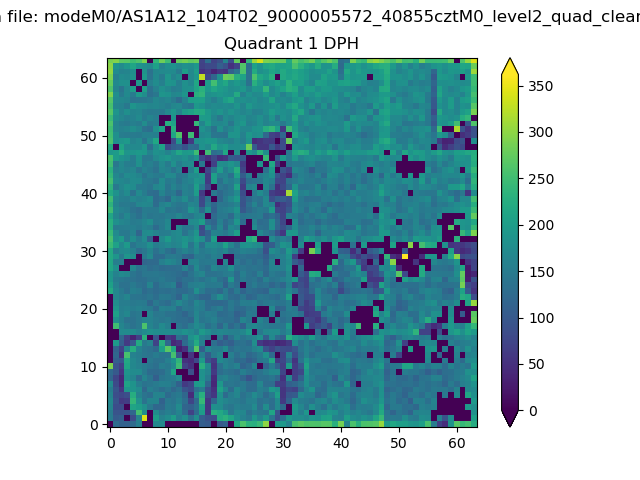 |
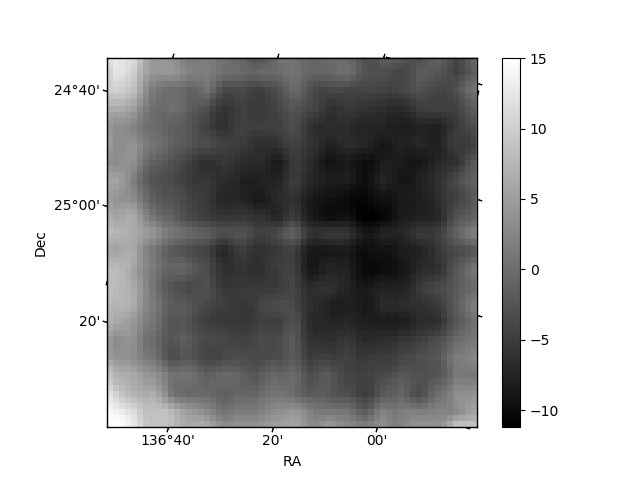
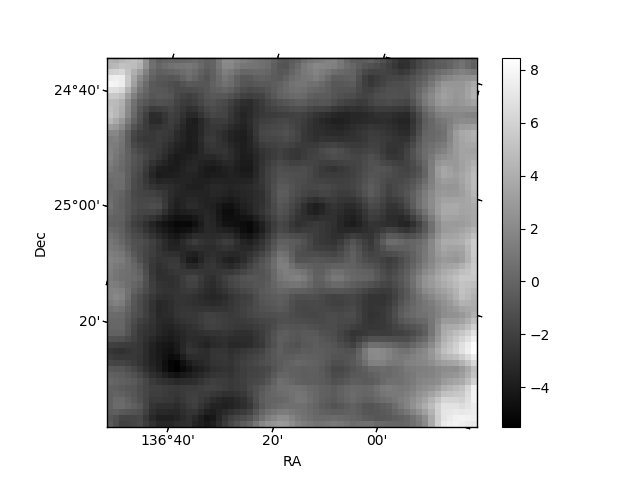
Quadrant B |
|---|---|---|---|
| Quadrant D | 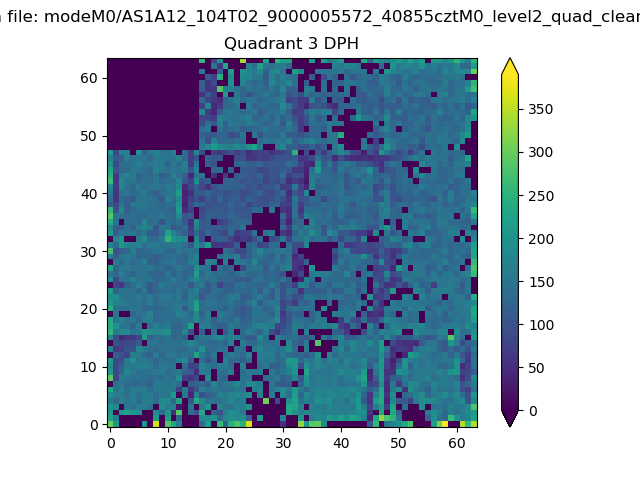 |
 |
Quadrant C |
| Plot type | Count rate plots | Images |
|---|---|---|
| Comparison with Poisson distribution Blue bars denote a histogram of data divided into 1 sec bins. Red curve is a Poisson curve with rate = median count rate of data. |
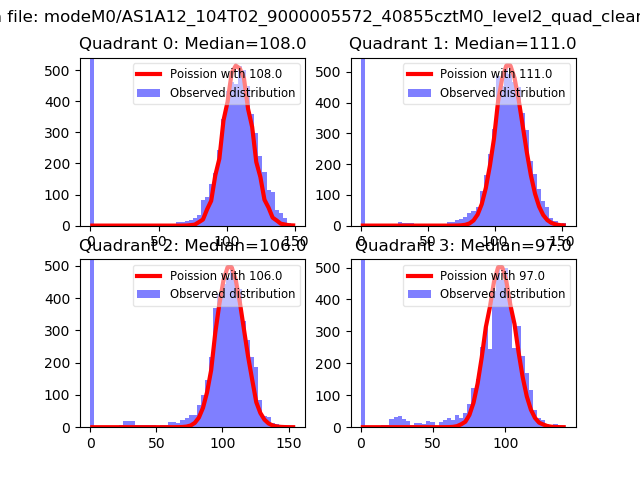 |
 |
| Quadrant-wise count rates Data is divided into 100 sec bins |
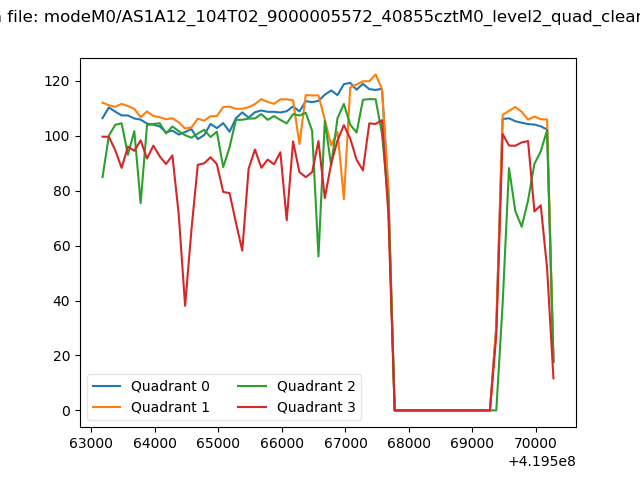 |
|
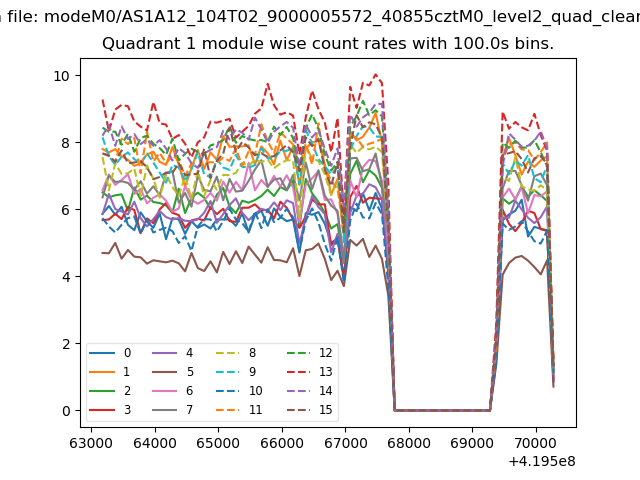
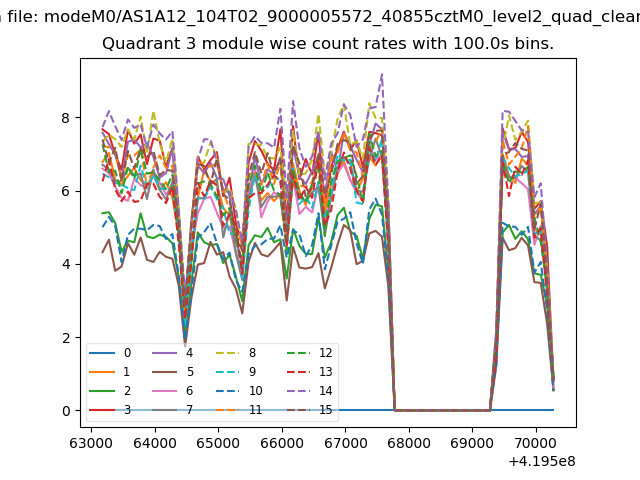
| Module-wise count rates for Quadrant A Data is divided into 100 sec bins |
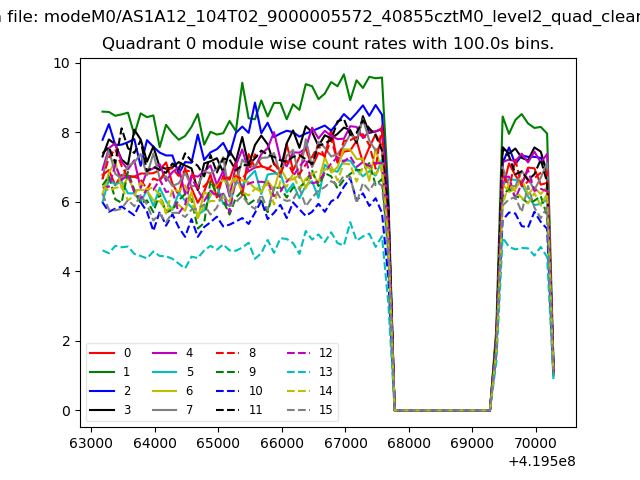 |
 |
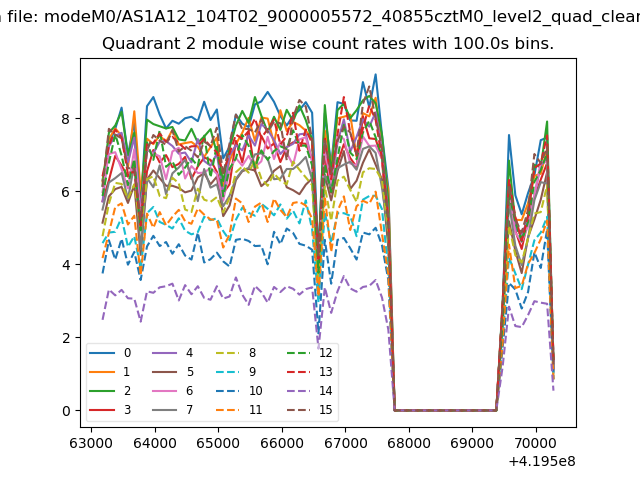
| Module-wise count rates for Quadrant B Data is divided into 100 sec bins |
 |
 |
| Module-wise count rates for Quadrant C Data is divided into 100 sec bins |
 |
 |
| Module-wise count rates for Quadrant D Data is divided into 100 sec bins |
 |
 |
| Parameter | Plot |
|---|---|
| CZT HV Monitor | 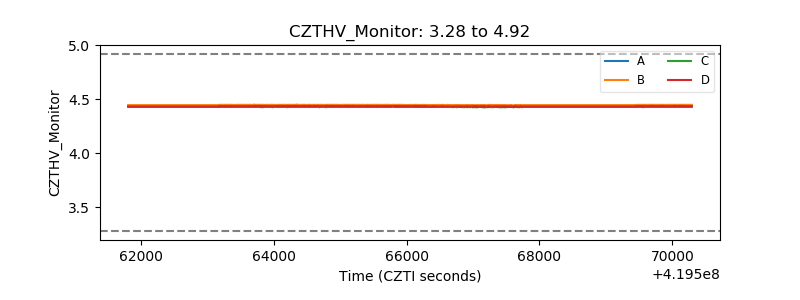 |
| D_VDD | 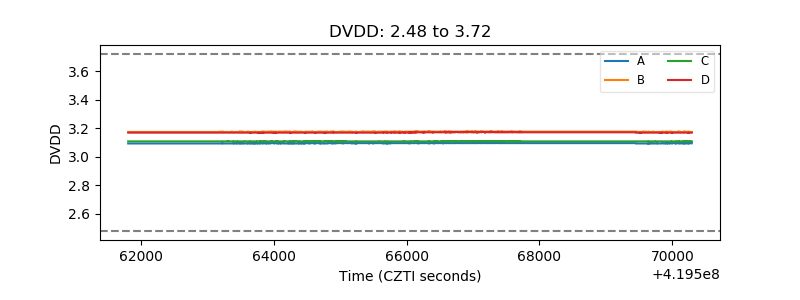 |
| Temperature 1 | 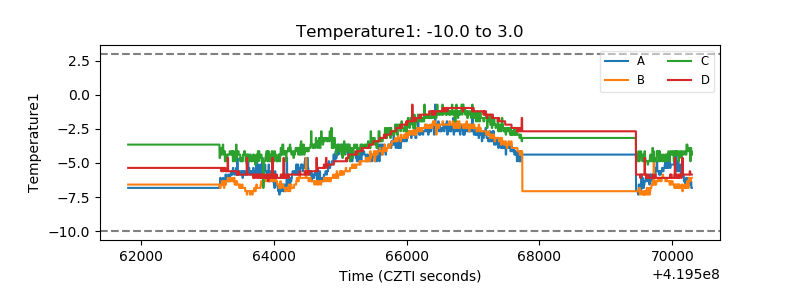 |
| Veto HV Monitor | 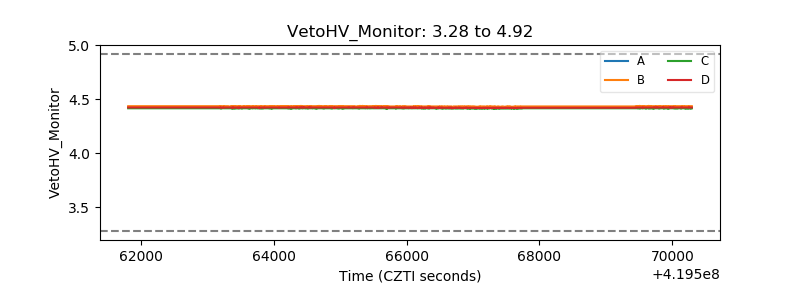 |
| Veto LLD | 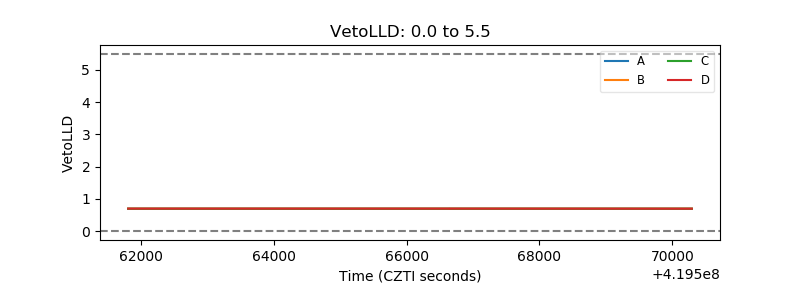 |
| Alpha Counter | 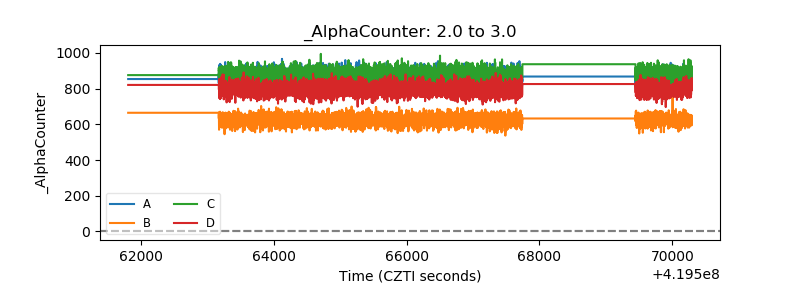 |
| _CPM_Rate | 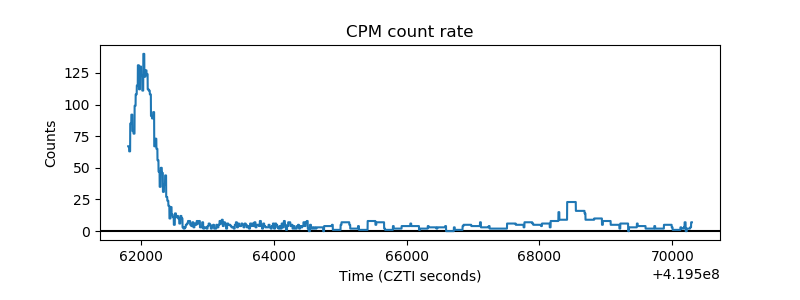 |
| CZT Counter | 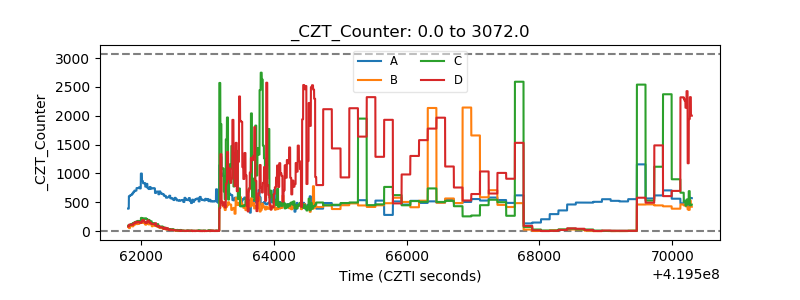 |
| +2.5 Volts monitor |  |
| +5 Volts monitor | 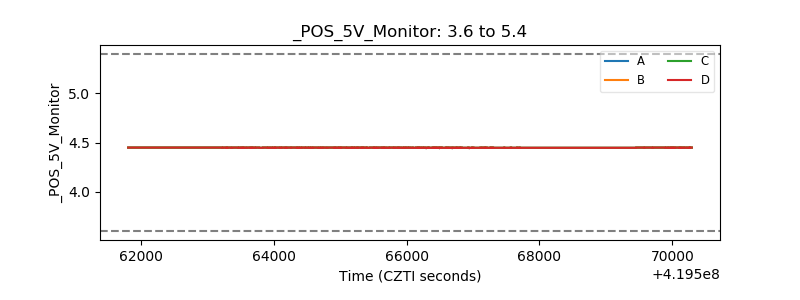 |
| _ROLL_ROT |  |
| _Roll_DEC | 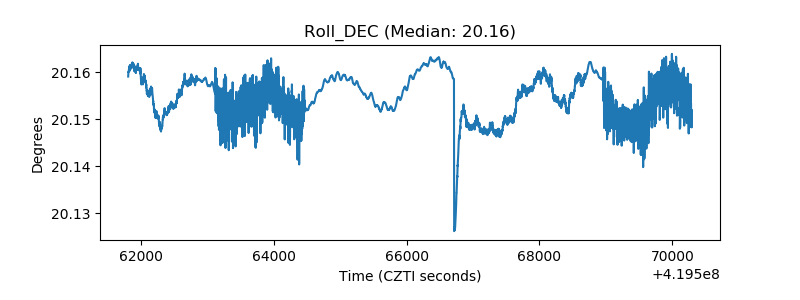 |
| _Roll_RA | 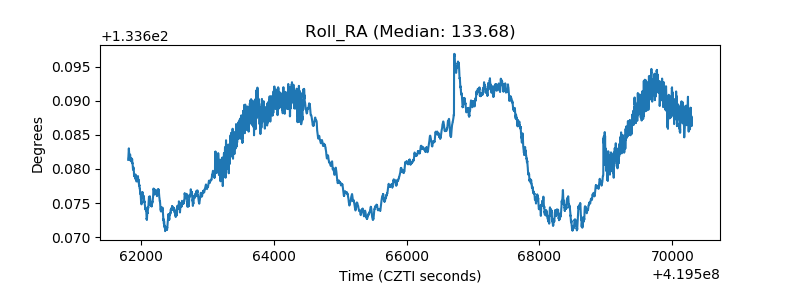 |
| Veto Counter | 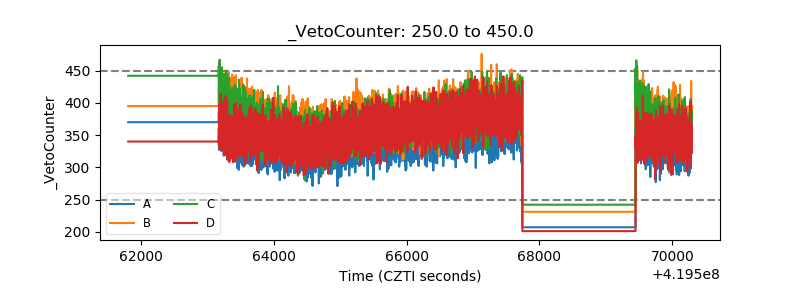 |