| Param | Original file | Final file |
|---|---|---|
| Filename | modeM0/AS1A12_104T02_9000005572_40856cztM0_level2.fits | modeM0/AS1A12_104T02_9000005572_40856cztM0_level2_quad_clean.evt |
| Size (bytes) | 495,555,840 | 89,049,600 |
| Size | 472.6 MB | 84.9 MB |
| Events in quadrant A | 3,136,052 | 621,765 |
| Events in quadrant B | 3,282,310 | 622,789 |
| Events in quadrant C | 5,379,402 | 536,859 |
| Events in quadrant D | 6,095,041 | 508,721 |
| Mode M9 | |||
|---|---|---|---|
| Quadrant | BADHDUFLAG | Total packets | Discarded packets |
| A | 0 | 29 | 0 |
| B | 0 | 29 | 0 |
| C | 0 | 29 | 0 |
| D | 0 | 30 | 0 |
| Mode M0 | |||
|---|---|---|---|
| Quadrant | BADHDUFLAG | Total packets | Discarded packets |
| A | 0 | 12676 | 3 |
| B | 0 | 13779 | 2 |
| C | 0 | 19733 | 2 |
| D | 0 | 22149 | 2 |
| Mode SS | |||
|---|---|---|---|
| Quadrant | BADHDUFLAG | Total packets | Discarded packets |
| A | 0 | 118 | 0 |
| B | 0 | 118 | 0 |
| C | 0 | 118 | 0 |
| D | 0 | 118 | 0 |
| Quadrant | Total seconds | Saturated seconds | Saturation percentage |
|---|---|---|---|
| A | 5807 | 13 | 0.223868% |
| B | 5807 | 228 | 3.926296% |
| C | 5807 | 836 | 14.396418% |
| D | 5807 | 766 | 13.190976% |
Noise dominated data is calculated using 1-second bins in cleaned event files. If a bin has >2000 counts, and if more than 50% of those come from <1% of pixels, then it is considered to be noise-dominated and hence unusable.
| Quadrant | # 1 sec bins | Bins with >0 counts | Bins with >2000 counts | High rate bins dominated by noise | Noise dominated (total time) | Noise dominated (detector-on time) | Marked lightcurve |
|---|---|---|---|---|---|---|---|
| A | 7210 | 5808 | 5 | 5 | 0.07% | 0.09% | 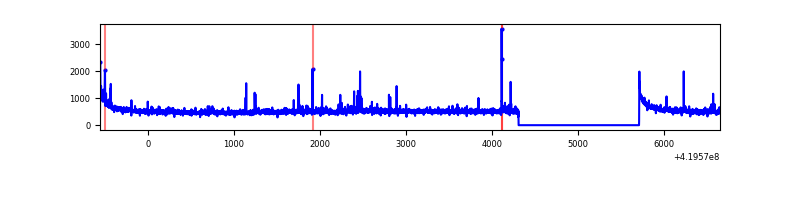 |
| B | 7210 | 5808 | 143 | 143 | 1.98% | 2.46% | 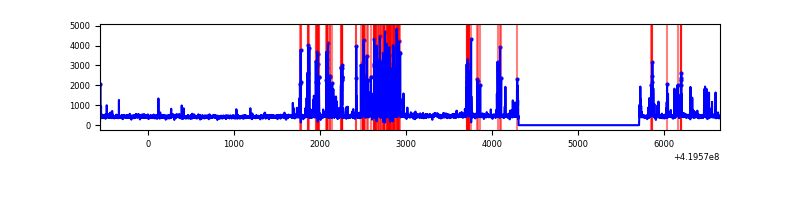 |
| C | 7210 | 5807 | 671 | 671 | 9.31% | 11.56% | 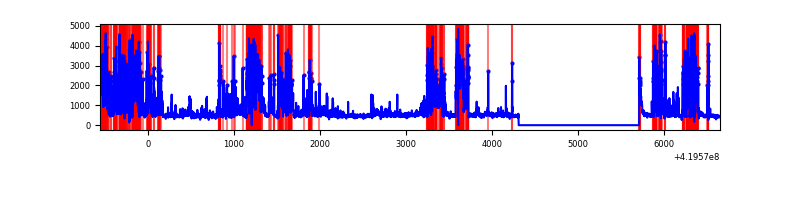 |
| D | 7210 | 5808 | 637 | 637 | 8.83% | 10.97% | 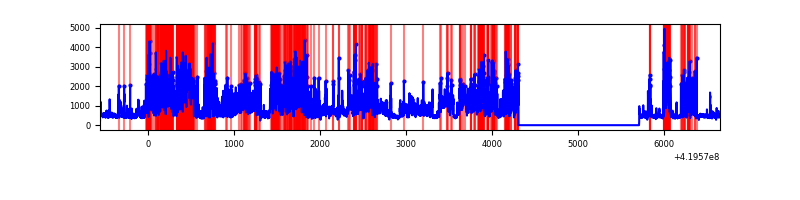 |
Top three noisy pixels from each quadrant. If the there are fewer than three noisy pixels in the level2.evt file, extra rows are filled as -1
| Pixel properties | Quadrant properties | ||||||
|---|---|---|---|---|---|---|---|
| Quadrant | DetID | PixID | Counts | Sigma | Mean | Median | Sigma |
| A | 10 | 83 | 535639 | 4119.01 | 634 | 620 | 129.9 |
| A | 13 | 248 | 80915 | 618.17 | 634 | 620 | 129.9 |
| A | 12 | 189 | 50874 | 386.89 | 634 | 620 | 129.9 |
| B | 4 | 171 | 778491 | 6398.9 | 620 | 602 | 121.6 |
| B | 0 | 190 | 22484 | 180.0 | 620 | 602 | 121.6 |
| B | 5 | 255 | 18547 | 147.62 | 620 | 602 | 121.6 |
| C | 14 | 254 | 2754456 | 20374.06 | 575 | 580 | 135.2 |
| C | 15 | 214 | 231037 | 1704.99 | 575 | 580 | 135.2 |
| C | 0 | 10 | 62737 | 459.85 | 575 | 580 | 135.2 |
| D | 13 | 249 | 2181166 | 14972.08 | 591 | 573 | 145.6 |
| D | 12 | 79 | 1118805 | 7677.85 | 591 | 573 | 145.6 |
| D | 1 | 47 | 253136 | 1734.11 | 591 | 573 | 145.6 |
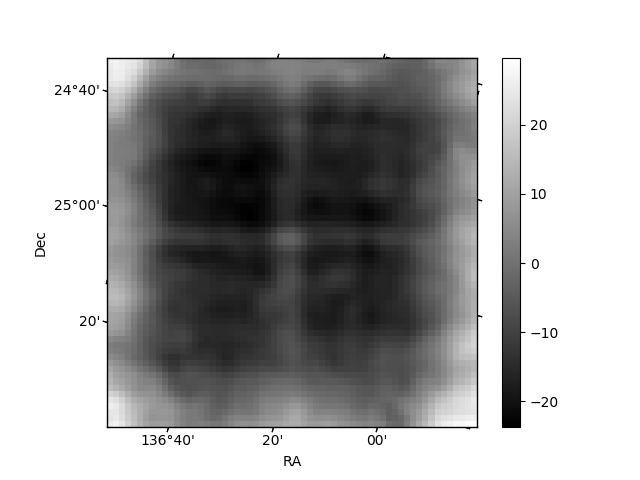
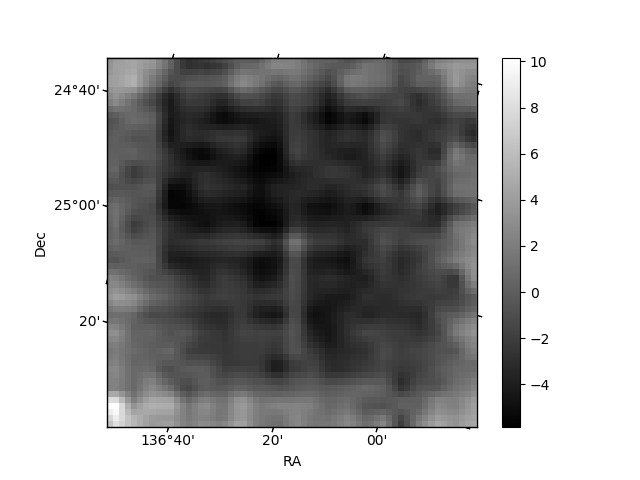
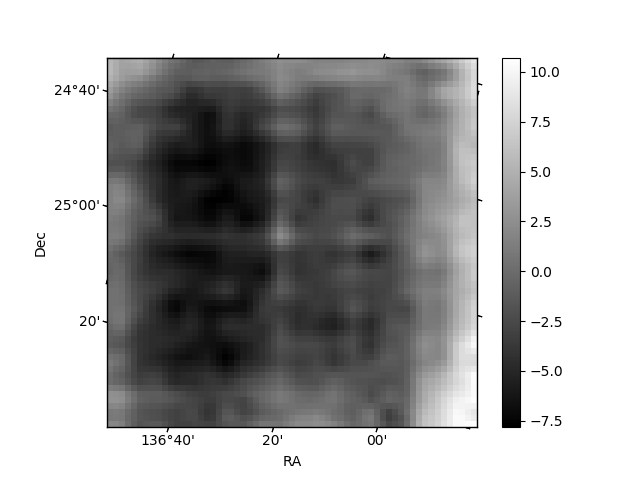
Histogram calculated using DETX and DETY for each event in the final _common_clean file
| Quadrant A | 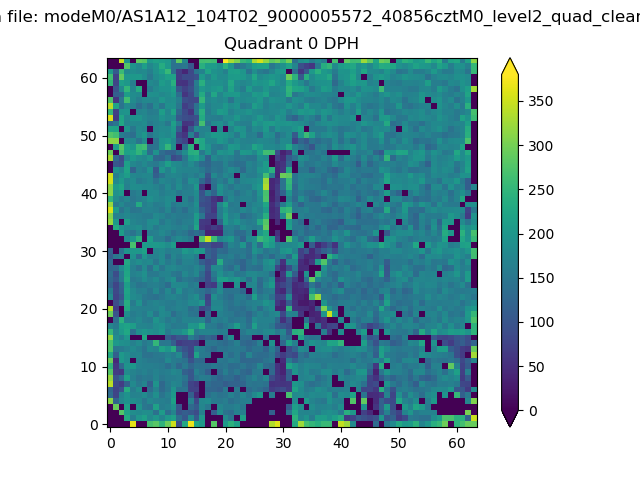 |
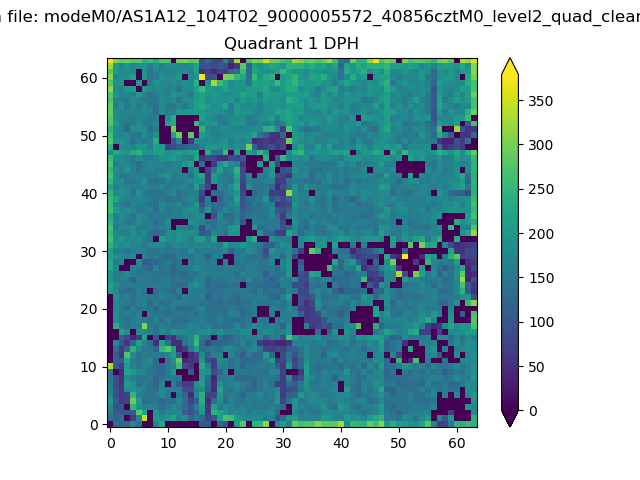 |
Quadrant B |
|---|---|---|---|
| Quadrant D | 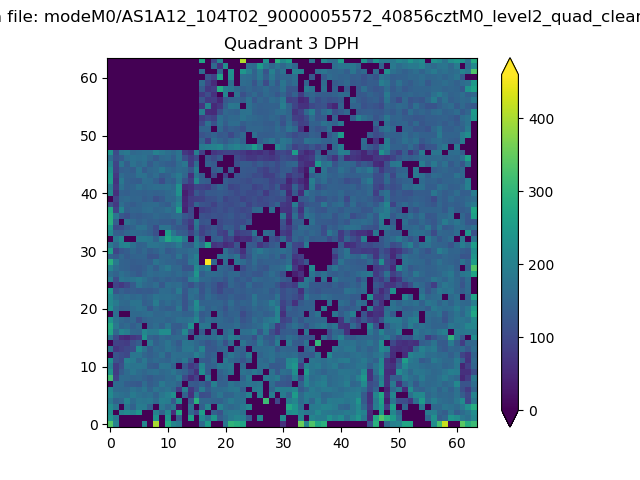 |
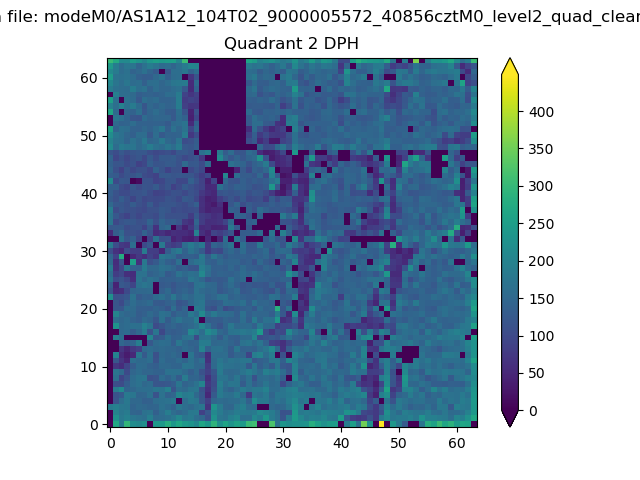 |
Quadrant C |
| Plot type | Count rate plots | Images |
|---|---|---|
| Comparison with Poisson distribution Blue bars denote a histogram of data divided into 1 sec bins. Red curve is a Poisson curve with rate = median count rate of data. |
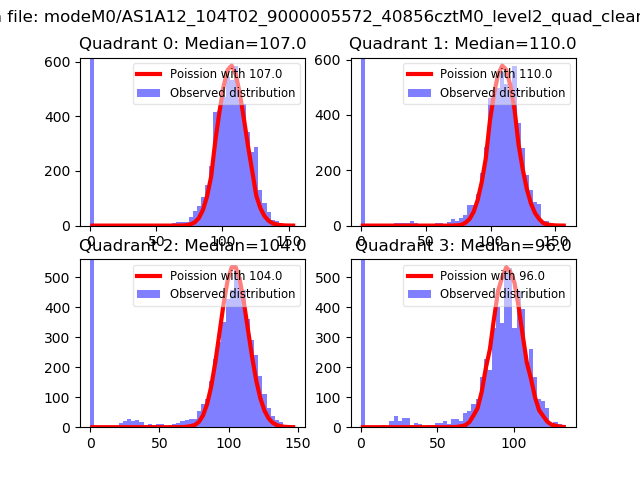 |
 |
| Quadrant-wise count rates Data is divided into 100 sec bins |
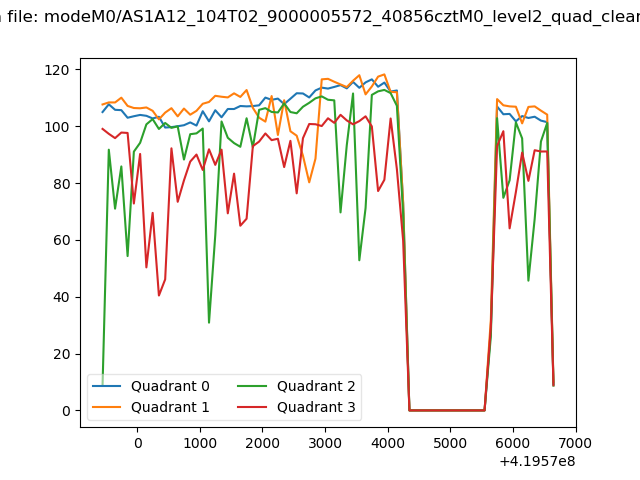 |
|
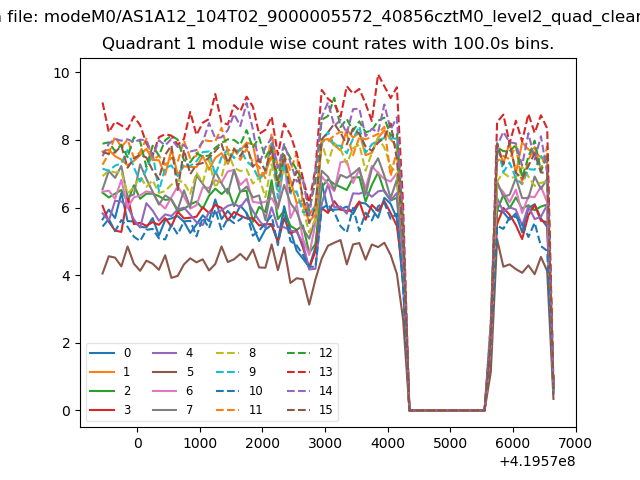
| Module-wise count rates for Quadrant A Data is divided into 100 sec bins |
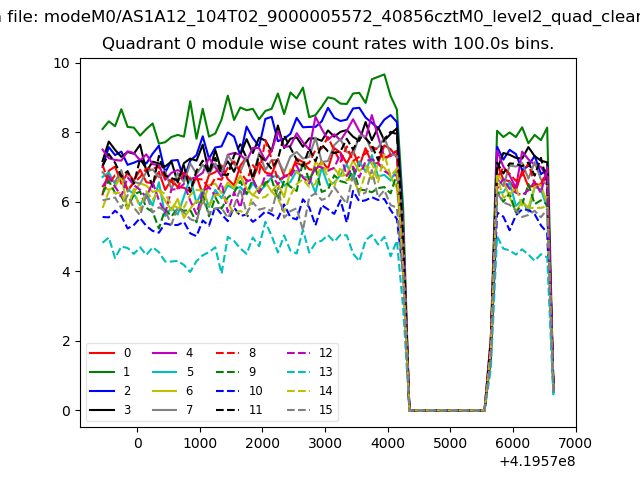 |
 |
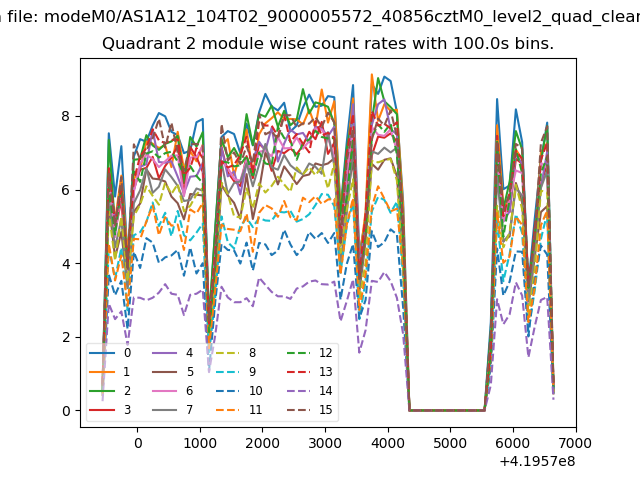
| Module-wise count rates for Quadrant B Data is divided into 100 sec bins |
 |
 |
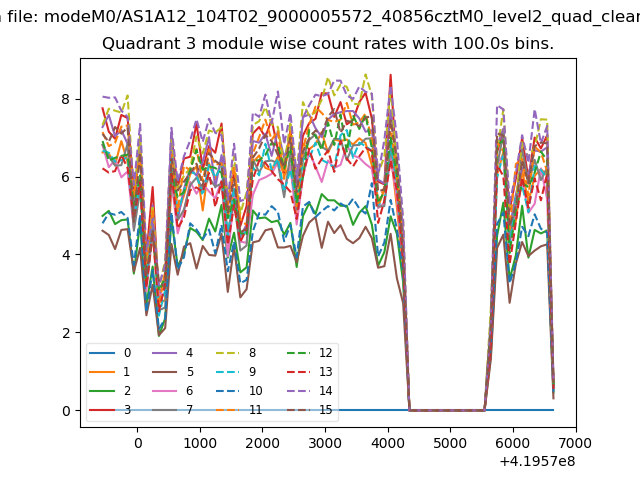
| Module-wise count rates for Quadrant C Data is divided into 100 sec bins |
 |
 |
| Module-wise count rates for Quadrant D Data is divided into 100 sec bins |
 |
 |
| Parameter | Plot |
|---|---|
| CZT HV Monitor |  |
| D_VDD | 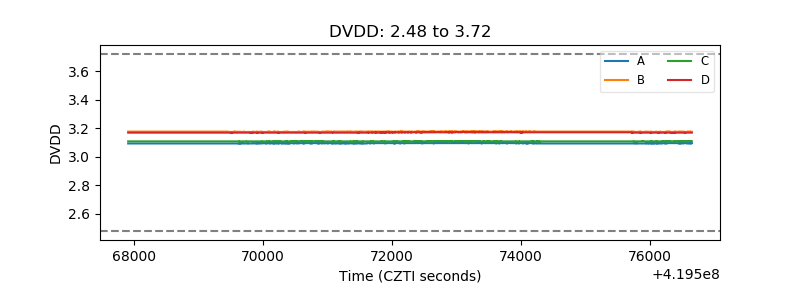 |
| Temperature 1 | 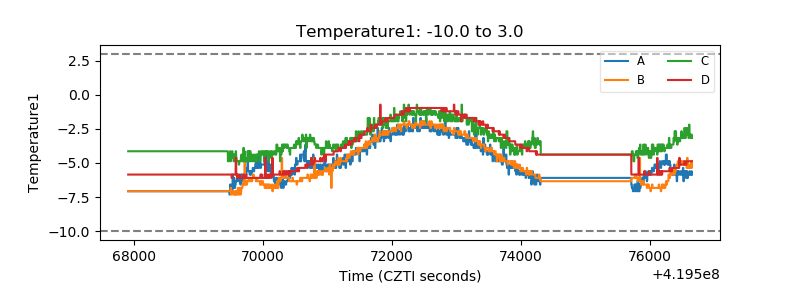 |
| Veto HV Monitor | 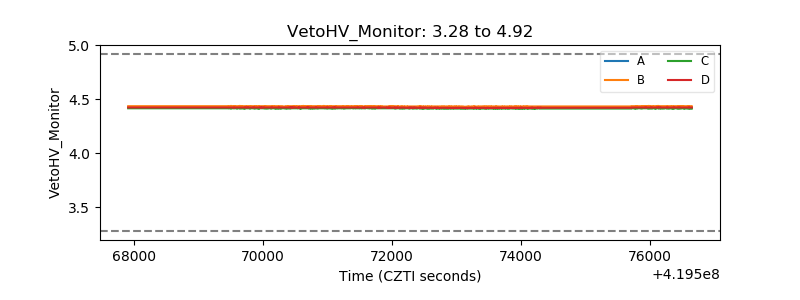 |
| Veto LLD | 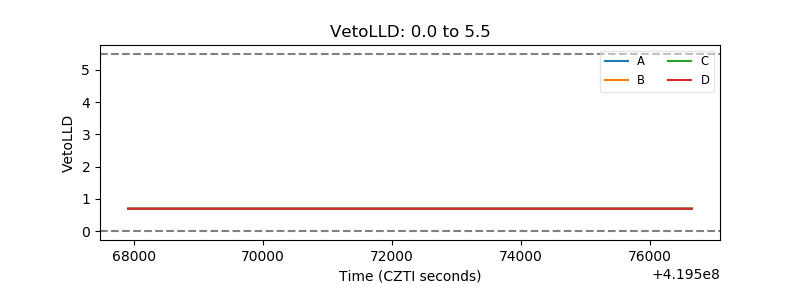 |
| Alpha Counter | 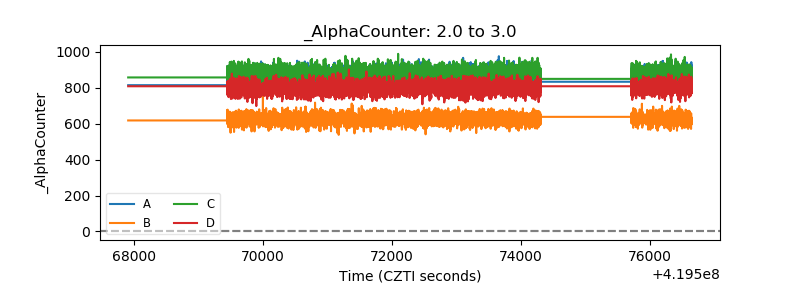 |
| _CPM_Rate |  |
| CZT Counter | 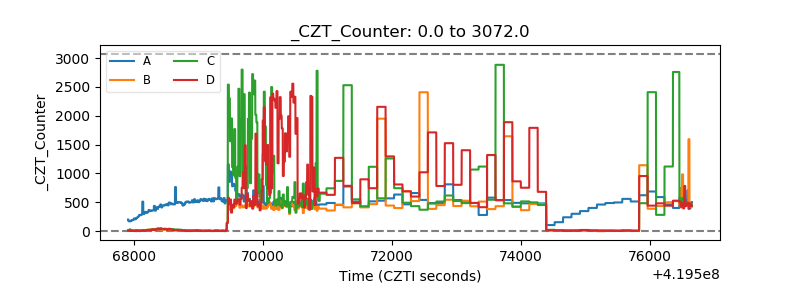 |
| +2.5 Volts monitor |  |
| +5 Volts monitor | 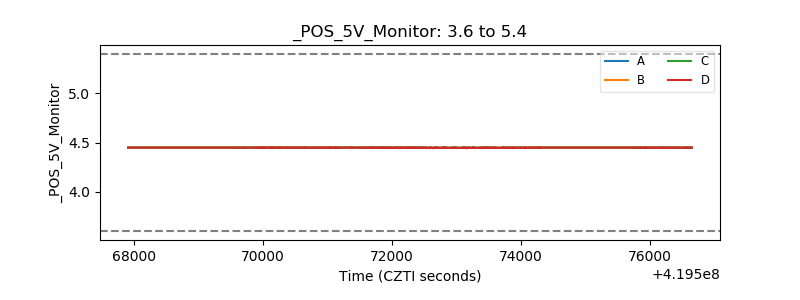 |
| _ROLL_ROT | 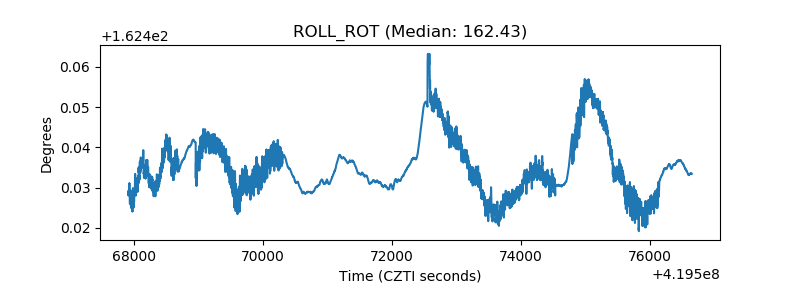 |
| _Roll_DEC | 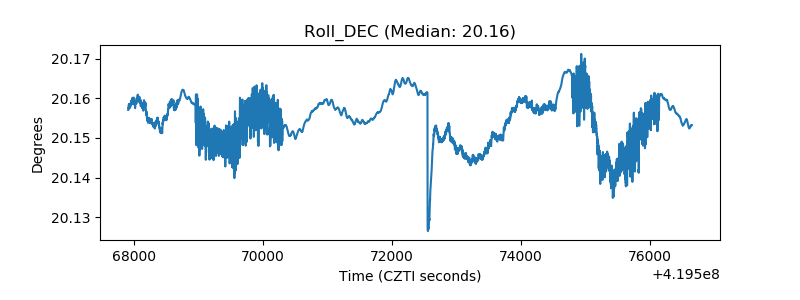 |
| _Roll_RA | 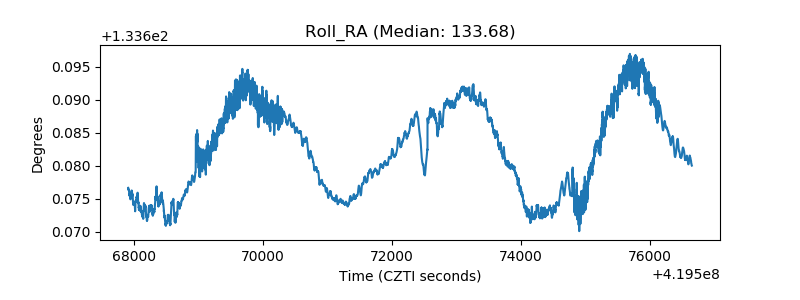 |
| Veto Counter | 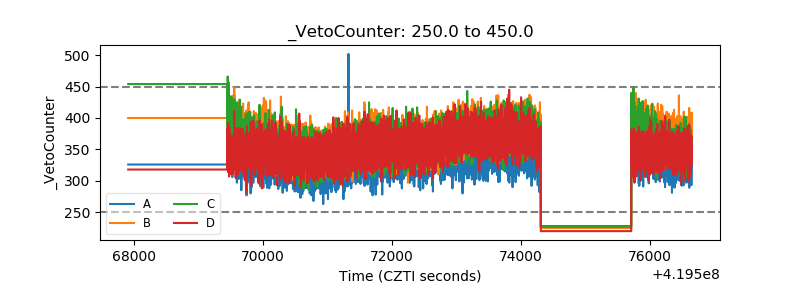 |