| Param | Original file | Final file |
|---|---|---|
| Filename | modeM0/AS1A12_104T02_9000005572_40860cztM0_level2.fits | modeM0/AS1A12_104T02_9000005572_40860cztM0_level2_quad_clean.evt |
| Size (bytes) | 1,164,502,080 | 249,027,840 |
| Size | 1.1 GB | 237.5 MB |
| Events in quadrant A | 8,624,227 | 1,697,702 |
| Events in quadrant B | 9,973,490 | 1,699,307 |
| Events in quadrant C | 9,709,878 | 1,567,545 |
| Events in quadrant D | 13,557,815 | 1,468,174 |
| Mode M9 | |||
|---|---|---|---|
| Quadrant | BADHDUFLAG | Total packets | Discarded packets |
| A | 0 | 55 | 0 |
| B | 0 | 55 | 0 |
| C | 0 | 55 | 0 |
| D | 0 | 55 | 0 |
| Mode M0 | |||
|---|---|---|---|
| Quadrant | BADHDUFLAG | Total packets | Discarded packets |
| A | 0 | 35157 | 5 |
| B | 0 | 40772 | 4 |
| C | 0 | 38864 | 4 |
| D | 0 | 51208 | 4 |
| Mode SS | |||
|---|---|---|---|
| Quadrant | BADHDUFLAG | Total packets | Discarded packets |
| A | 0 | 330 | 0 |
| B | 0 | 330 | 0 |
| C | 0 | 330 | 0 |
| D | 0 | 330 | 0 |
| Quadrant | Total seconds | Saturated seconds | Saturation percentage |
|---|---|---|---|
| A | 16040 | 39 | 0.243142% |
| B | 16040 | 631 | 3.933915% |
| C | 16040 | 805 | 5.018703% |
| D | 16040 | 1077 | 6.714464% |
Noise dominated data is calculated using 1-second bins in cleaned event files. If a bin has >2000 counts, and if more than 50% of those come from <1% of pixels, then it is considered to be noise-dominated and hence unusable.
| Quadrant | # 1 sec bins | Bins with >0 counts | Bins with >2000 counts | High rate bins dominated by noise | Noise dominated (total time) | Noise dominated (detector-on time) | Marked lightcurve |
|---|---|---|---|---|---|---|---|
| A | 21558 | 16044 | 19 | 19 | 0.09% | 0.12% | 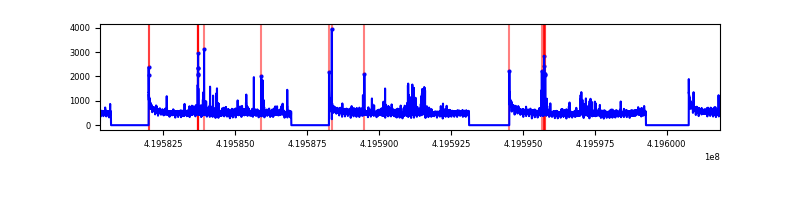 |
| B | 21558 | 16043 | 356 | 356 | 1.65% | 2.22% | 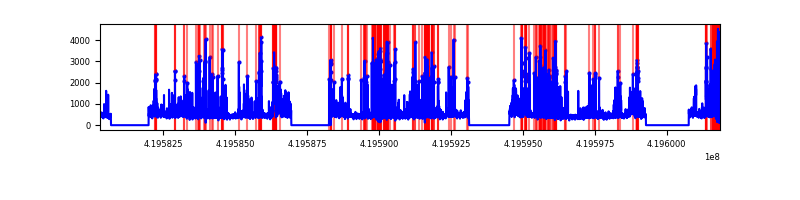 |
| C | 21558 | 16044 | 678 | 678 | 3.15% | 4.23% | 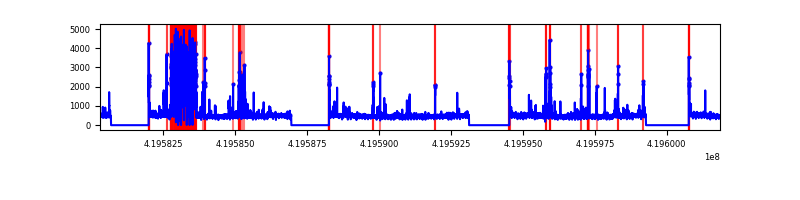 |
| D | 21558 | 16044 | 949 | 949 | 4.40% | 5.91% | 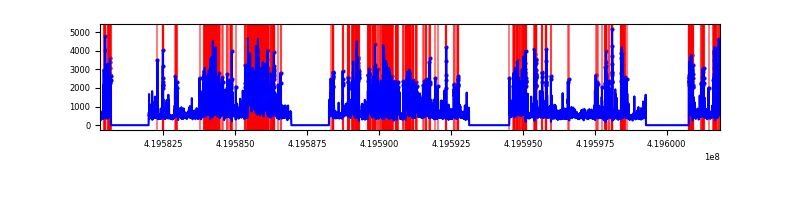 |
Top three noisy pixels from each quadrant. If the there are fewer than three noisy pixels in the level2.evt file, extra rows are filled as -1
| Pixel properties | Quadrant properties | ||||||
|---|---|---|---|---|---|---|---|
| Quadrant | DetID | PixID | Counts | Sigma | Mean | Median | Sigma |
| A | 10 | 83 | 1333850 | 3715.31 | 1757 | 1718 | 358.6 |
| A | 12 | 189 | 252108 | 698.34 | 1757 | 1718 | 358.6 |
| A | 13 | 248 | 119521 | 328.55 | 1757 | 1718 | 358.6 |
| B | 4 | 171 | 2887220 | 8733.51 | 1720 | 1670 | 330.4 |
| B | 0 | 229 | 153632 | 459.93 | 1720 | 1670 | 330.4 |
| B | 0 | 190 | 82016 | 243.18 | 1720 | 1670 | 330.4 |
| C | 14 | 254 | 2284563 | 5936.78 | 1655 | 1664 | 384.5 |
| C | 15 | 214 | 649343 | 1684.32 | 1655 | 1664 | 384.5 |
| C | 0 | 10 | 159083 | 409.37 | 1655 | 1664 | 384.5 |
| D | 12 | 79 | 3030661 | 7492.36 | 1665 | 1622 | 404.3 |
| D | 13 | 249 | 1974103 | 4878.95 | 1665 | 1622 | 404.3 |
| D | 2 | 249 | 1262148 | 3117.92 | 1665 | 1622 | 404.3 |
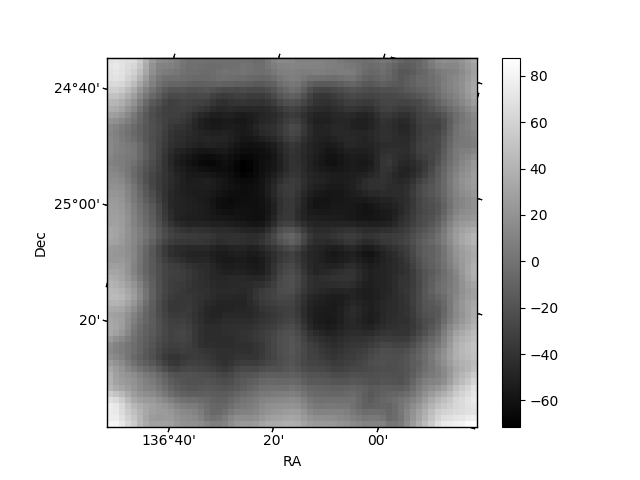
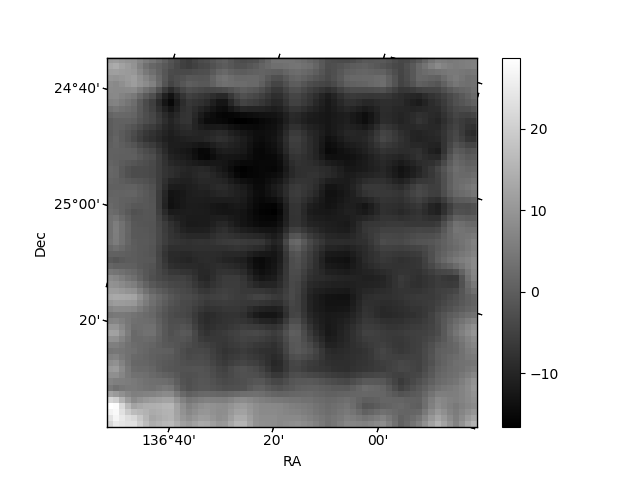
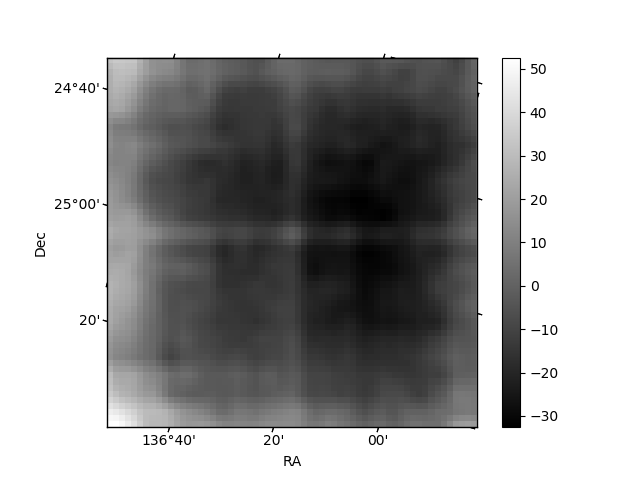
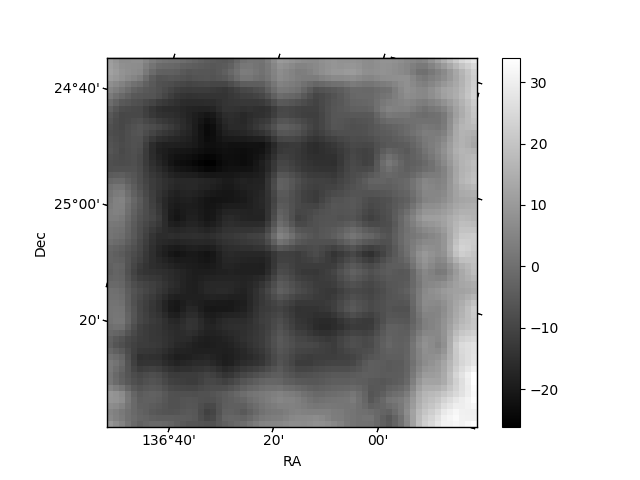
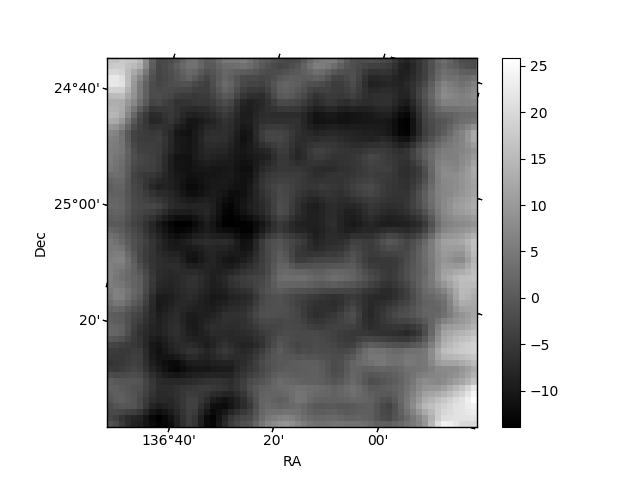
Histogram calculated using DETX and DETY for each event in the final _common_clean file
| Quadrant A | 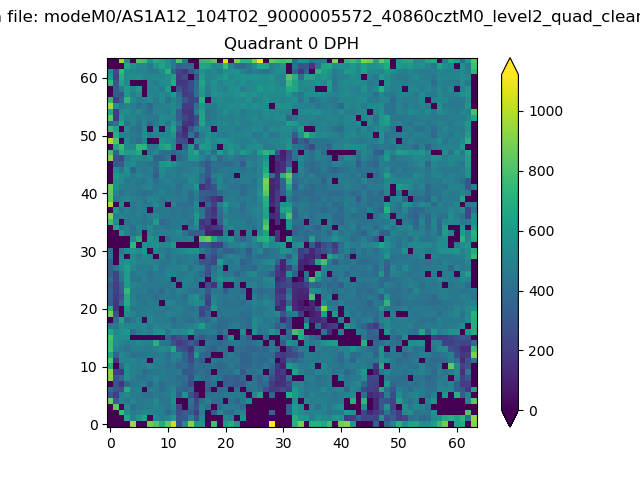 |
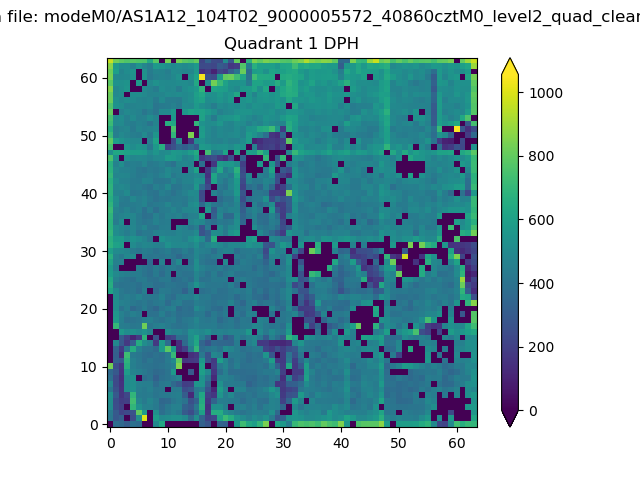 |
Quadrant B |
|---|---|---|---|
| Quadrant D | 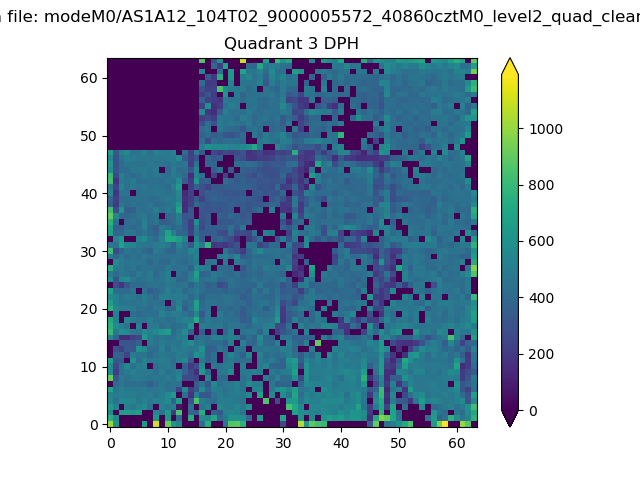 |
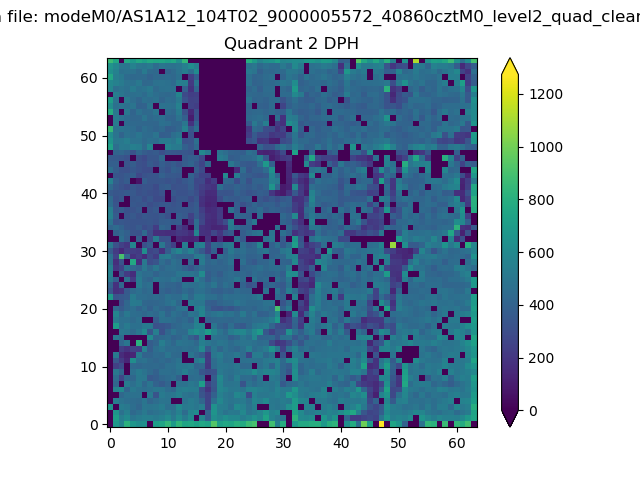 |
Quadrant C |
| Plot type | Count rate plots | Images |
|---|---|---|
| Comparison with Poisson distribution Blue bars denote a histogram of data divided into 1 sec bins. Red curve is a Poisson curve with rate = median count rate of data. |
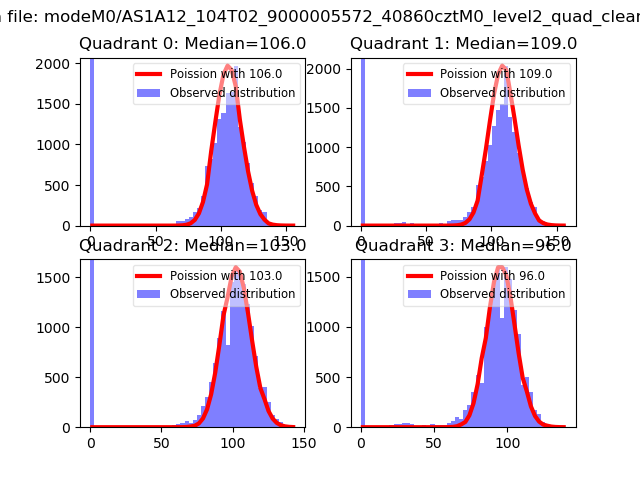 |
 |
| Quadrant-wise count rates Data is divided into 100 sec bins |
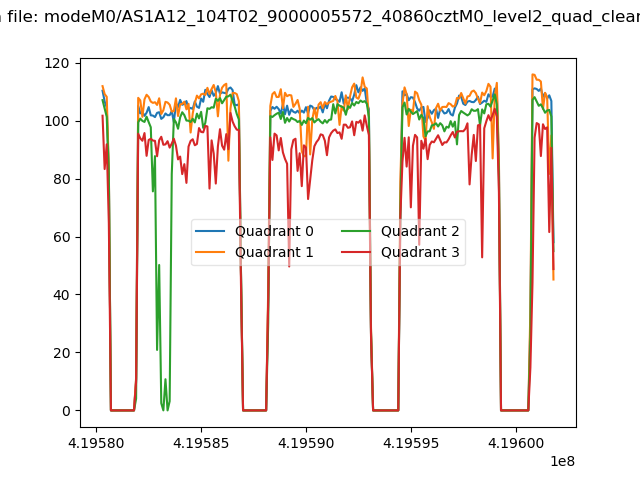 |
|
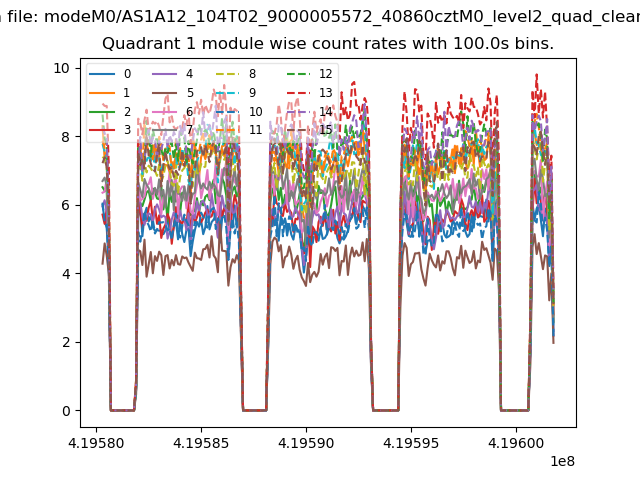
| Module-wise count rates for Quadrant A Data is divided into 100 sec bins |
 |
 |
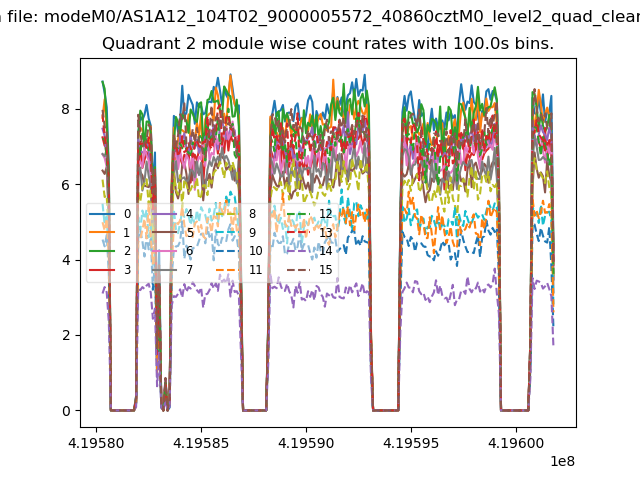
| Module-wise count rates for Quadrant B Data is divided into 100 sec bins |
 |
 |
| Module-wise count rates for Quadrant C Data is divided into 100 sec bins |
 |
 |
| Module-wise count rates for Quadrant D Data is divided into 100 sec bins |
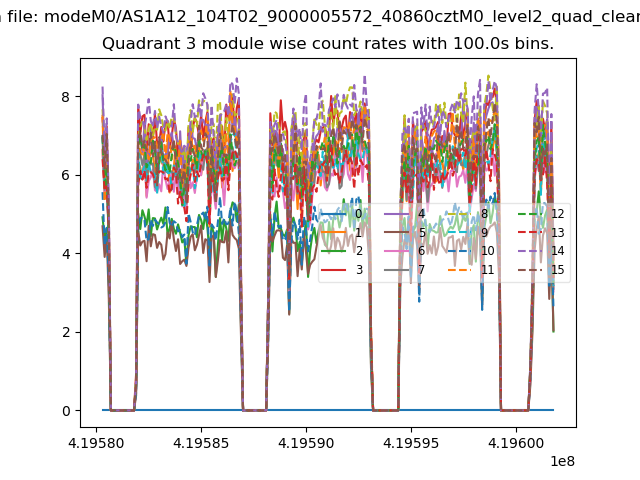 |
 |
| Parameter | Plot |
|---|---|
| CZT HV Monitor | 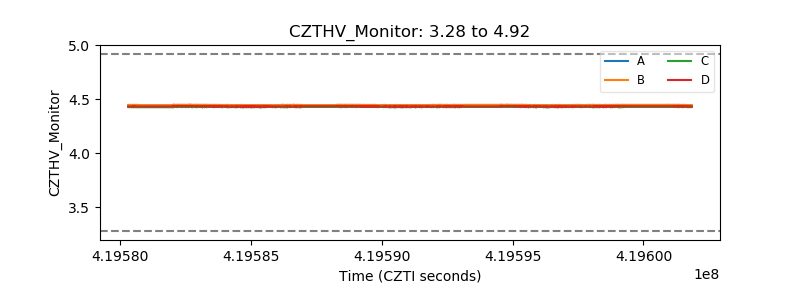 |
| D_VDD | 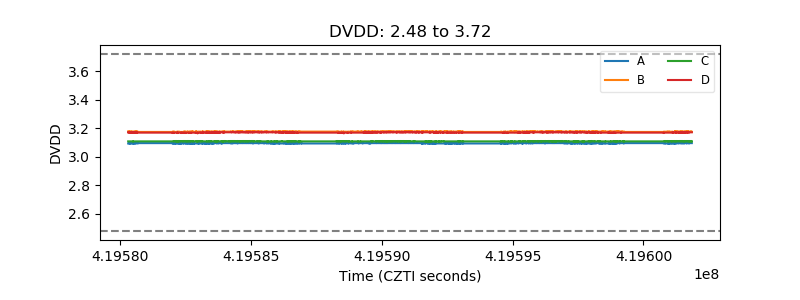 |
| Temperature 1 | 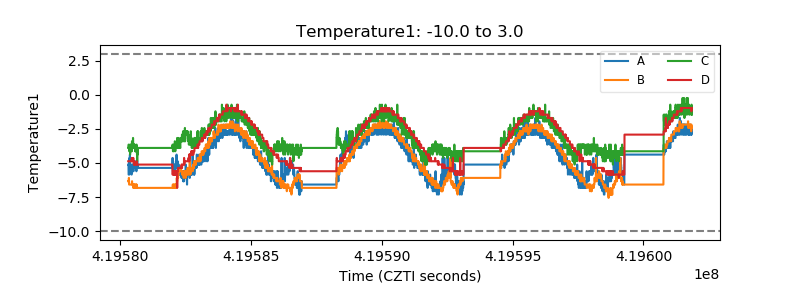 |
| Veto HV Monitor | 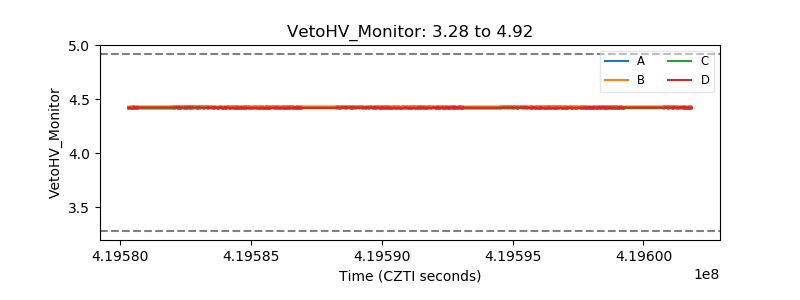 |
| Veto LLD | 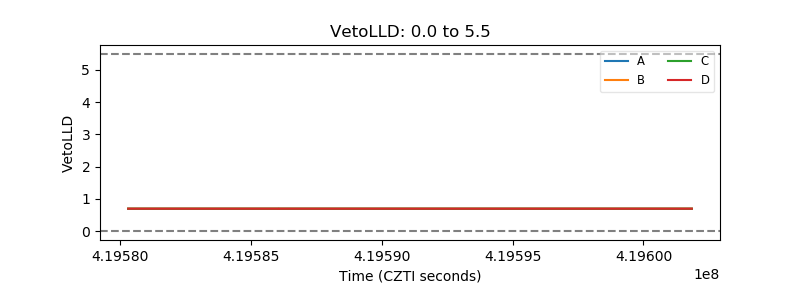 |
| Alpha Counter |  |
| _CPM_Rate |  |
| CZT Counter | 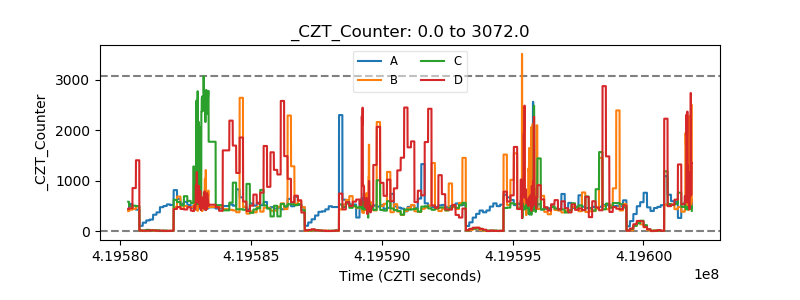 |
| +2.5 Volts monitor |  |
| +5 Volts monitor |  |
| _ROLL_ROT | 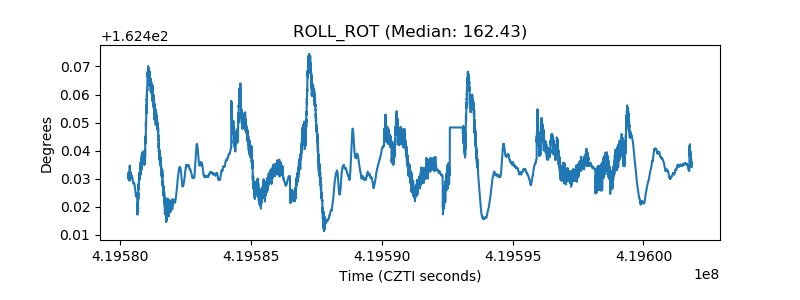 |
| _Roll_DEC | 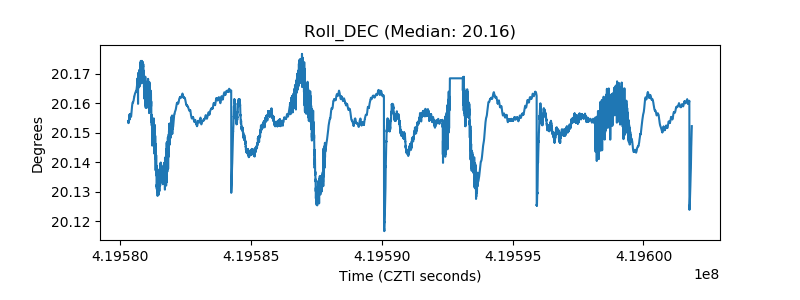 |
| _Roll_RA | 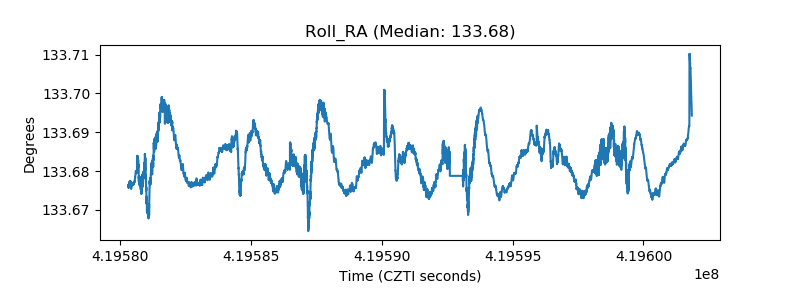 |
| Veto Counter | 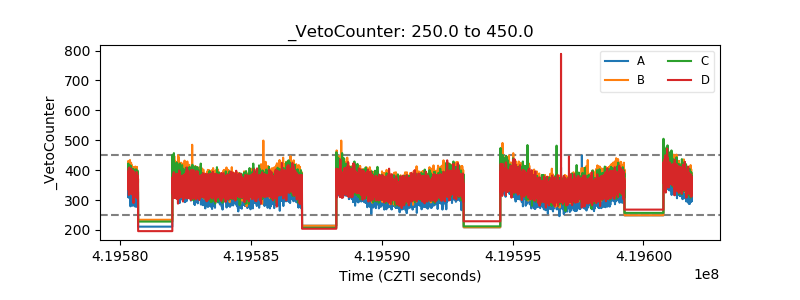 |