| Param | Original file | Final file |
|---|---|---|
| Filename | modeM0/AS1A12_104T02_9000005572_40861cztM0_level2.fits | modeM0/AS1A12_104T02_9000005572_40861cztM0_level2_quad_clean.evt |
| Size (bytes) | 154,391,040 | 38,471,040 |
| Size | 147.2 MB | 36.7 MB |
| Events in quadrant A | 1,194,205 | 261,236 |
| Events in quadrant B | 1,579,114 | 251,573 |
| Events in quadrant C | 1,125,716 | 251,343 |
| Events in quadrant D | 1,625,356 | 226,427 |
| Mode M0 | |||
|---|---|---|---|
| Quadrant | BADHDUFLAG | Total packets | Discarded packets |
| A | 0 | 4986 | 0 |
| B | 0 | 6409 | 0 |
| C | 0 | 4972 | 0 |
| D | 0 | 6501 | 0 |
| Mode SS | |||
|---|---|---|---|
| Quadrant | BADHDUFLAG | Total packets | Discarded packets |
| A | 0 | 50 | 0 |
| B | 0 | 50 | 0 |
| C | 0 | 50 | 0 |
| D | 0 | 50 | 0 |
| Quadrant | Total seconds | Saturated seconds | Saturation percentage |
|---|---|---|---|
| A | 2421 | 1 | 0.041305% |
| B | 2421 | 150 | 6.195787% |
| C | 2421 | 4 | 0.165221% |
| D | 2421 | 81 | 3.345725% |
Noise dominated data is calculated using 1-second bins in cleaned event files. If a bin has >2000 counts, and if more than 50% of those come from <1% of pixels, then it is considered to be noise-dominated and hence unusable.
| Quadrant | # 1 sec bins | Bins with >0 counts | Bins with >2000 counts | High rate bins dominated by noise | Noise dominated (total time) | Noise dominated (detector-on time) | Marked lightcurve |
|---|---|---|---|---|---|---|---|
| A | 2421 | 2421 | 0 | 0 | 0.00% | 0.00% | 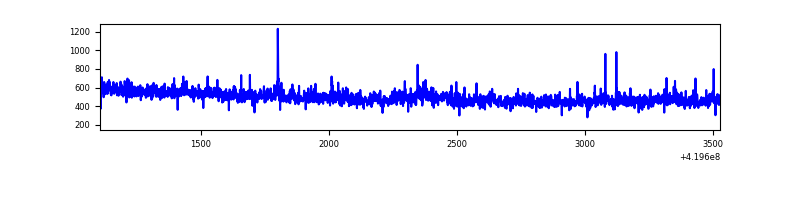 |
| B | 2421 | 2421 | 96 | 96 | 3.97% | 3.97% | 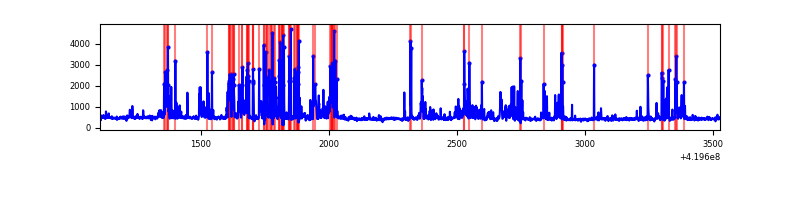 |
| C | 2421 | 2421 | 5 | 5 | 0.21% | 0.21% | 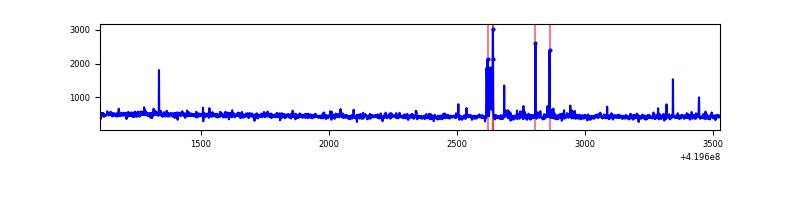 |
| D | 2421 | 2421 | 59 | 59 | 2.44% | 2.44% | 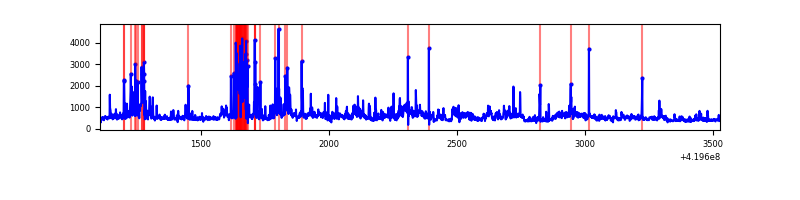 |
Top three noisy pixels from each quadrant. If the there are fewer than three noisy pixels in the level2.evt file, extra rows are filled as -1
| Pixel properties | Quadrant properties | ||||||
|---|---|---|---|---|---|---|---|
| Quadrant | DetID | PixID | Counts | Sigma | Mean | Median | Sigma |
| A | 10 | 83 | 168183 | 3078.94 | 255 | 250 | 54.5 |
| A | 12 | 189 | 15815 | 285.37 | 255 | 250 | 54.5 |
| A | 13 | 6 | 11222 | 201.16 | 255 | 250 | 54.5 |
| B | 4 | 171 | 560927 | 11429.73 | 244 | 238 | 49.1 |
| B | 0 | 190 | 40563 | 822.03 | 244 | 238 | 49.1 |
| B | 0 | 229 | 9684 | 192.56 | 244 | 238 | 49.1 |
| C | 15 | 214 | 97477 | 1656.1 | 247 | 248 | 58.7 |
| C | 14 | 254 | 37931 | 641.85 | 247 | 248 | 58.7 |
| C | 12 | 249 | 16719 | 280.55 | 247 | 248 | 58.7 |
| D | 12 | 79 | 229197 | 3706.38 | 245 | 239 | 61.8 |
| D | 13 | 249 | 169218 | 2735.44 | 245 | 239 | 61.8 |
| D | 2 | 249 | 130636 | 2110.87 | 245 | 239 | 61.8 |
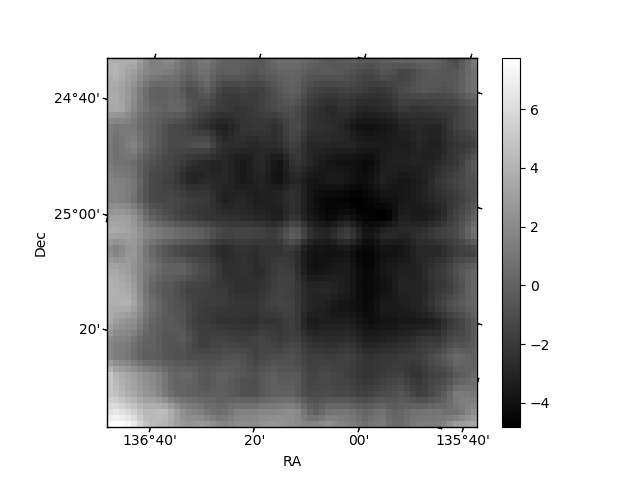
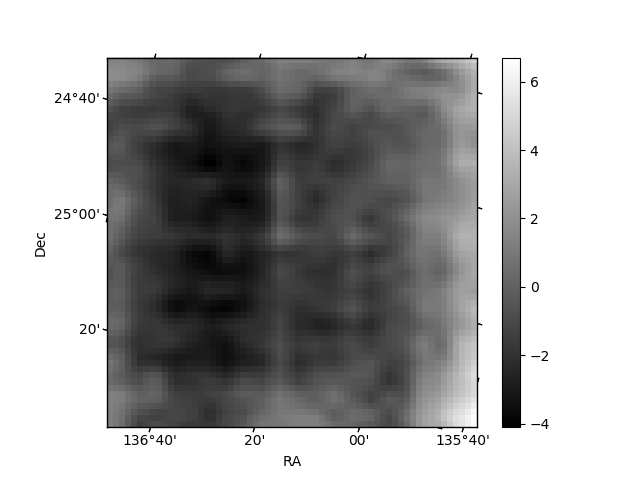
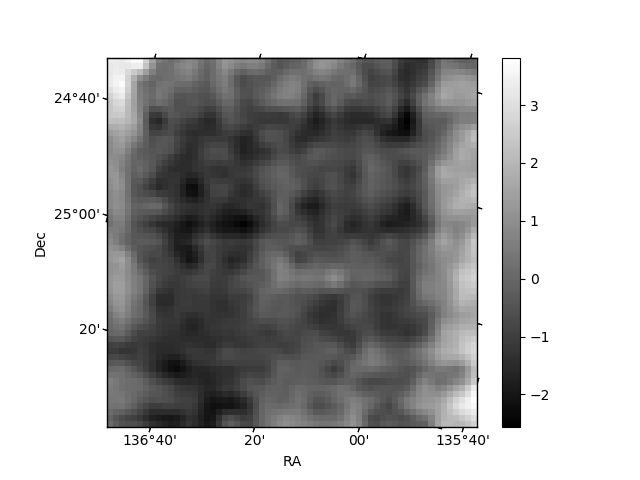
Histogram calculated using DETX and DETY for each event in the final _common_clean file
| Quadrant A | 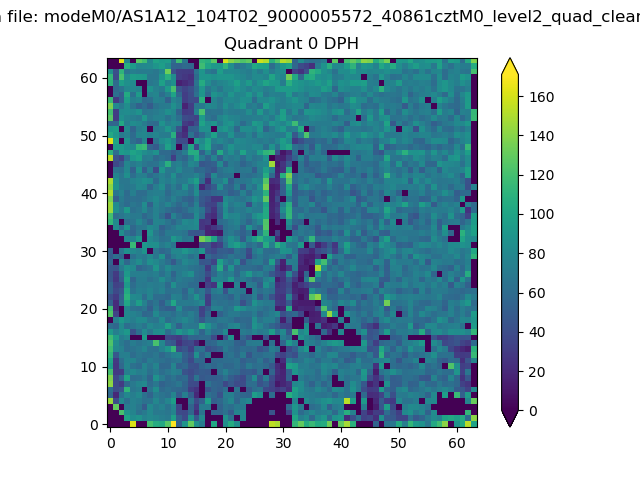 |
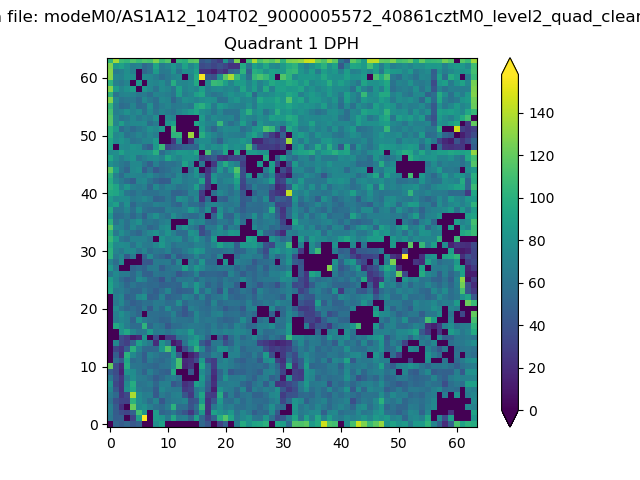 |
Quadrant B |
|---|---|---|---|
| Quadrant D | 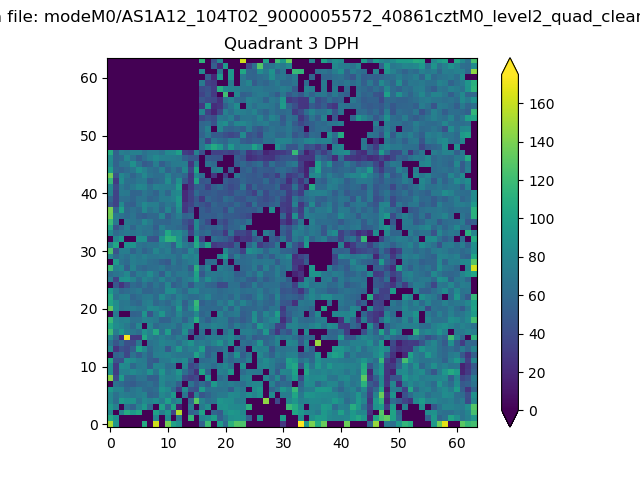 |
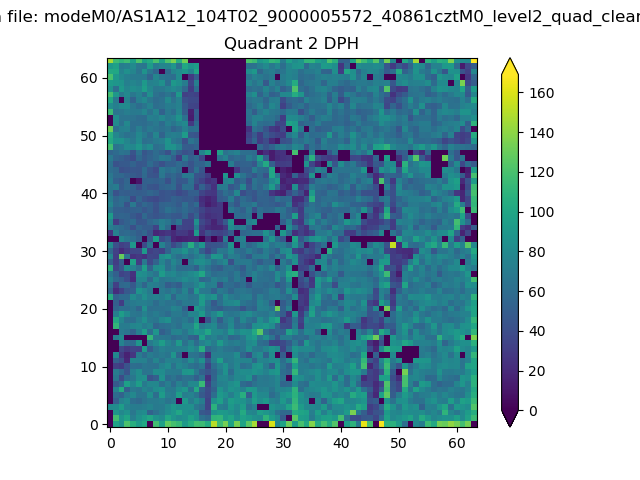 |
Quadrant C |
| Plot type | Count rate plots | Images |
|---|---|---|
| Comparison with Poisson distribution Blue bars denote a histogram of data divided into 1 sec bins. Red curve is a Poisson curve with rate = median count rate of data. |
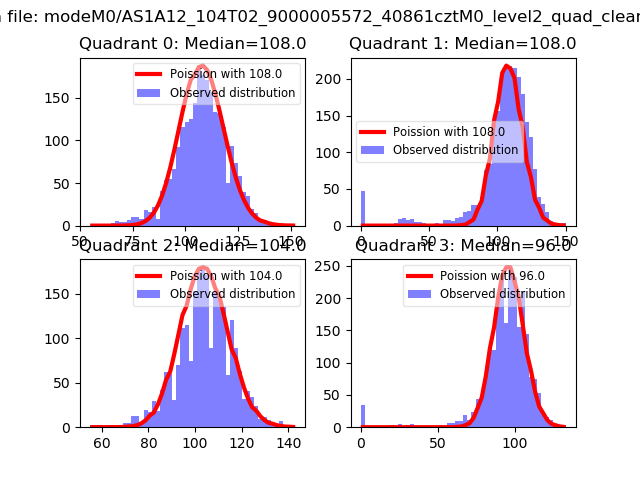 |
 |
| Quadrant-wise count rates Data is divided into 100 sec bins |
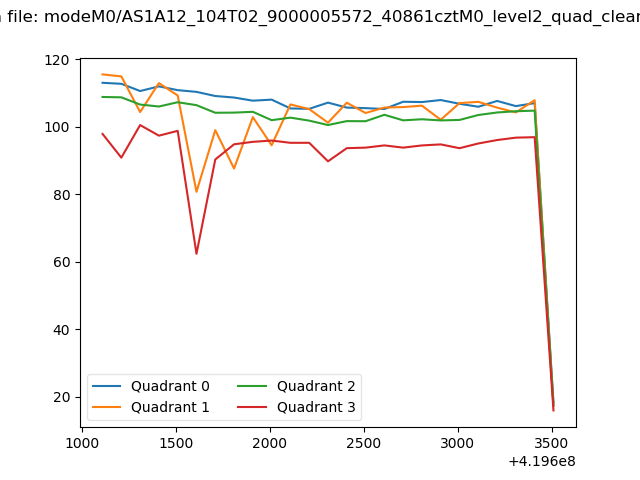 |
|
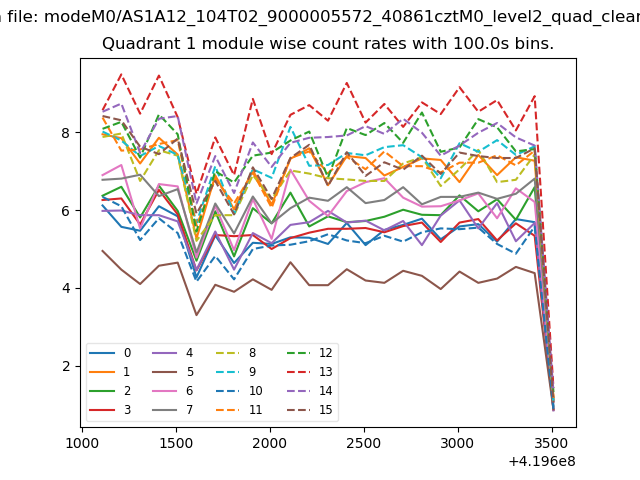
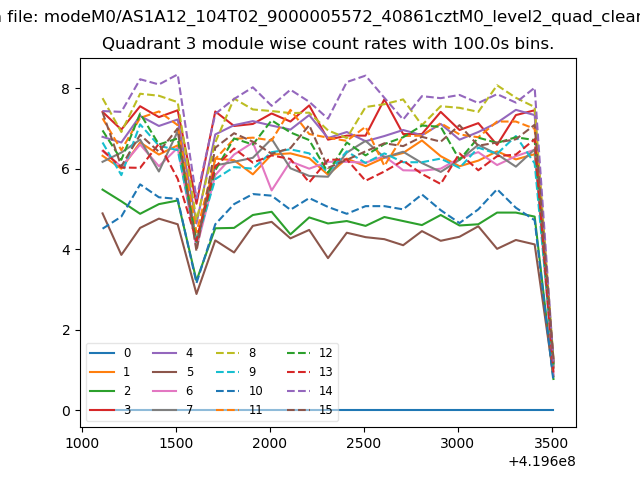
| Module-wise count rates for Quadrant A Data is divided into 100 sec bins |
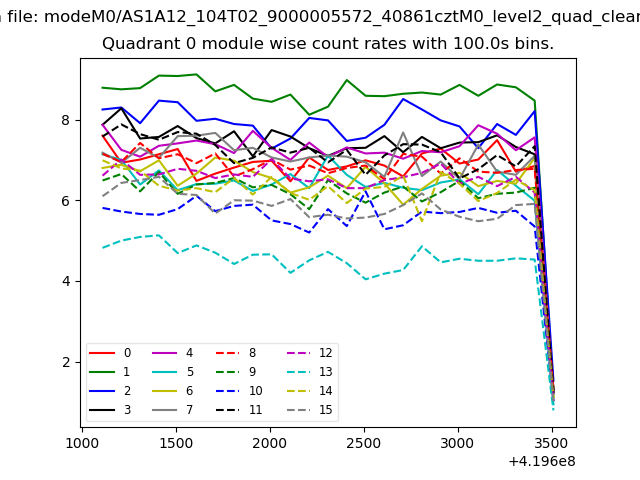 |
 |
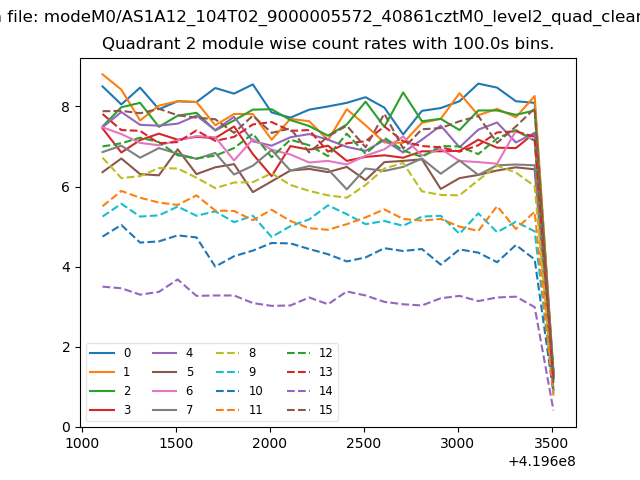
| Module-wise count rates for Quadrant B Data is divided into 100 sec bins |
 |
 |
| Module-wise count rates for Quadrant C Data is divided into 100 sec bins |
 |
 |
| Module-wise count rates for Quadrant D Data is divided into 100 sec bins |
 |
 |
| Parameter | Plot |
|---|---|
| CZT HV Monitor | 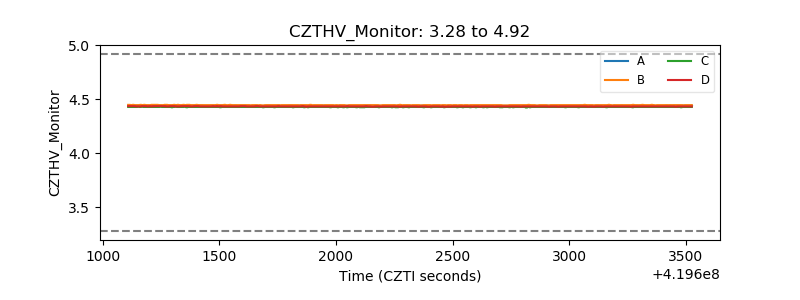 |
| D_VDD | 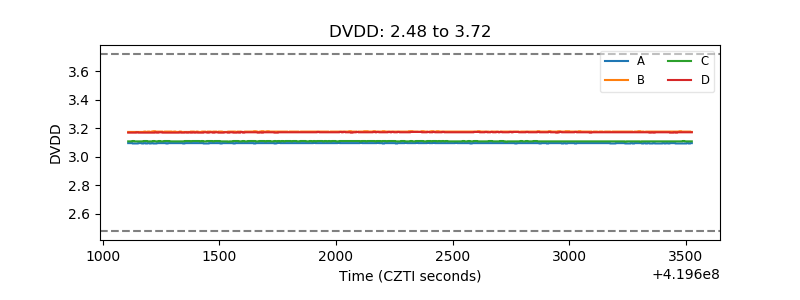 |
| Temperature 1 | 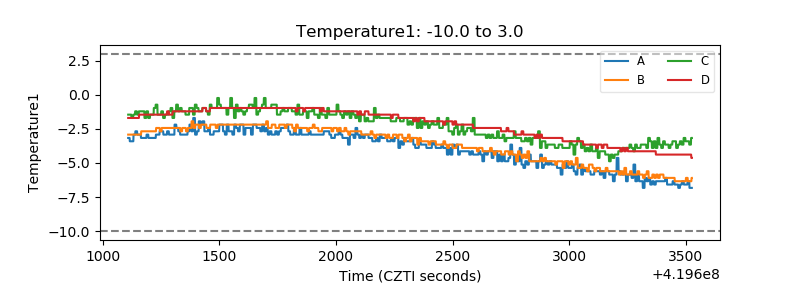 |
| Veto HV Monitor | 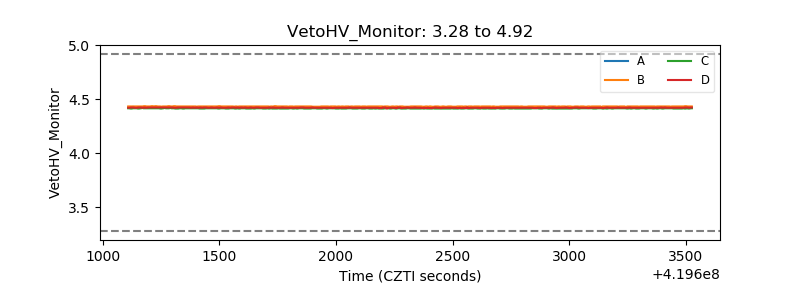 |
| Veto LLD | 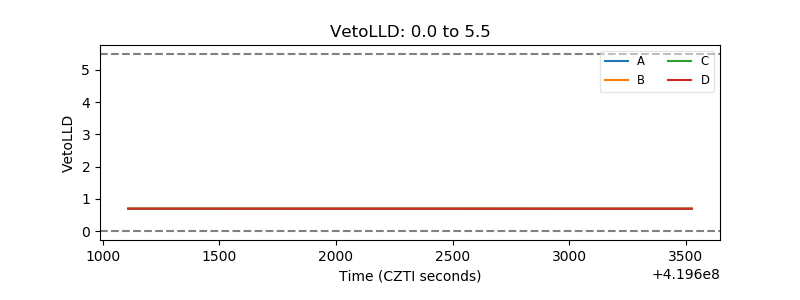 |
| Alpha Counter |  |
| _CPM_Rate |  |
| CZT Counter |  |
| +2.5 Volts monitor | 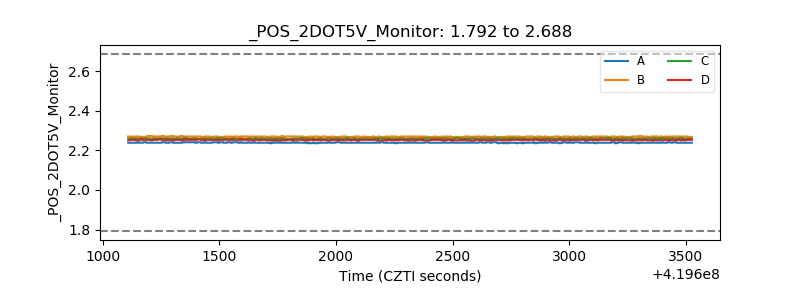 |
| +5 Volts monitor |  |
| _ROLL_ROT | 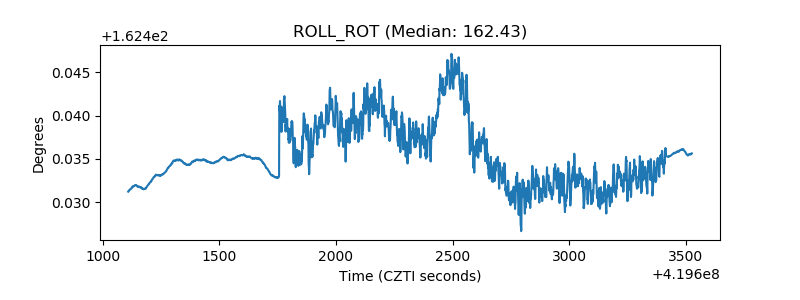 |
| _Roll_DEC | 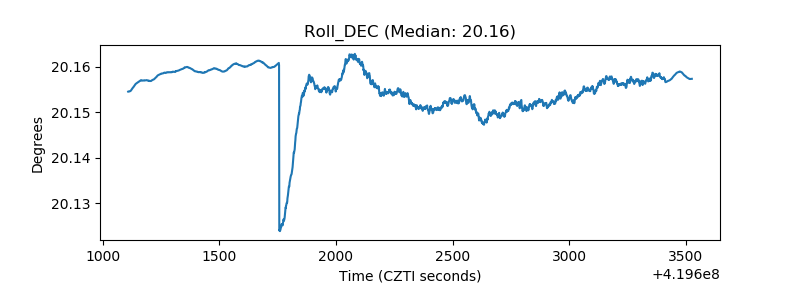 |
| _Roll_RA |  |
| Veto Counter | 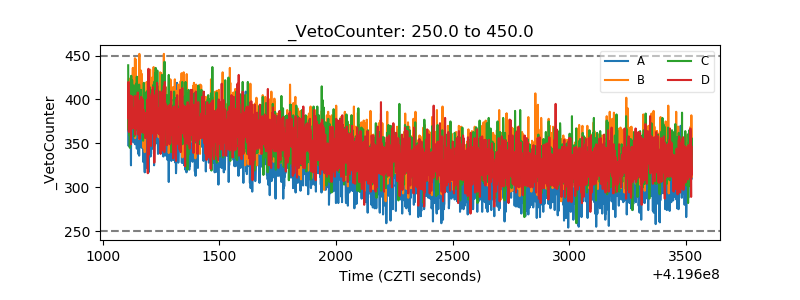 |