| Param | Original file | Final file |
|---|---|---|
| Filename | modeM0/AS1A12_104T02_9000005572_40864cztM0_level2.fits | modeM0/AS1A12_104T02_9000005572_40864cztM0_level2_quad_clean.evt |
| Size (bytes) | 1,618,813,440 | 348,053,760 |
| Size | 1.5 GB | 331.9 MB |
| Events in quadrant A | 11,742,220 | 2,378,257 |
| Events in quadrant B | 13,576,007 | 2,377,008 |
| Events in quadrant C | 14,069,639 | 2,215,488 |
| Events in quadrant D | 18,826,861 | 2,044,561 |
| Mode M9 | |||
|---|---|---|---|
| Quadrant | BADHDUFLAG | Total packets | Discarded packets |
| A | 0 | 55 | 0 |
| B | 0 | 55 | 0 |
| C | 0 | 55 | 0 |
| D | 0 | 55 | 0 |
| Mode M0 | |||
|---|---|---|---|
| Quadrant | BADHDUFLAG | Total packets | Discarded packets |
| A | 0 | 47997 | 4 |
| B | 0 | 55749 | 4 |
| C | 0 | 55912 | 4 |
| D | 0 | 71057 | 4 |
| Mode SS | |||
|---|---|---|---|
| Quadrant | BADHDUFLAG | Total packets | Discarded packets |
| A | 0 | 452 | 0 |
| B | 0 | 452 | 0 |
| C | 0 | 452 | 0 |
| D | 0 | 452 | 0 |
| Quadrant | Total seconds | Saturated seconds | Saturation percentage |
|---|---|---|---|
| A | 22111 | 45 | 0.203519% |
| B | 22111 | 873 | 3.948261% |
| C | 22111 | 1219 | 5.513093% |
| D | 22111 | 1472 | 6.657320% |
Noise dominated data is calculated using 1-second bins in cleaned event files. If a bin has >2000 counts, and if more than 50% of those come from <1% of pixels, then it is considered to be noise-dominated and hence unusable.
| Quadrant | # 1 sec bins | Bins with >0 counts | Bins with >2000 counts | High rate bins dominated by noise | Noise dominated (total time) | Noise dominated (detector-on time) | Marked lightcurve |
|---|---|---|---|---|---|---|---|
| A | 27629 | 22115 | 20 | 20 | 0.07% | 0.09% | 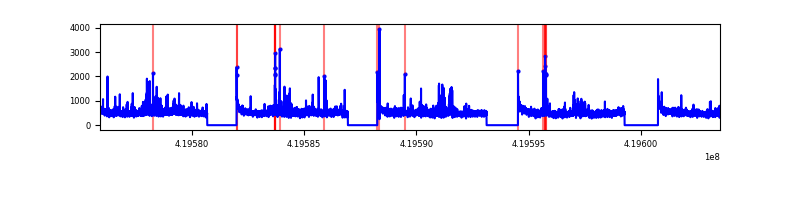 |
| B | 27629 | 22114 | 508 | 508 | 1.84% | 2.30% | 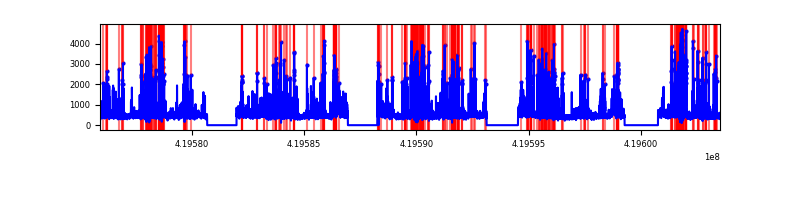 |
| C | 27629 | 22115 | 1010 | 1010 | 3.66% | 4.57% | 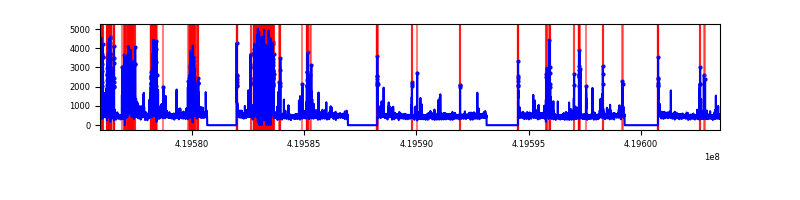 |
| D | 27629 | 22115 | 1274 | 1274 | 4.61% | 5.76% | 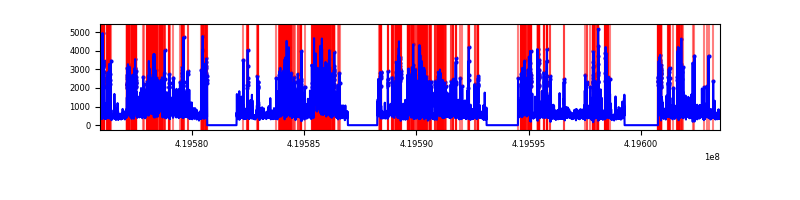 |
Top three noisy pixels from each quadrant. If the there are fewer than three noisy pixels in the level2.evt file, extra rows are filled as -1
| Pixel properties | Quadrant properties | ||||||
|---|---|---|---|---|---|---|---|
| Quadrant | DetID | PixID | Counts | Sigma | Mean | Median | Sigma |
| A | 10 | 83 | 1737005 | 3541.53 | 2406 | 2356 | 489.8 |
| A | 12 | 189 | 345905 | 701.4 | 2406 | 2356 | 489.8 |
| A | 13 | 248 | 166649 | 335.43 | 2406 | 2356 | 489.8 |
| B | 4 | 171 | 3873495 | 8549.61 | 2354 | 2288 | 452.8 |
| B | 0 | 229 | 180131 | 392.77 | 2354 | 2288 | 452.8 |
| B | 0 | 190 | 142431 | 309.51 | 2354 | 2288 | 452.8 |
| C | 14 | 254 | 3971434 | 7582.76 | 2268 | 2283 | 523.4 |
| C | 15 | 214 | 890518 | 1696.9 | 2268 | 2283 | 523.4 |
| C | 0 | 10 | 159813 | 300.95 | 2268 | 2283 | 523.4 |
| D | 12 | 79 | 4305036 | 7749.45 | 2285 | 2223 | 555.2 |
| D | 13 | 249 | 2869507 | 5164.03 | 2285 | 2223 | 555.2 |
| D | 2 | 249 | 1510501 | 2716.44 | 2285 | 2223 | 555.2 |
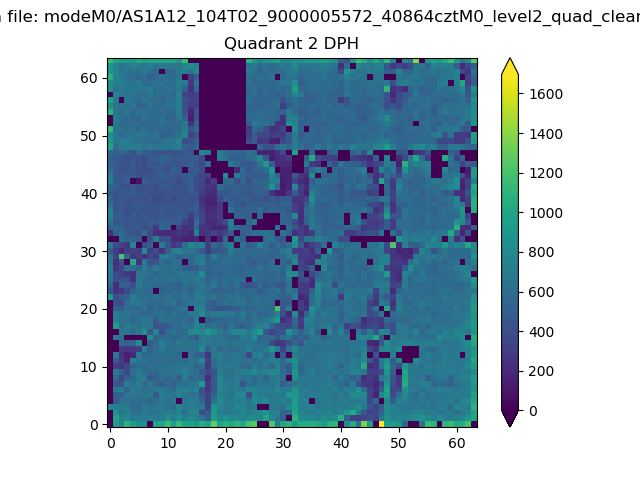
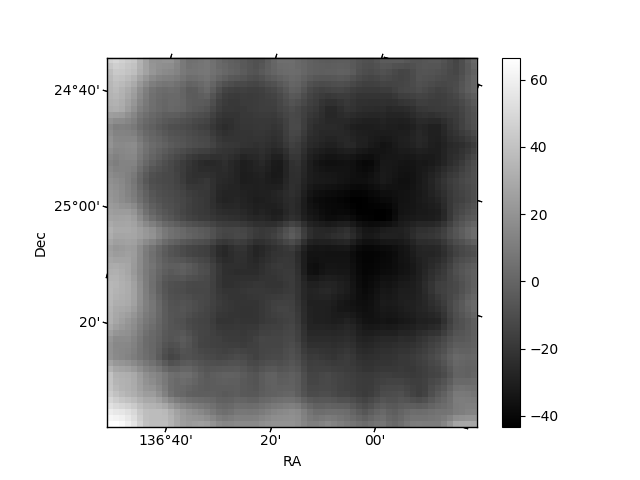
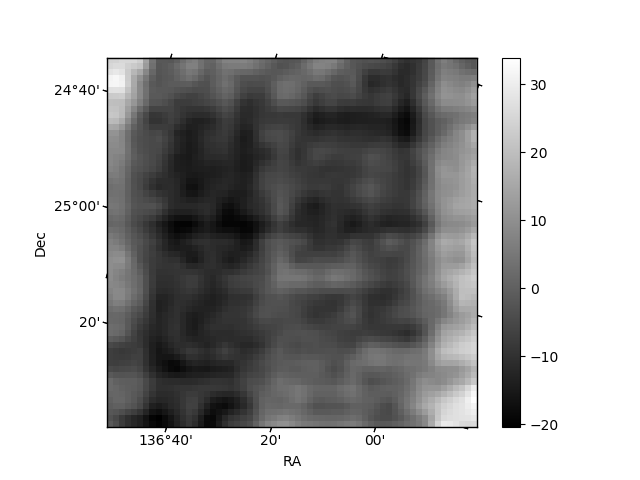
Histogram calculated using DETX and DETY for each event in the final _common_clean file
| Quadrant A | 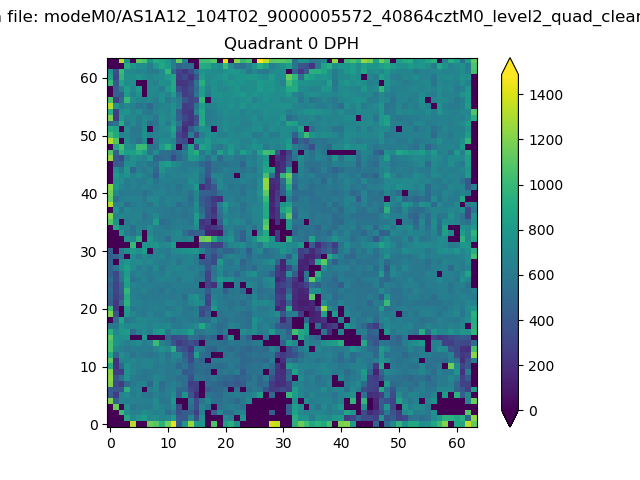 |
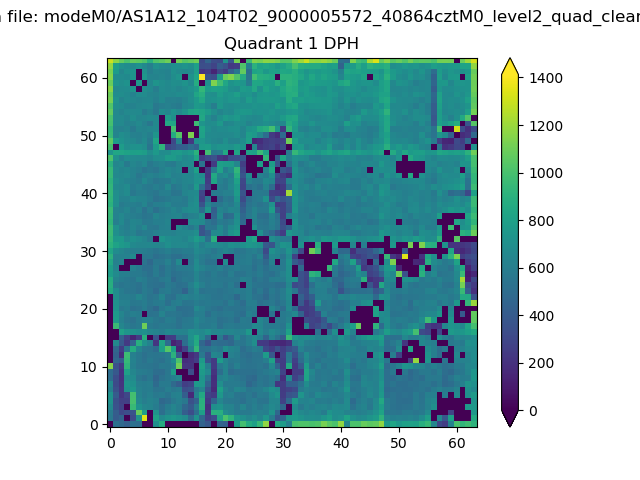 |
Quadrant B |
|---|---|---|---|
| Quadrant D | 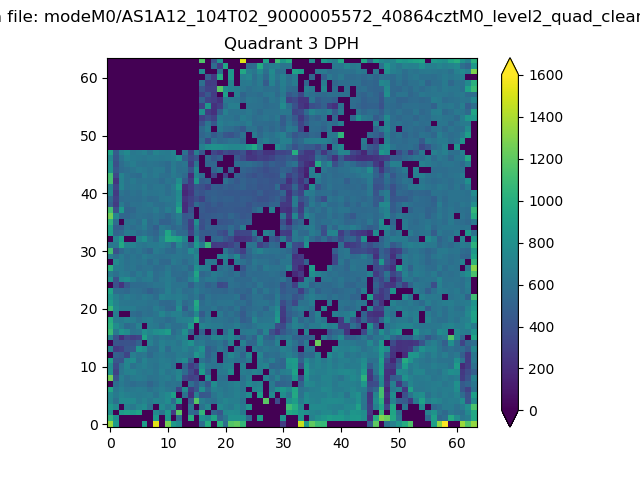 |
 |
Quadrant C |
| Plot type | Count rate plots | Images |
|---|---|---|
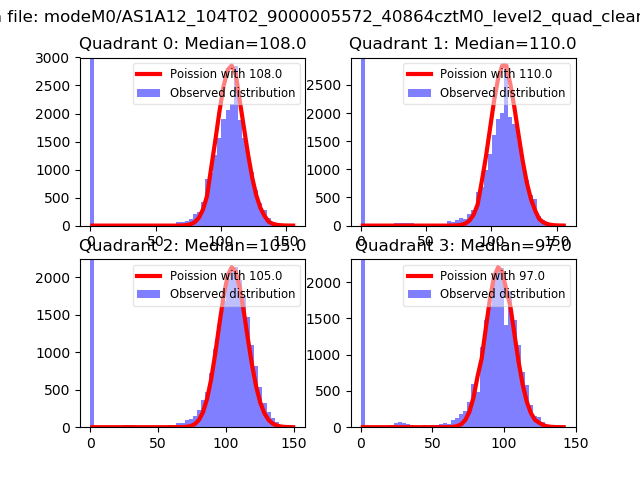
| Comparison with Poisson distribution Blue bars denote a histogram of data divided into 1 sec bins. Red curve is a Poisson curve with rate = median count rate of data. |
 |
 |
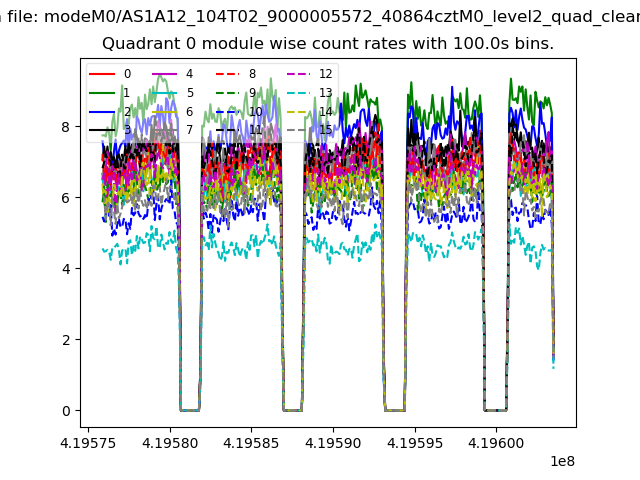
| Quadrant-wise count rates Data is divided into 100 sec bins |
 |
|
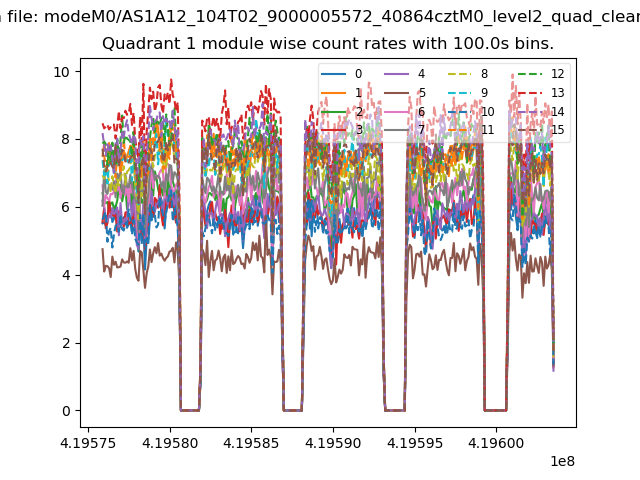
| Module-wise count rates for Quadrant A Data is divided into 100 sec bins |
 |
 |
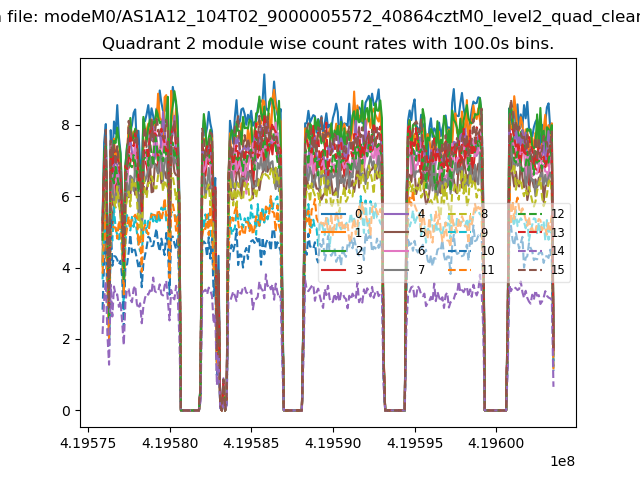
| Module-wise count rates for Quadrant B Data is divided into 100 sec bins |
 |
 |
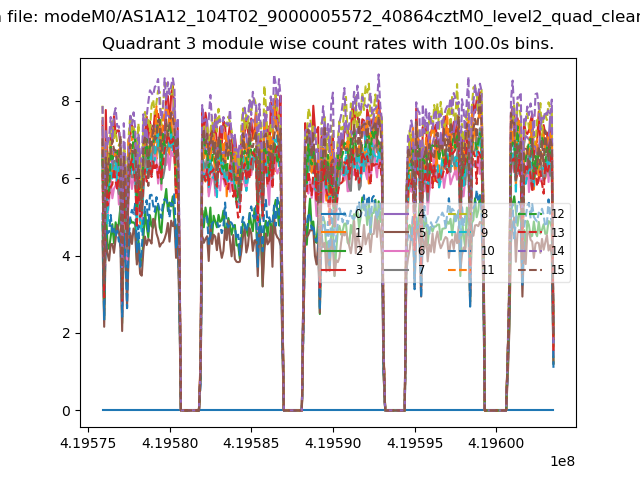
| Module-wise count rates for Quadrant C Data is divided into 100 sec bins |
 |
 |
| Module-wise count rates for Quadrant D Data is divided into 100 sec bins |
 |
 |
| Parameter | Plot |
|---|---|
| CZT HV Monitor | 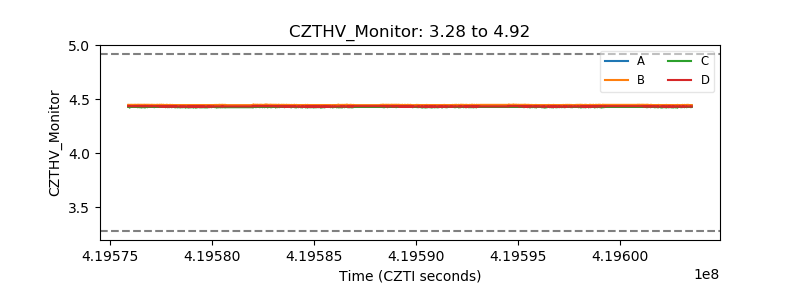 |
| D_VDD | 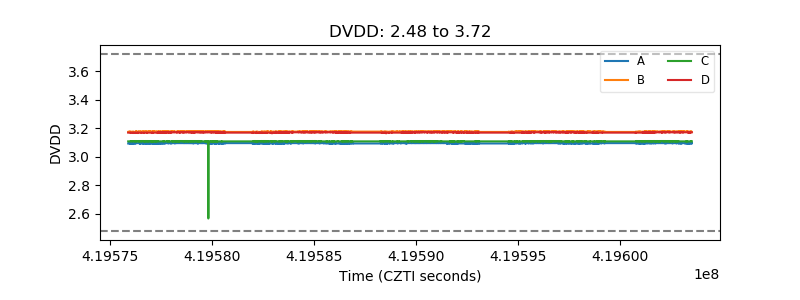 |
| Temperature 1 | 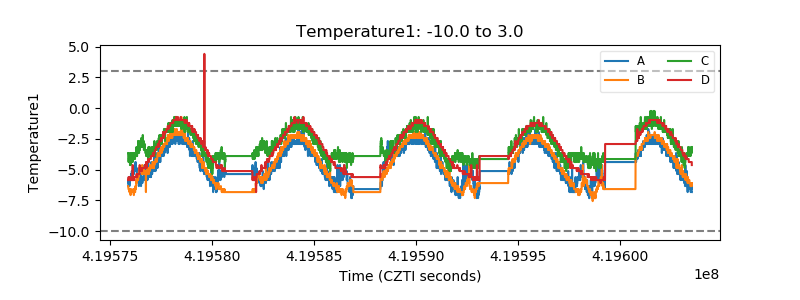 |
| Veto HV Monitor | 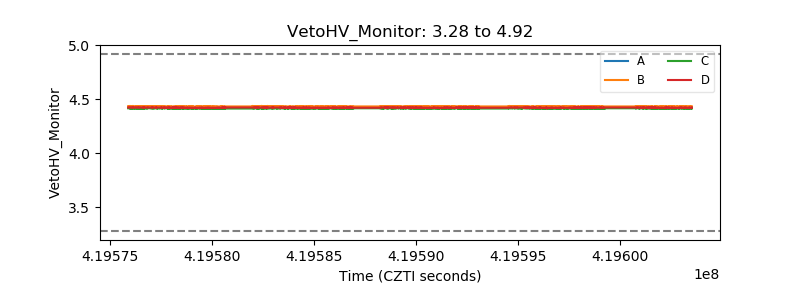 |
| Veto LLD | 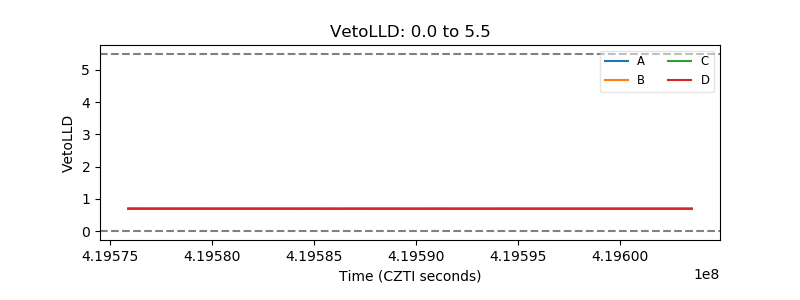 |
| Alpha Counter | 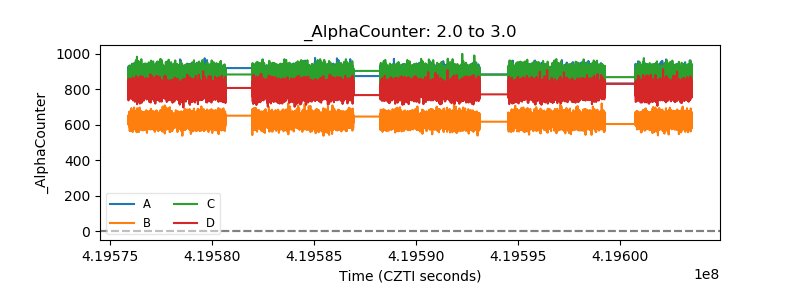 |
| _CPM_Rate | 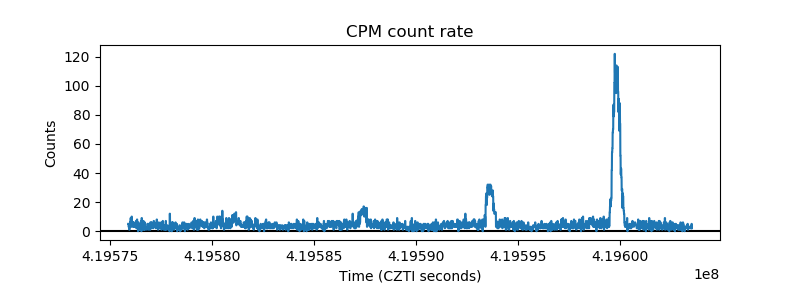 |
| CZT Counter | 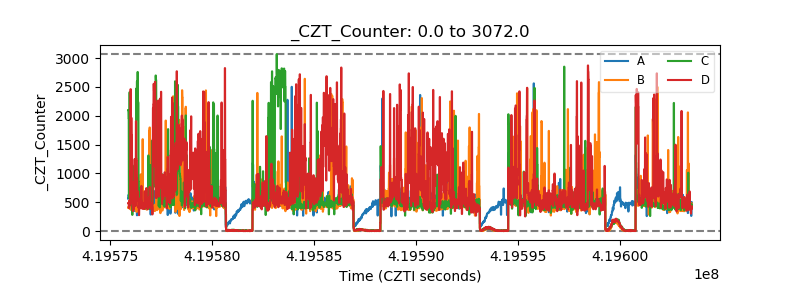 |
| +2.5 Volts monitor |  |
| +5 Volts monitor | 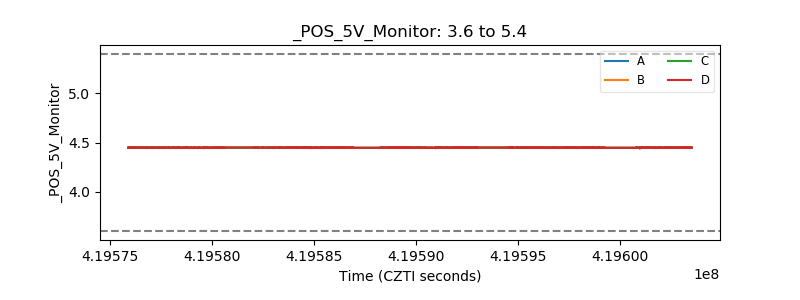 |
| _ROLL_ROT | 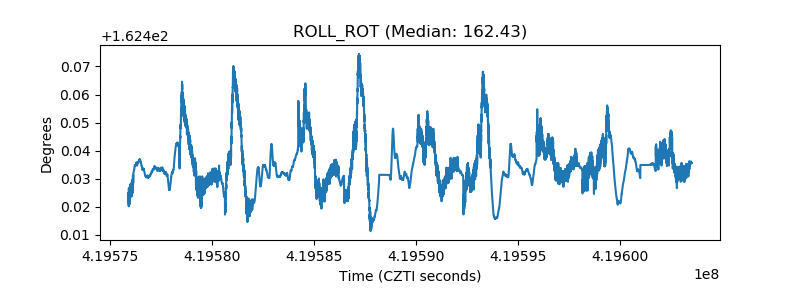 |
| _Roll_DEC |  |
| _Roll_RA | 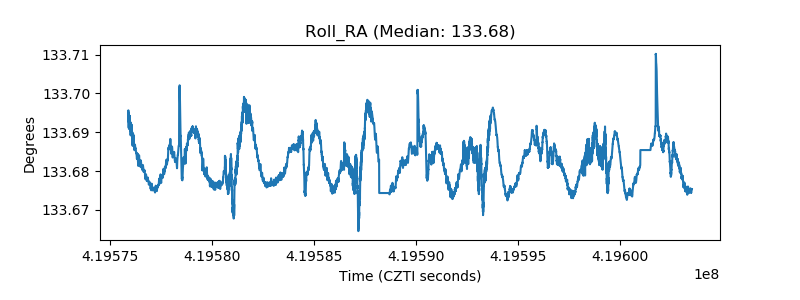 |
| Veto Counter | 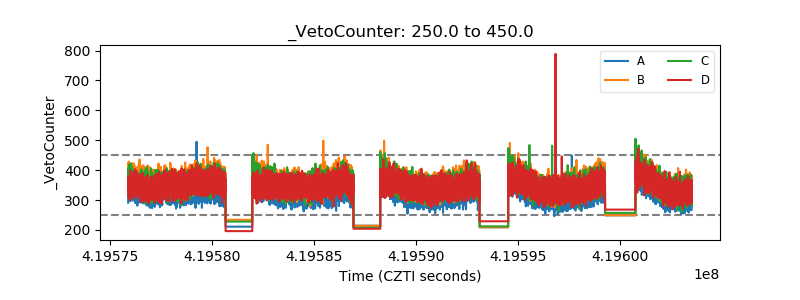 |