| Param | Original file | Final file |
|---|---|---|
| Filename | modeM0/AS1A12_097T01_9000005574_40867cztM0_level2.fits | modeM0/AS1A12_097T01_9000005574_40867cztM0_level2_quad_clean.evt |
| Size (bytes) | 369,933,120 | 80,118,720 |
| Size | 352.8 MB | 76.4 MB |
| Events in quadrant A | 2,913,870 | 561,816 |
| Events in quadrant B | 4,925,116 | 473,484 |
| Events in quadrant C | 2,480,845 | 552,829 |
| Events in quadrant D | 3,000,176 | 501,074 |
| Mode M9 | |||
|---|---|---|---|
| Quadrant | BADHDUFLAG | Total packets | Discarded packets |
| A | 0 | 35 | 0 |
| B | 0 | 35 | 0 |
| C | 0 | 35 | 0 |
| D | 0 | 36 | 0 |
| Mode SS | |||
|---|---|---|---|
| Quadrant | BADHDUFLAG | Total packets | Discarded packets |
| A | 0 | 98 | 0 |
| B | 0 | 98 | 0 |
| C | 0 | 98 | 0 |
| D | 0 | 98 | 0 |
| Mode M0 | |||
|---|---|---|---|
| Quadrant | BADHDUFLAG | Total packets | Discarded packets |
| A | 0 | 11795 | 3 |
| B | 0 | 17798 | 2 |
| C | 0 | 10230 | 2 |
| D | 0 | 12145 | 2 |
| Quadrant | Total seconds | Saturated seconds | Saturation percentage |
|---|---|---|---|
| A | 4798 | 22 | 0.458524% |
| B | 4798 | 1096 | 22.842851% |
| C | 4798 | 29 | 0.604419% |
| D | 4798 | 61 | 1.271363% |
Noise dominated data is calculated using 1-second bins in cleaned event files. If a bin has >2000 counts, and if more than 50% of those come from <1% of pixels, then it is considered to be noise-dominated and hence unusable.
| Quadrant | # 1 sec bins | Bins with >0 counts | Bins with >2000 counts | High rate bins dominated by noise | Noise dominated (total time) | Noise dominated (detector-on time) | Marked lightcurve |
|---|---|---|---|---|---|---|---|
| A | 6920 | 4799 | 16 | 16 | 0.23% | 0.33% | 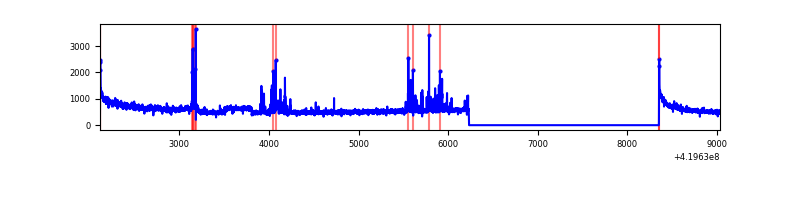 |
| B | 6920 | 4799 | 812 | 812 | 11.73% | 16.92% | 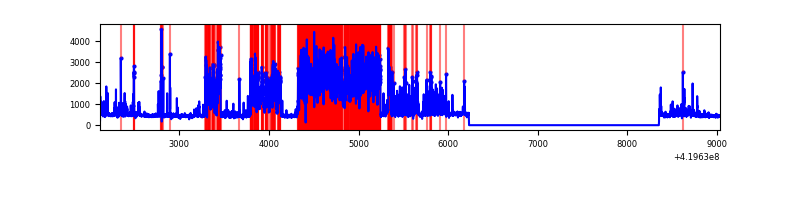 |
| C | 6920 | 4799 | 28 | 28 | 0.40% | 0.58% | 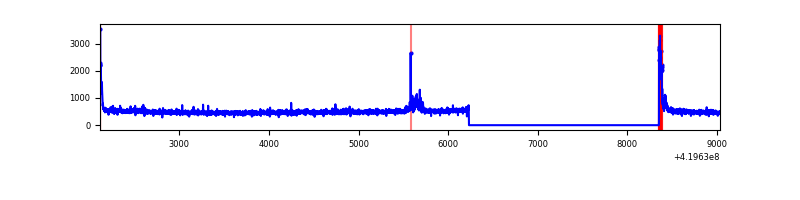 |
| D | 6920 | 4799 | 48 | 48 | 0.69% | 1.00% | 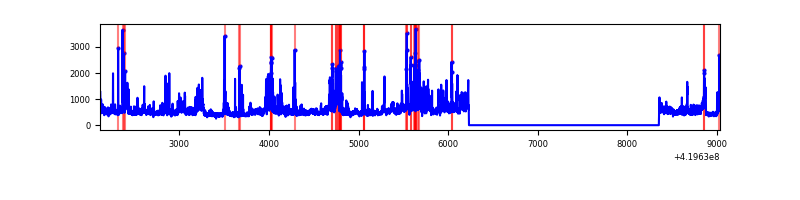 |
Top three noisy pixels from each quadrant. If the there are fewer than three noisy pixels in the level2.evt file, extra rows are filled as -1
| Pixel properties | Quadrant properties | ||||||
|---|---|---|---|---|---|---|---|
| Quadrant | DetID | PixID | Counts | Sigma | Mean | Median | Sigma |
| A | 10 | 83 | 456643 | 4045.46 | 547 | 537 | 112.7 |
| A | 6 | 10 | 165499 | 1463.14 | 547 | 537 | 112.7 |
| A | 13 | 248 | 152818 | 1350.67 | 547 | 537 | 112.7 |
| B | 4 | 171 | 2874486 | 30004.84 | 498 | 485 | 95.8 |
| B | 5 | 255 | 75704 | 785.29 | 498 | 485 | 95.8 |
| B | 12 | 111 | 11861 | 118.77 | 498 | 485 | 95.8 |
| C | 15 | 214 | 203908 | 1615.46 | 535 | 539 | 125.9 |
| C | 0 | 10 | 119234 | 942.85 | 535 | 539 | 125.9 |
| C | 9 | 54 | 44263 | 347.32 | 535 | 539 | 125.9 |
| D | 12 | 79 | 431575 | 3308.66 | 526 | 511 | 130.3 |
| D | 2 | 249 | 265418 | 2033.31 | 526 | 511 | 130.3 |
| D | 13 | 249 | 201328 | 1541.39 | 526 | 511 | 130.3 |
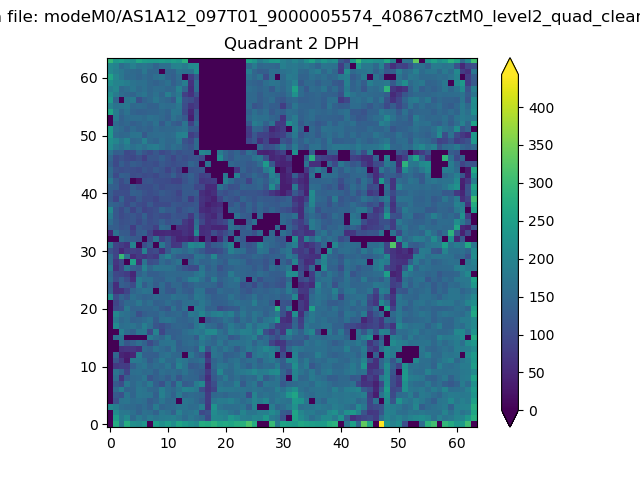
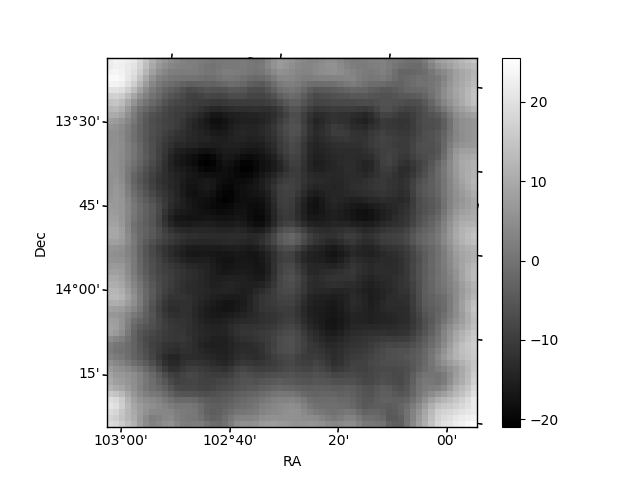
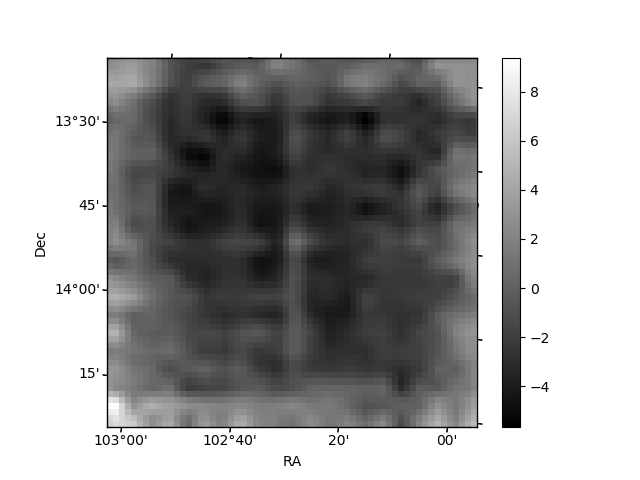
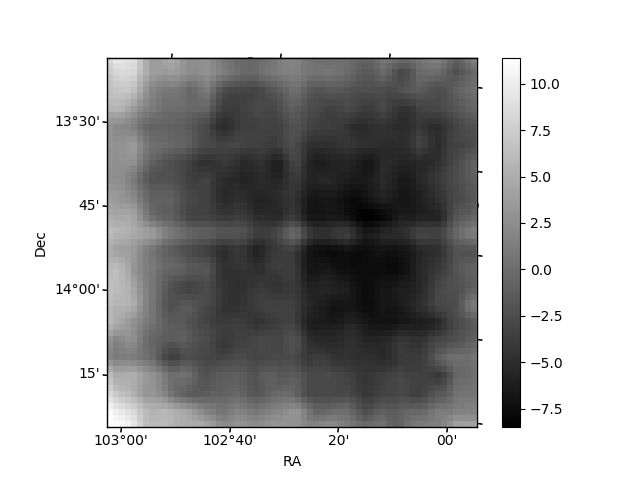
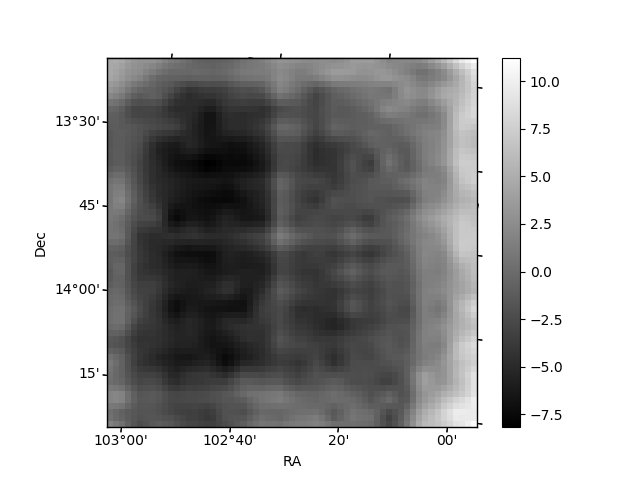
Histogram calculated using DETX and DETY for each event in the final _common_clean file
| Quadrant A | 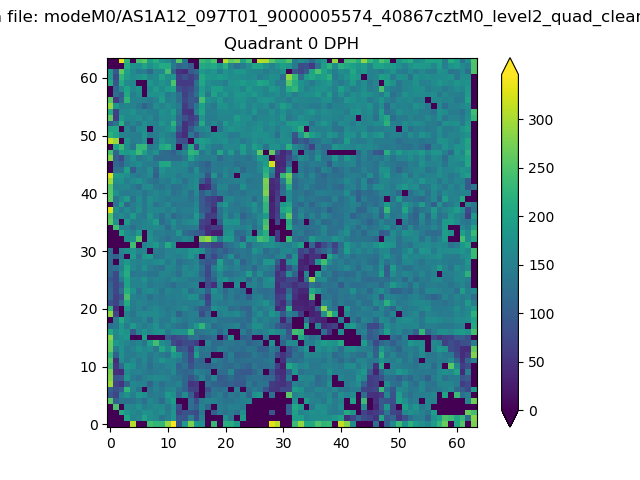 |
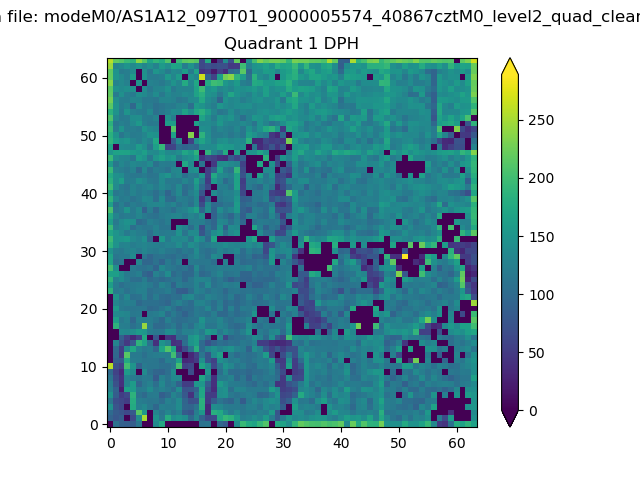 |
Quadrant B |
|---|---|---|---|
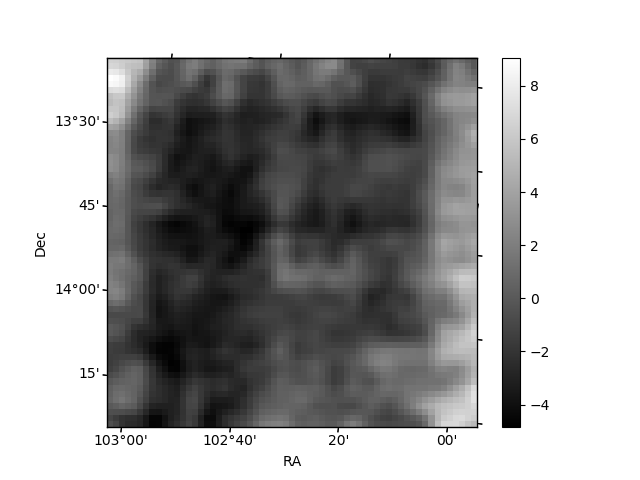
| Quadrant D | 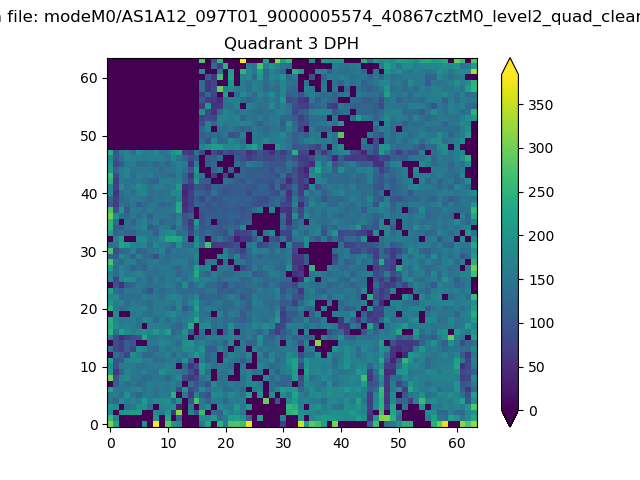 |
 |
Quadrant C |
| Plot type | Count rate plots | Images |
|---|---|---|
| Comparison with Poisson distribution Blue bars denote a histogram of data divided into 1 sec bins. Red curve is a Poisson curve with rate = median count rate of data. |
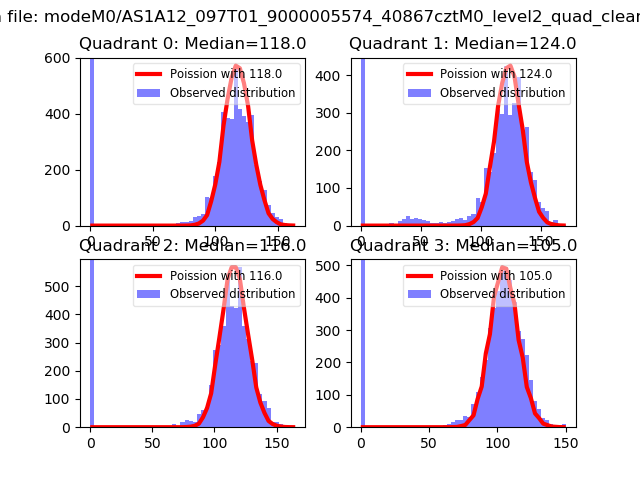 |
 |
| Quadrant-wise count rates Data is divided into 100 sec bins |
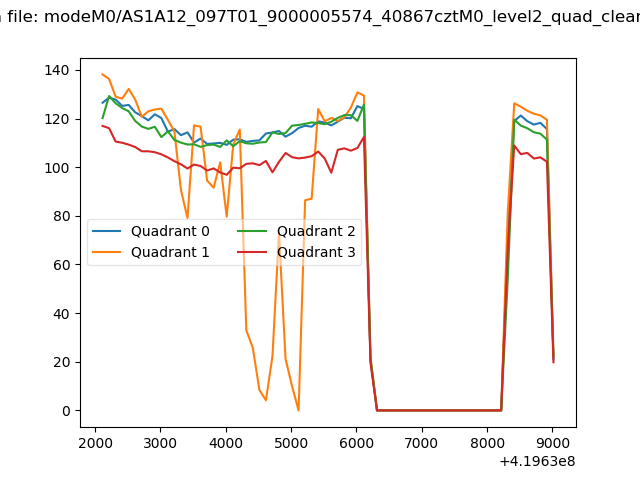 |
|
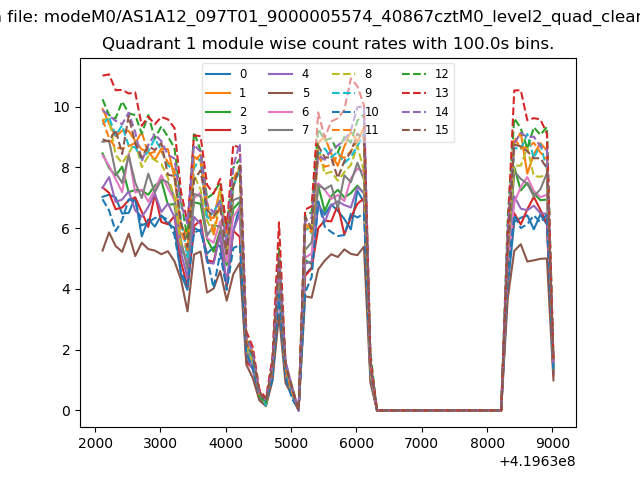
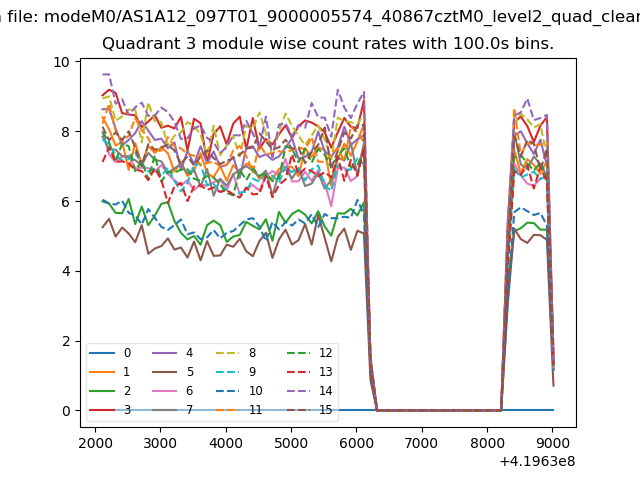
| Module-wise count rates for Quadrant A Data is divided into 100 sec bins |
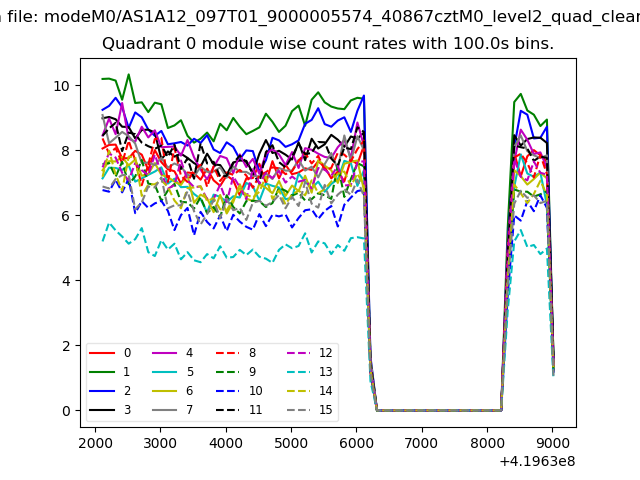 |
 |
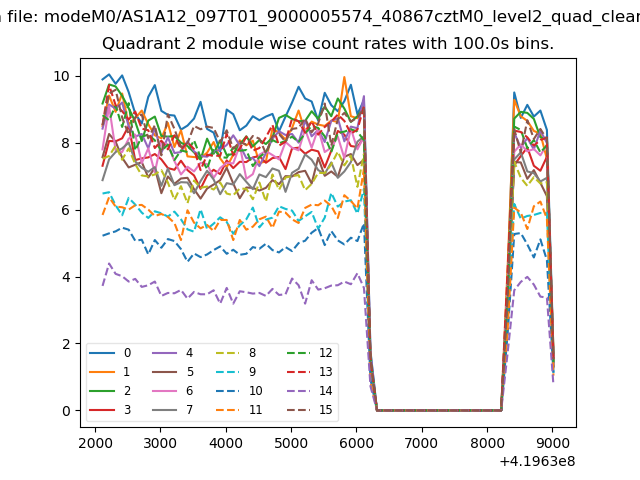
| Module-wise count rates for Quadrant B Data is divided into 100 sec bins |
 |
 |
| Module-wise count rates for Quadrant C Data is divided into 100 sec bins |
 |
 |
| Module-wise count rates for Quadrant D Data is divided into 100 sec bins |
 |
 |
| Parameter | Plot |
|---|---|
| CZT HV Monitor |  |
| D_VDD | 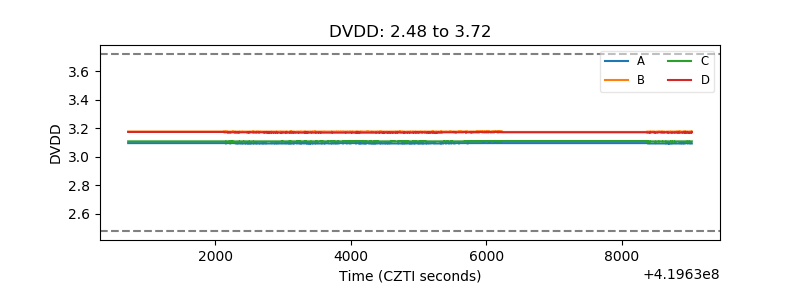 |
| Temperature 1 | 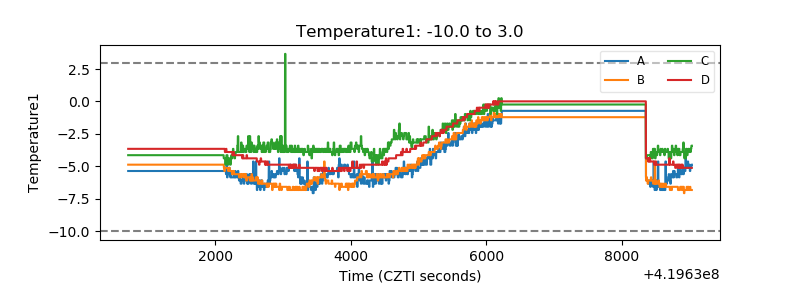 |
| Veto HV Monitor | 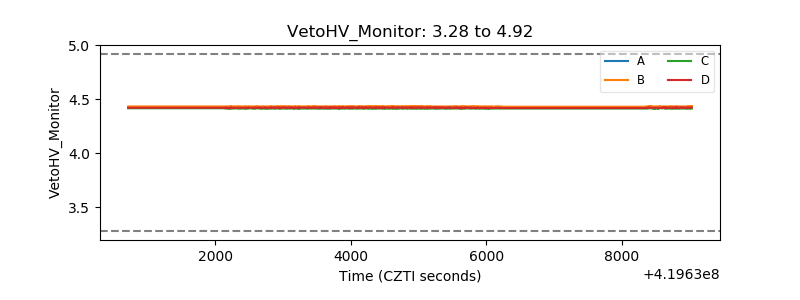 |
| Veto LLD | 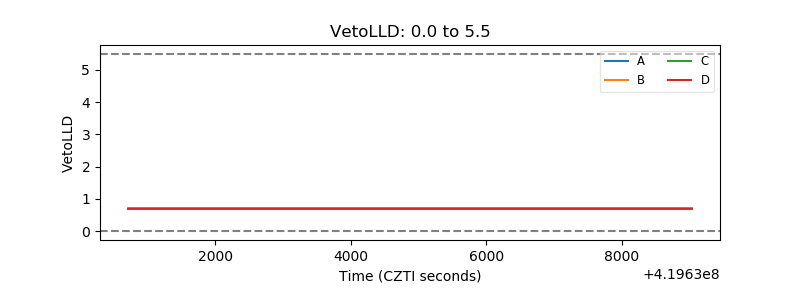 |
| Alpha Counter | 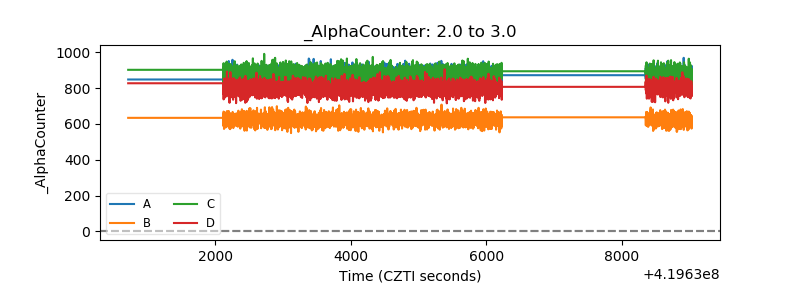 |
| _CPM_Rate |  |
| CZT Counter | 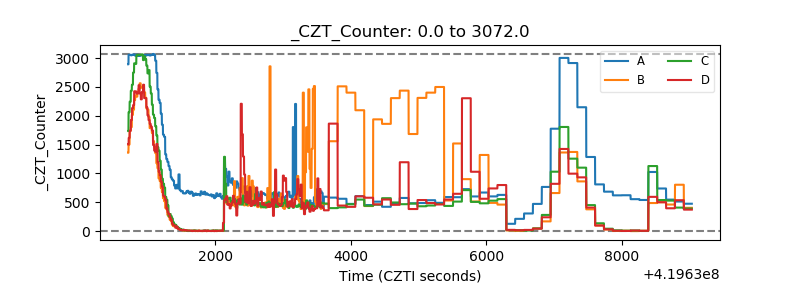 |
| +2.5 Volts monitor |  |
| +5 Volts monitor | 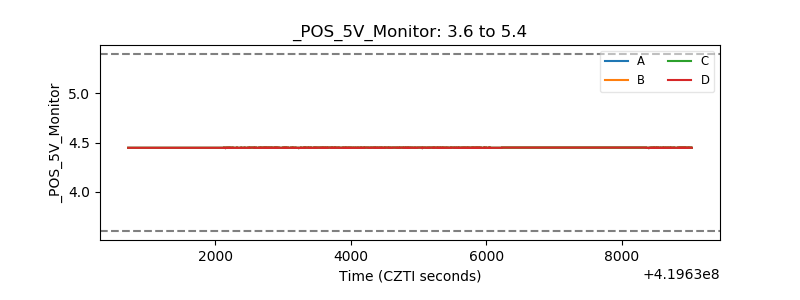 |
| _ROLL_ROT | 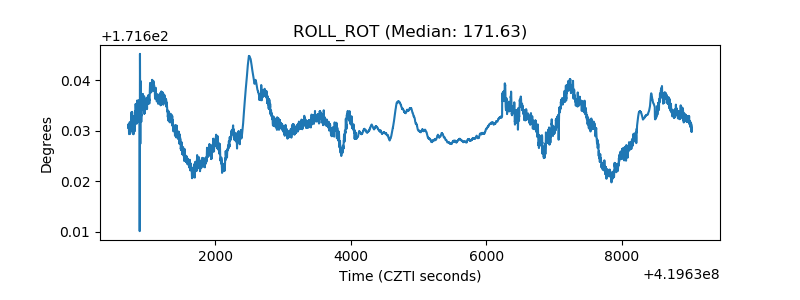 |
| _Roll_DEC | 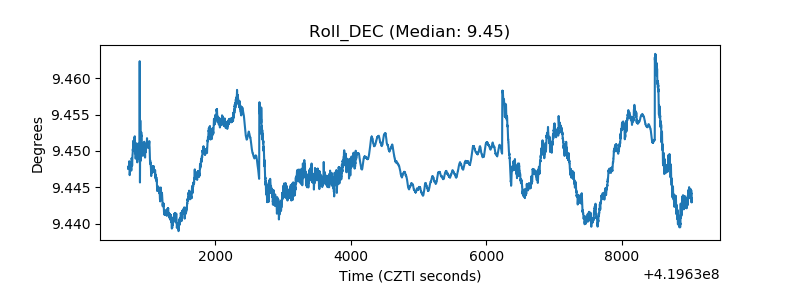 |
| _Roll_RA | 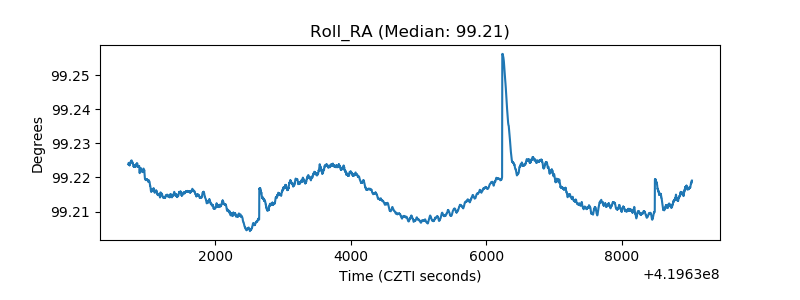 |
| Veto Counter | 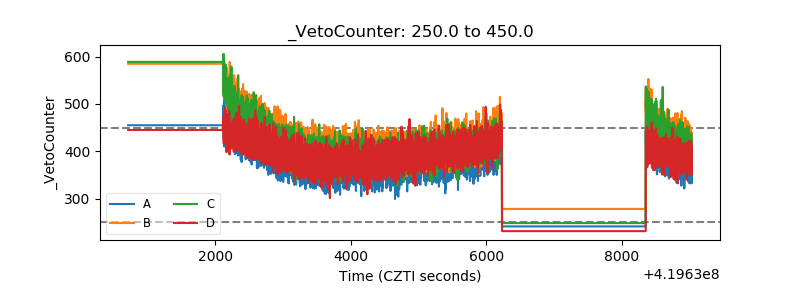 |