| Param | Original file | Final file |
|---|---|---|
| Filename | modeM0/AS1A12_097T01_9000005574_40868cztM0_level2.fits | modeM0/AS1A12_097T01_9000005574_40868cztM0_level2_quad_clean.evt |
| Size (bytes) | 362,900,160 | 81,541,440 |
| Size | 346.1 MB | 77.8 MB |
| Events in quadrant A | 2,815,761 | 553,139 |
| Events in quadrant B | 3,470,715 | 561,172 |
| Events in quadrant C | 2,480,274 | 546,979 |
| Events in quadrant D | 4,285,273 | 463,844 |
| Mode M9 | |||
|---|---|---|---|
| Quadrant | BADHDUFLAG | Total packets | Discarded packets |
| A | 0 | 33 | 0 |
| B | 0 | 33 | 0 |
| C | 0 | 33 | 0 |
| D | 0 | 34 | 0 |
| Mode SS | |||
|---|---|---|---|
| Quadrant | BADHDUFLAG | Total packets | Discarded packets |
| A | 0 | 100 | 0 |
| B | 0 | 100 | 0 |
| C | 0 | 100 | 0 |
| D | 0 | 100 | 0 |
| Mode M0 | |||
|---|---|---|---|
| Quadrant | BADHDUFLAG | Total packets | Discarded packets |
| A | 0 | 11300 | 3 |
| B | 0 | 13581 | 2 |
| C | 0 | 10353 | 2 |
| D | 0 | 16091 | 2 |
| Quadrant | Total seconds | Saturated seconds | Saturation percentage |
|---|---|---|---|
| A | 4902 | 23 | 0.469196% |
| B | 4902 | 250 | 5.099959% |
| C | 4902 | 32 | 0.652795% |
| D | 4902 | 396 | 8.078335% |
Noise dominated data is calculated using 1-second bins in cleaned event files. If a bin has >2000 counts, and if more than 50% of those come from <1% of pixels, then it is considered to be noise-dominated and hence unusable.
| Quadrant | # 1 sec bins | Bins with >0 counts | Bins with >2000 counts | High rate bins dominated by noise | Noise dominated (total time) | Noise dominated (detector-on time) | Marked lightcurve |
|---|---|---|---|---|---|---|---|
| A | 6994 | 4903 | 13 | 13 | 0.19% | 0.27% | 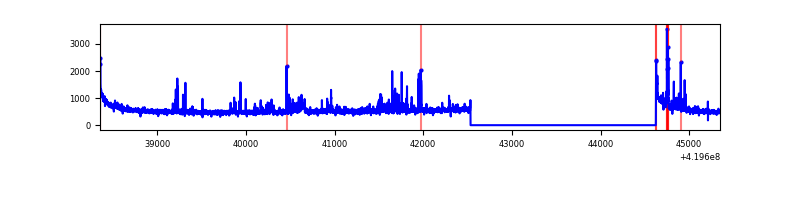 |
| B | 6994 | 4903 | 153 | 153 | 2.19% | 3.12% | 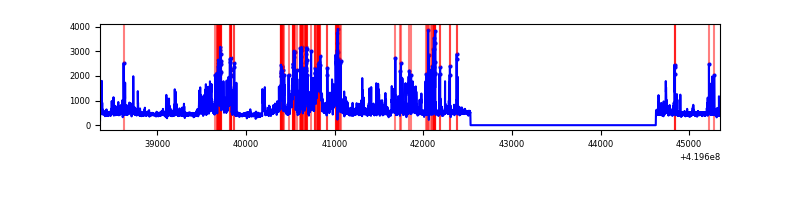 |
| C | 6994 | 4903 | 34 | 34 | 0.49% | 0.69% | 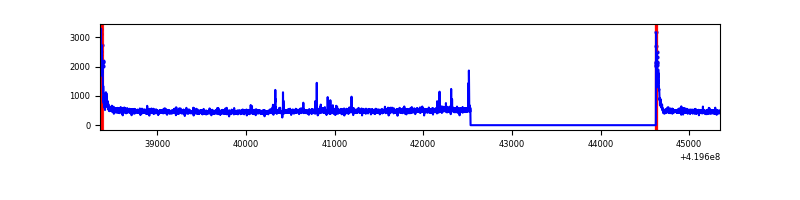 |
| D | 6994 | 4903 | 332 | 332 | 4.75% | 6.77% | 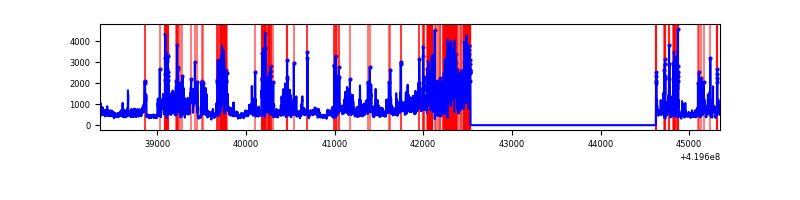 |
Top three noisy pixels from each quadrant. If the there are fewer than three noisy pixels in the level2.evt file, extra rows are filled as -1
| Pixel properties | Quadrant properties | ||||||
|---|---|---|---|---|---|---|---|
| Quadrant | DetID | PixID | Counts | Sigma | Mean | Median | Sigma |
| A | 10 | 83 | 468247 | 4101.73 | 549 | 538 | 114.0 |
| A | 13 | 248 | 164414 | 1437.16 | 549 | 538 | 114.0 |
| A | 12 | 189 | 51620 | 447.98 | 549 | 538 | 114.0 |
| B | 4 | 171 | 1216616 | 11442.5 | 544 | 529 | 106.3 |
| B | 0 | 229 | 53836 | 501.58 | 544 | 529 | 106.3 |
| B | 5 | 255 | 50935 | 474.28 | 544 | 529 | 106.3 |
| C | 15 | 214 | 208018 | 1637.15 | 536 | 540 | 126.7 |
| C | 0 | 10 | 142680 | 1121.59 | 536 | 540 | 126.7 |
| C | 10 | 70 | 15300 | 116.47 | 536 | 540 | 126.7 |
| D | 12 | 79 | 835761 | 6534.61 | 512 | 497 | 127.8 |
| D | 2 | 249 | 590751 | 4617.8 | 512 | 497 | 127.8 |
| D | 12 | 233 | 560700 | 4382.7 | 512 | 497 | 127.8 |
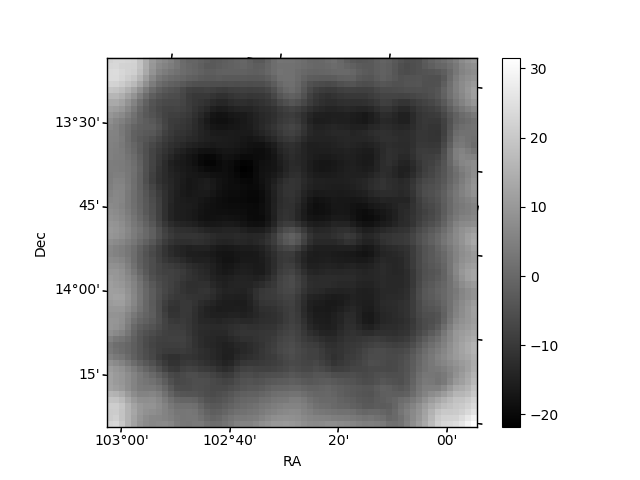
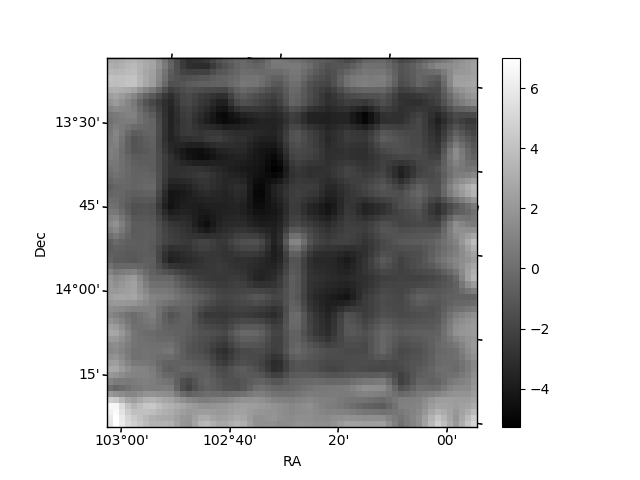
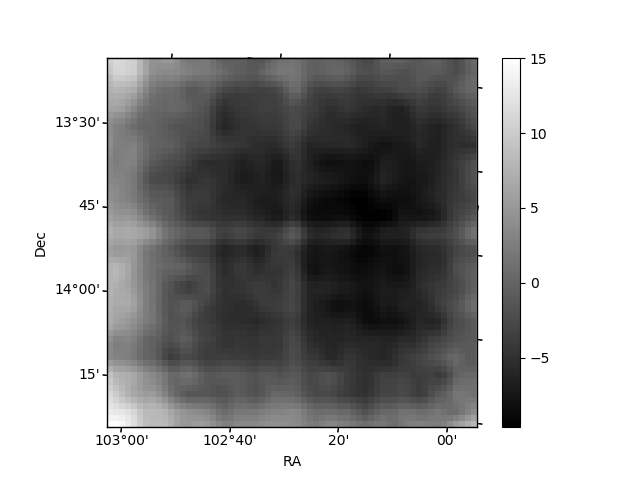
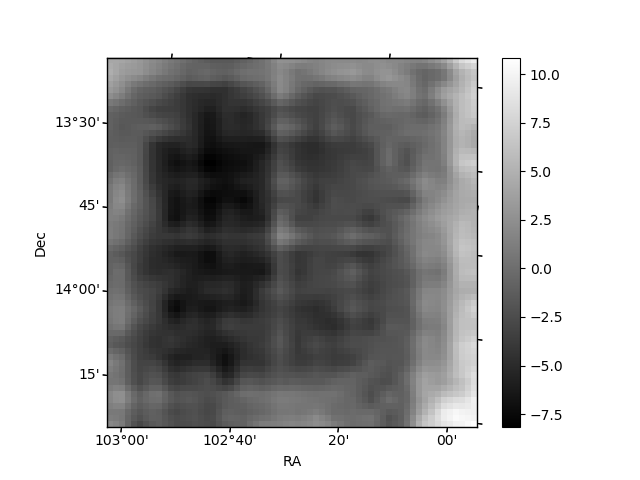
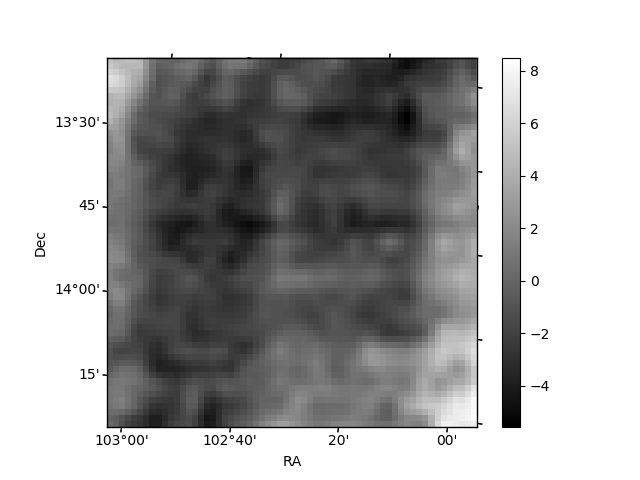
Histogram calculated using DETX and DETY for each event in the final _common_clean file
| Quadrant A | 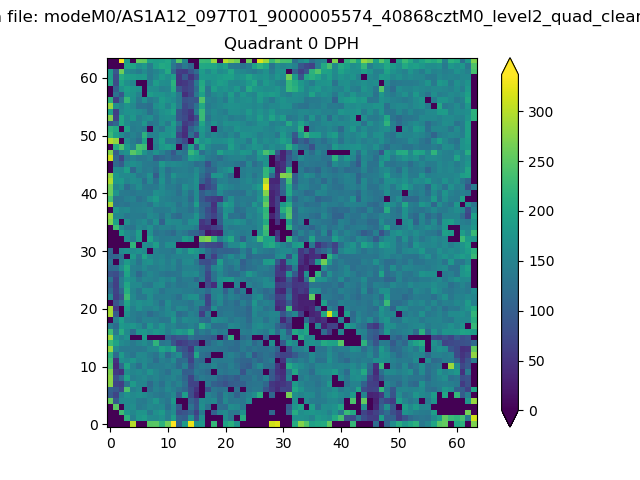 |
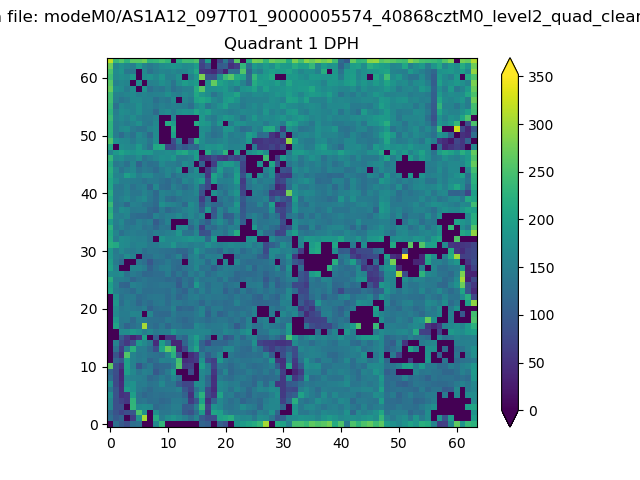 |
Quadrant B |
|---|---|---|---|
| Quadrant D | 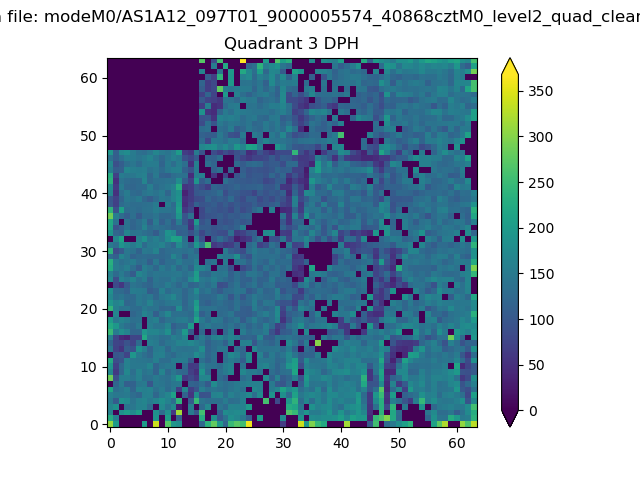 |
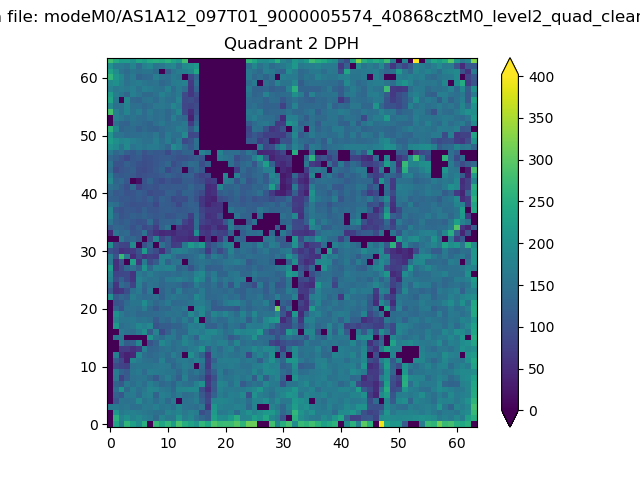 |
Quadrant C |
| Plot type | Count rate plots | Images |
|---|---|---|
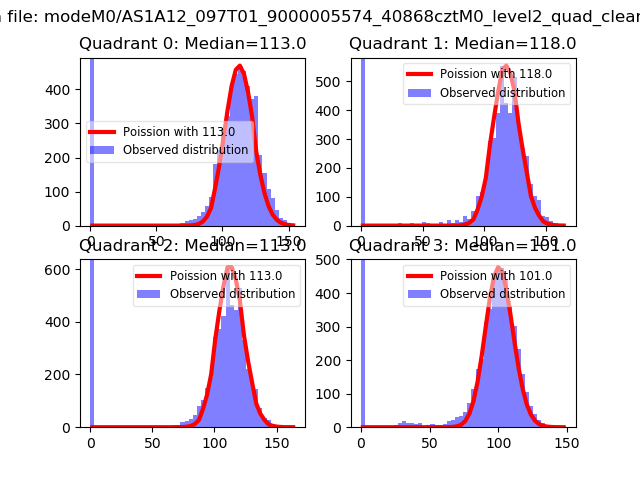
| Comparison with Poisson distribution Blue bars denote a histogram of data divided into 1 sec bins. Red curve is a Poisson curve with rate = median count rate of data. |
 |
 |
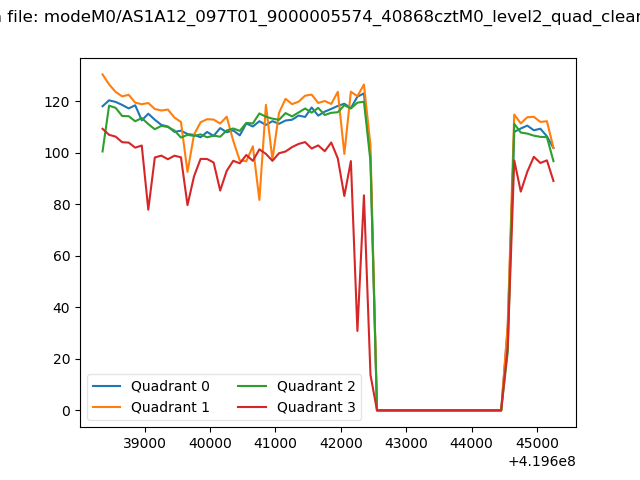
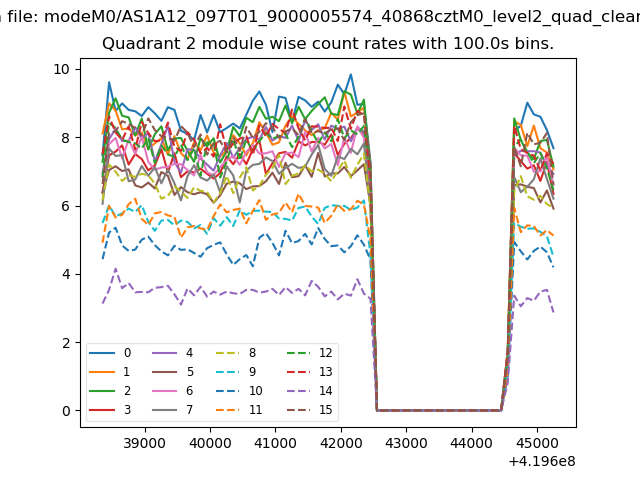
| Quadrant-wise count rates Data is divided into 100 sec bins |
 |
|
| Module-wise count rates for Quadrant A Data is divided into 100 sec bins |
 |
 |
| Module-wise count rates for Quadrant B Data is divided into 100 sec bins |
 |
 |
| Module-wise count rates for Quadrant C Data is divided into 100 sec bins |
 |
 |
| Module-wise count rates for Quadrant D Data is divided into 100 sec bins |
 |
 |
| Parameter | Plot |
|---|---|
| CZT HV Monitor | 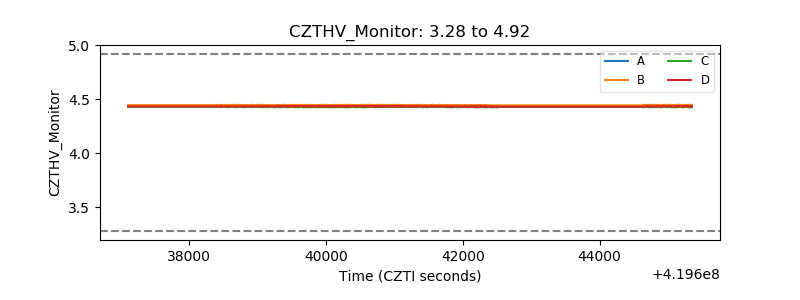 |
| D_VDD | 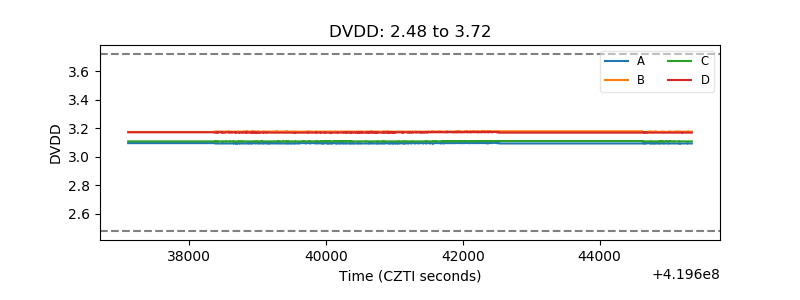 |
| Temperature 1 | 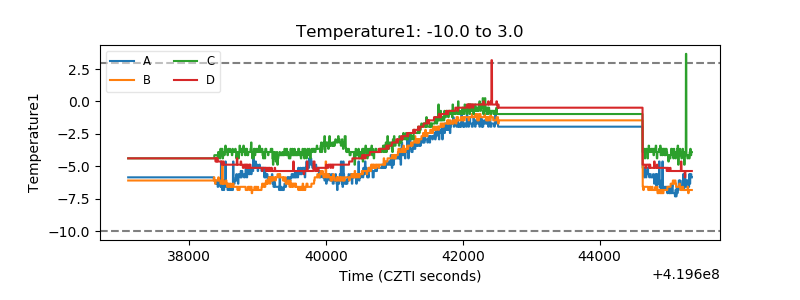 |
| Veto HV Monitor | 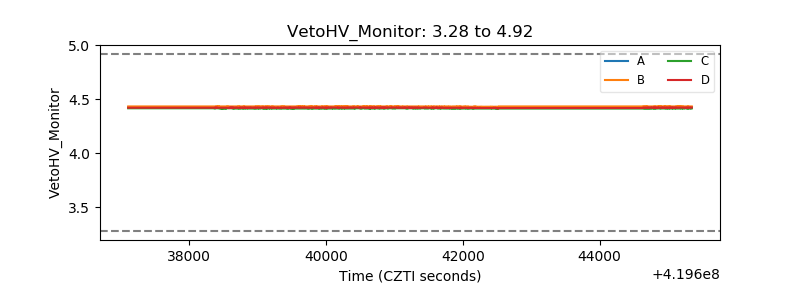 |
| Veto LLD | 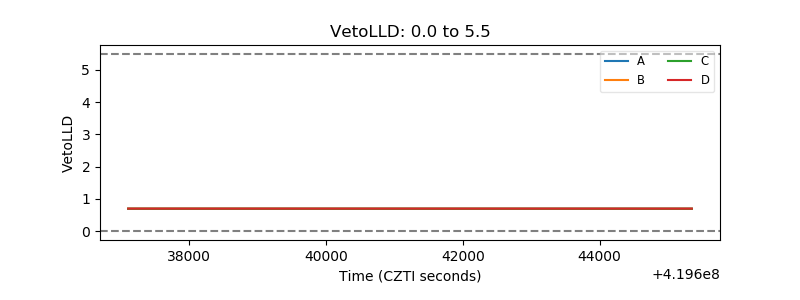 |
| Alpha Counter |  |
| _CPM_Rate |  |
| CZT Counter | 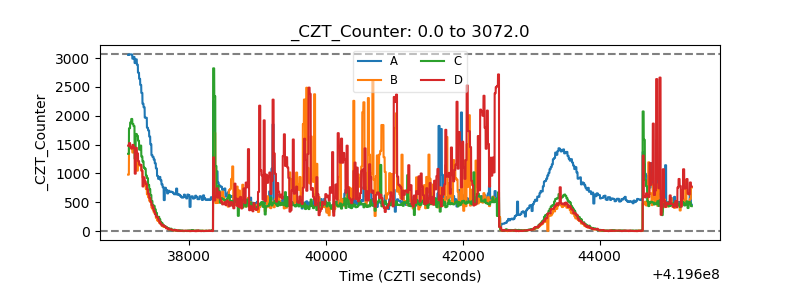 |
| +2.5 Volts monitor | 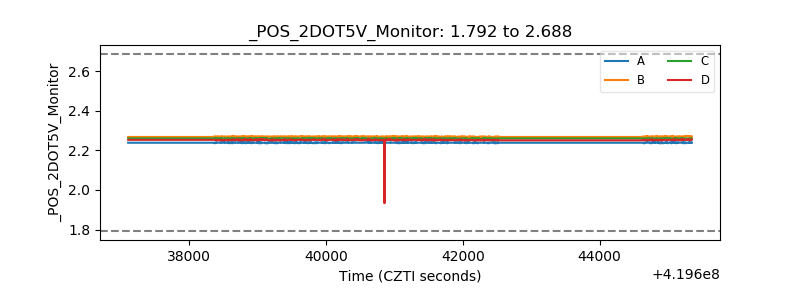 |
| +5 Volts monitor | 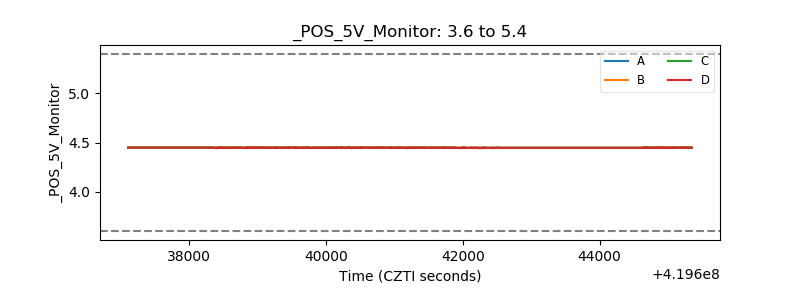 |
| _ROLL_ROT | 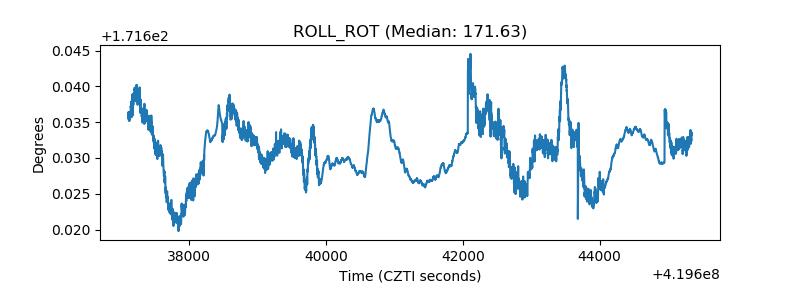 |
| _Roll_DEC | 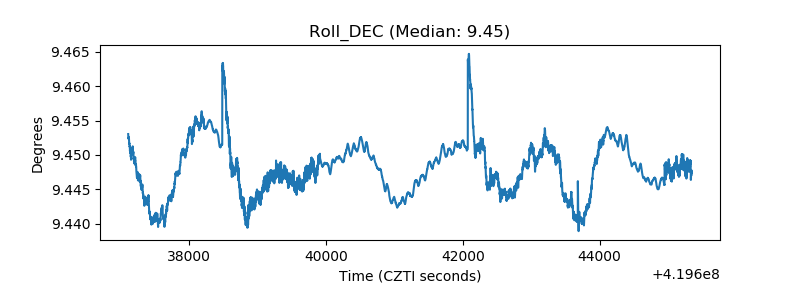 |
| _Roll_RA | 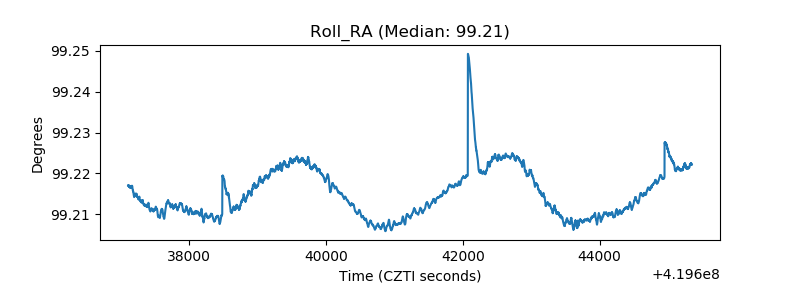 |
| Veto Counter | 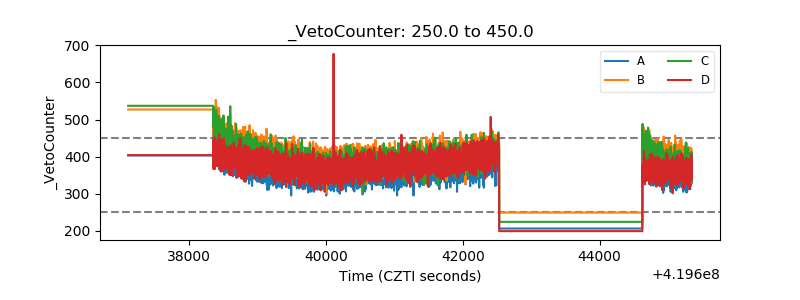 |