| Param | Original file | Final file |
|---|---|---|
| Filename | modeM0/AS1A12_097T01_9000005574_40869cztM0_level2.fits | modeM0/AS1A12_097T01_9000005574_40869cztM0_level2_quad_clean.evt |
| Size (bytes) | 470,822,400 | 86,094,720 |
| Size | 449.0 MB | 82.1 MB |
| Events in quadrant A | 3,273,679 | 595,094 |
| Events in quadrant B | 4,213,132 | 575,076 |
| Events in quadrant C | 2,799,455 | 591,109 |
| Events in quadrant D | 6,715,279 | 460,531 |
| Mode M9 | |||
|---|---|---|---|
| Quadrant | BADHDUFLAG | Total packets | Discarded packets |
| A | 0 | 39 | 0 |
| B | 0 | 39 | 0 |
| C | 0 | 39 | 0 |
| D | 0 | 39 | 0 |
| Mode SS | |||
|---|---|---|---|
| Quadrant | BADHDUFLAG | Total packets | Discarded packets |
| A | 0 | 114 | 0 |
| B | 0 | 114 | 0 |
| C | 0 | 114 | 0 |
| D | 0 | 114 | 0 |
| Mode M0 | |||
|---|---|---|---|
| Quadrant | BADHDUFLAG | Total packets | Discarded packets |
| A | 0 | 13026 | 3 |
| B | 0 | 16257 | 2 |
| C | 0 | 11742 | 2 |
| D | 0 | 23718 | 2 |
| Quadrant | Total seconds | Saturated seconds | Saturation percentage |
|---|---|---|---|
| A | 5493 | 63 | 1.146914% |
| B | 5493 | 573 | 10.431458% |
| C | 5493 | 25 | 0.455125% |
| D | 5493 | 1062 | 19.333697% |
Noise dominated data is calculated using 1-second bins in cleaned event files. If a bin has >2000 counts, and if more than 50% of those come from <1% of pixels, then it is considered to be noise-dominated and hence unusable.
| Quadrant | # 1 sec bins | Bins with >0 counts | Bins with >2000 counts | High rate bins dominated by noise | Noise dominated (total time) | Noise dominated (detector-on time) | Marked lightcurve |
|---|---|---|---|---|---|---|---|
| A | 9468 | 5495 | 39 | 39 | 0.41% | 0.71% | 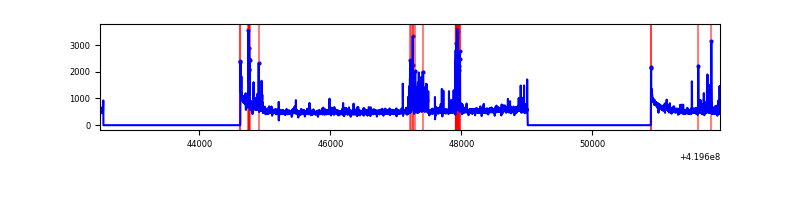 |
| B | 9468 | 5495 | 339 | 339 | 3.58% | 6.17% | 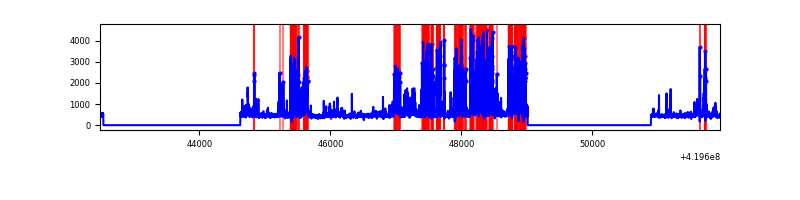 |
| C | 9468 | 5495 | 22 | 22 | 0.23% | 0.40% | 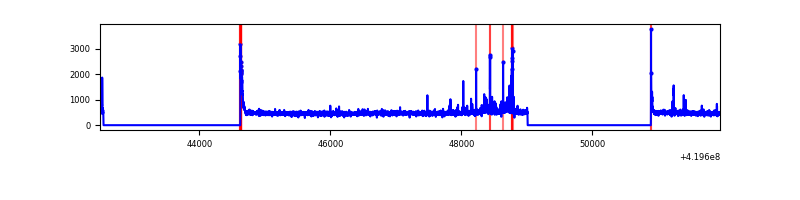 |
| D | 9468 | 5495 | 1010 | 1010 | 10.67% | 18.38% | 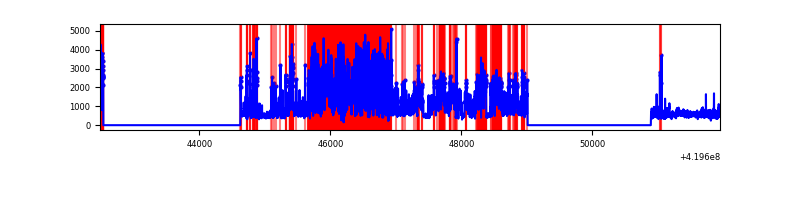 |
Top three noisy pixels from each quadrant. If the there are fewer than three noisy pixels in the level2.evt file, extra rows are filled as -1
| Pixel properties | Quadrant properties | ||||||
|---|---|---|---|---|---|---|---|
| Quadrant | DetID | PixID | Counts | Sigma | Mean | Median | Sigma |
| A | 10 | 83 | 530989 | 4228.26 | 605 | 594 | 125.4 |
| A | 13 | 248 | 336871 | 2680.77 | 605 | 594 | 125.4 |
| A | 2 | 79 | 48553 | 382.32 | 605 | 594 | 125.4 |
| B | 4 | 171 | 1722991 | 15236.52 | 582 | 565 | 113.0 |
| B | 0 | 229 | 125039 | 1101.09 | 582 | 565 | 113.0 |
| B | 5 | 255 | 24119 | 208.36 | 582 | 565 | 113.0 |
| C | 15 | 214 | 234900 | 1667.99 | 594 | 597 | 140.5 |
| C | 14 | 254 | 106457 | 753.61 | 594 | 597 | 140.5 |
| C | 0 | 10 | 83811 | 592.4 | 594 | 597 | 140.5 |
| D | 12 | 79 | 1801039 | 13097.59 | 552 | 536 | 137.5 |
| D | 1 | 47 | 1692861 | 12310.66 | 552 | 536 | 137.5 |
| D | 2 | 249 | 478816 | 3479.2 | 552 | 536 | 137.5 |
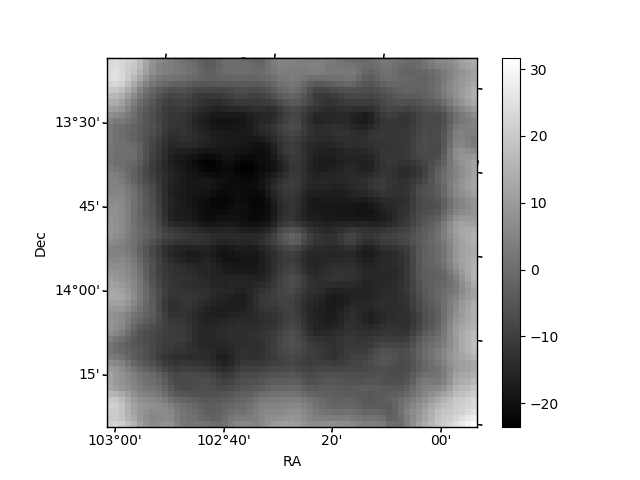
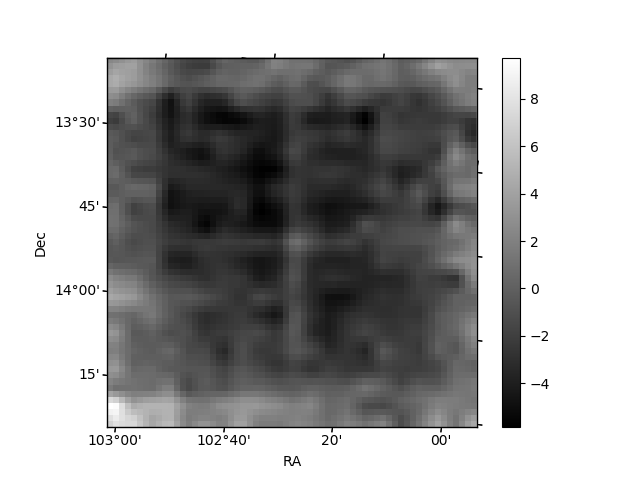
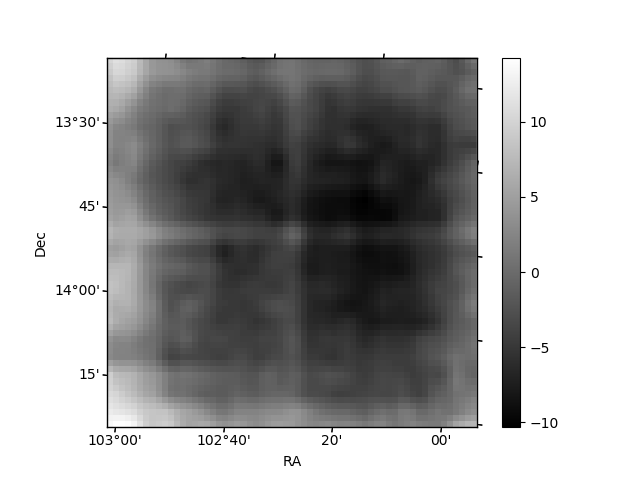
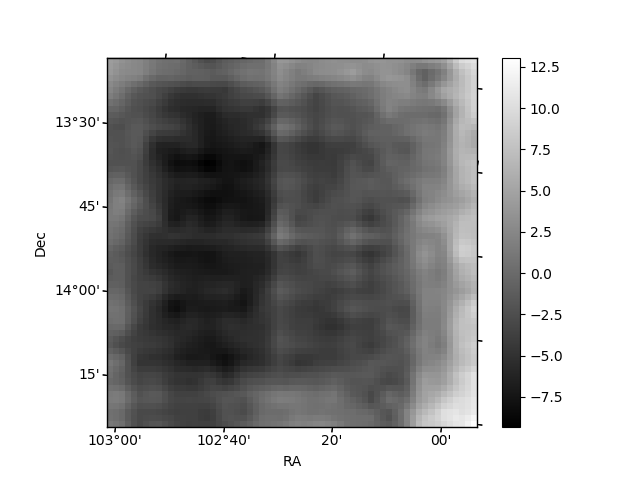
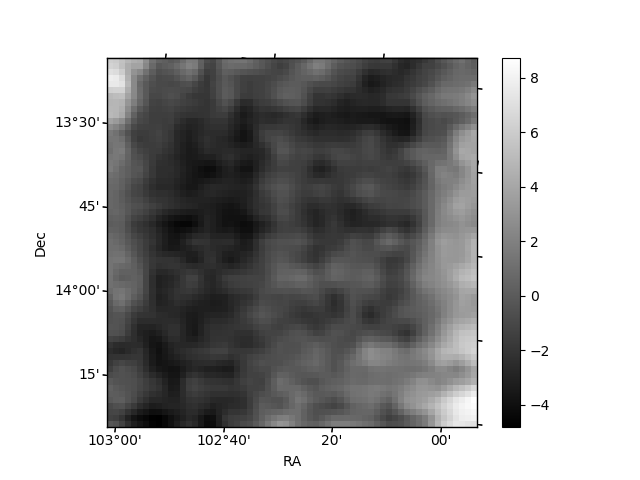
Histogram calculated using DETX and DETY for each event in the final _common_clean file
| Quadrant A | 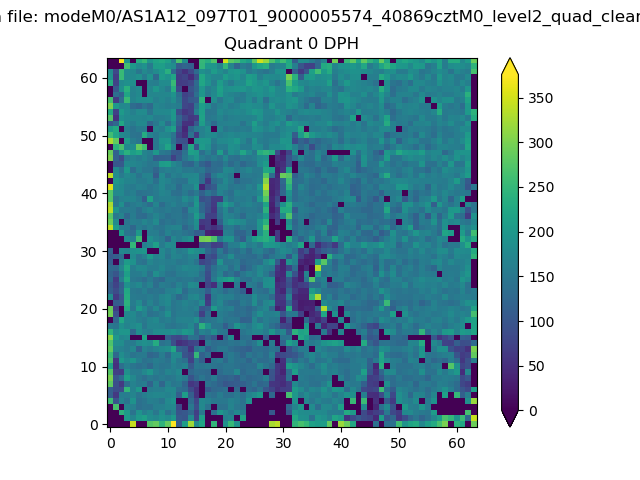 |
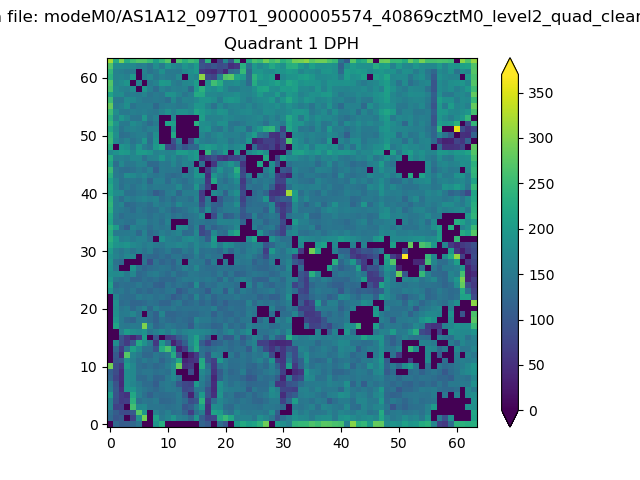 |
Quadrant B |
|---|---|---|---|
| Quadrant D | 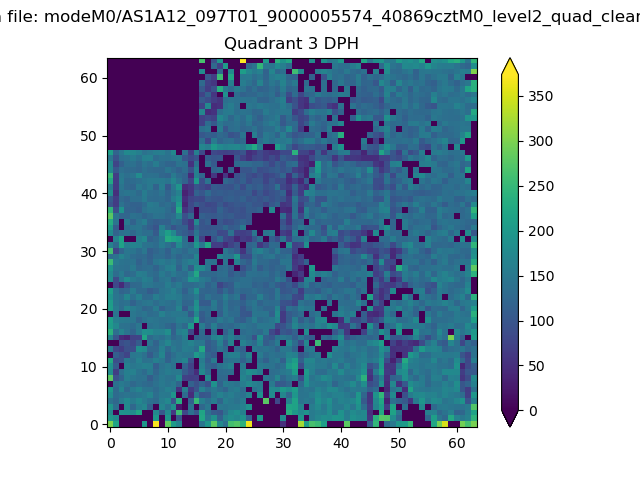 |
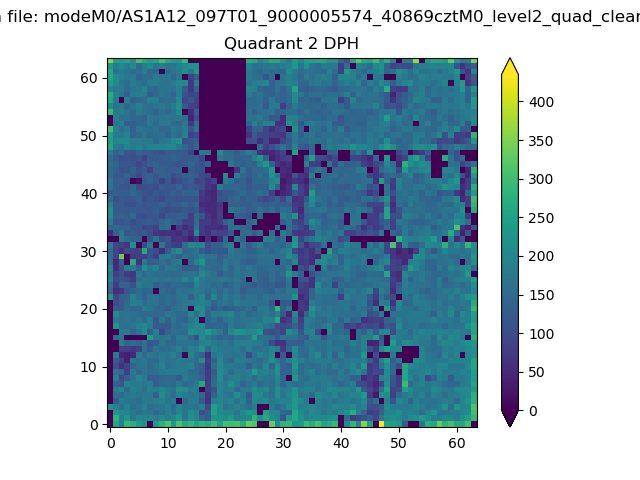 |
Quadrant C |
| Plot type | Count rate plots | Images |
|---|---|---|
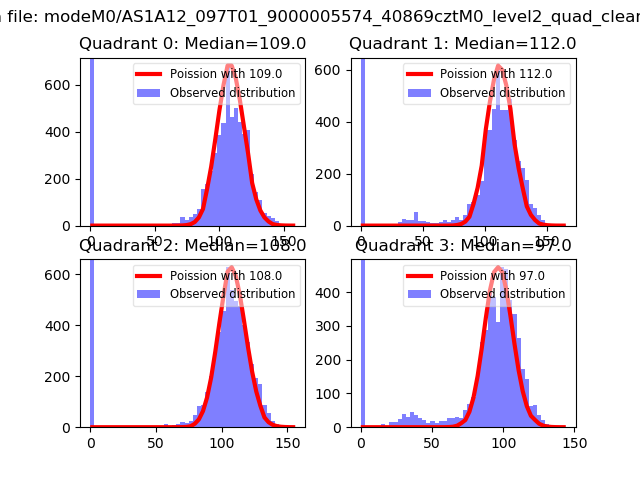
| Comparison with Poisson distribution Blue bars denote a histogram of data divided into 1 sec bins. Red curve is a Poisson curve with rate = median count rate of data. |
 |
 |
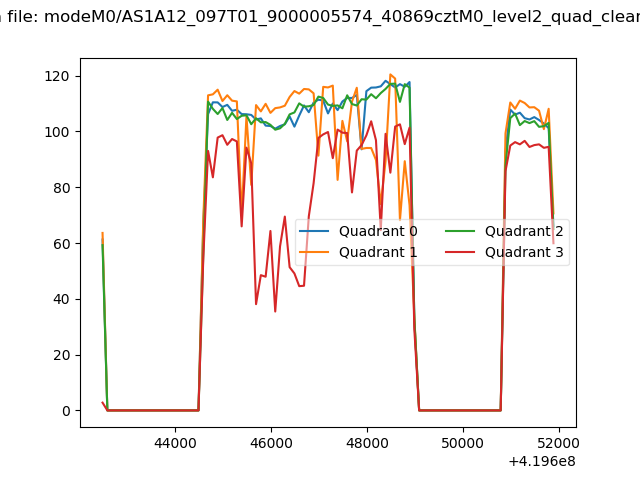
| Quadrant-wise count rates Data is divided into 100 sec bins |
 |
|
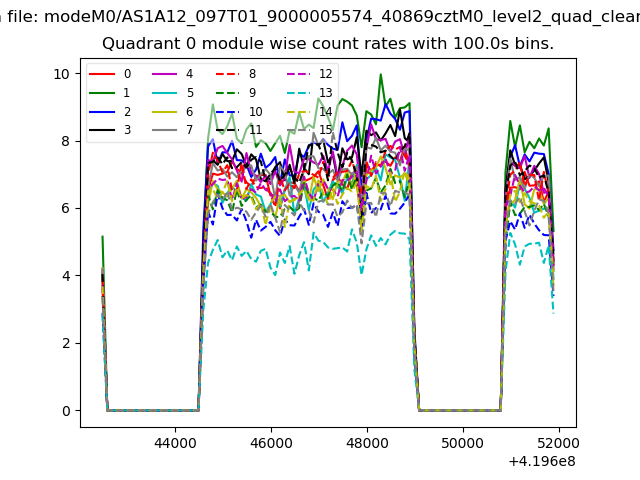
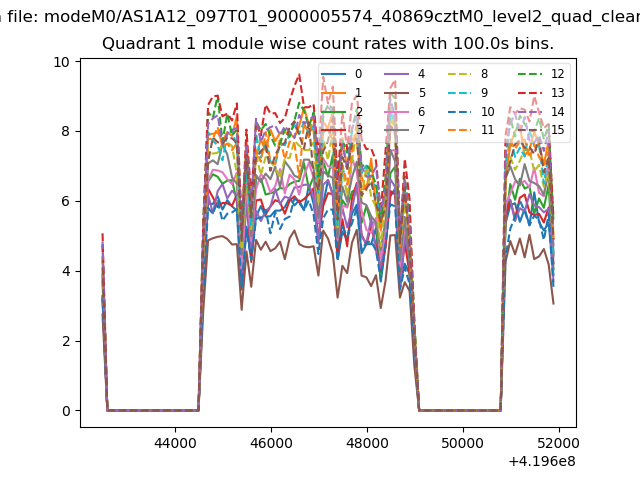
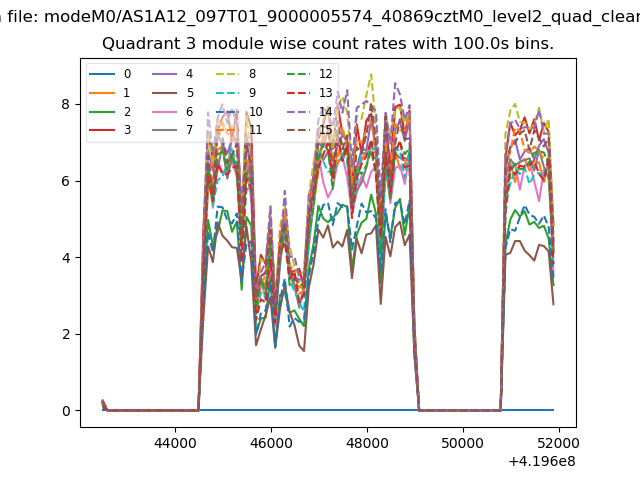
| Module-wise count rates for Quadrant A Data is divided into 100 sec bins |
 |
 |
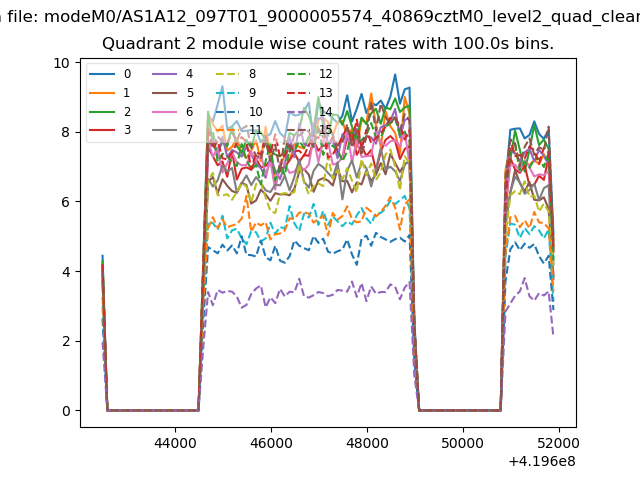
| Module-wise count rates for Quadrant B Data is divided into 100 sec bins |
 |
 |
| Module-wise count rates for Quadrant C Data is divided into 100 sec bins |
 |
 |
| Module-wise count rates for Quadrant D Data is divided into 100 sec bins |
 |
 |
| Parameter | Plot |
|---|---|
| CZT HV Monitor | 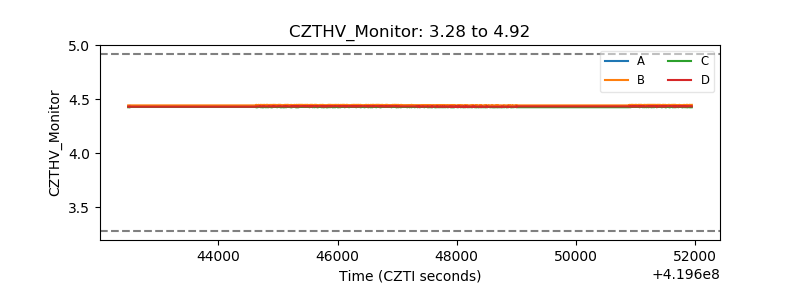 |
| D_VDD | 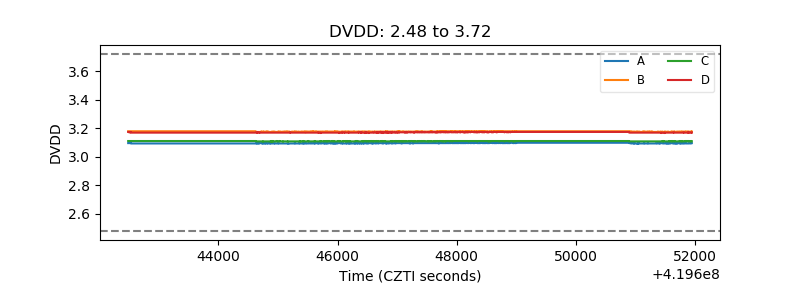 |
| Temperature 1 | 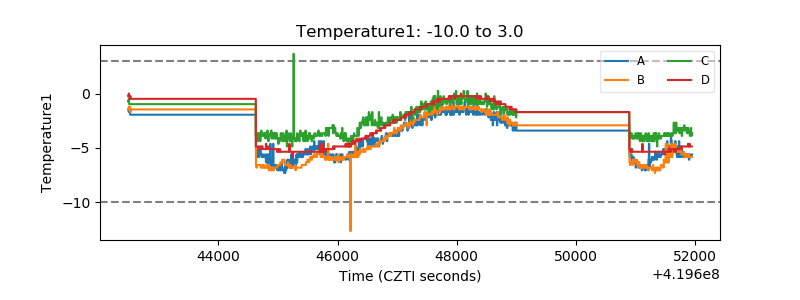 |
| Veto HV Monitor |  |
| Veto LLD | 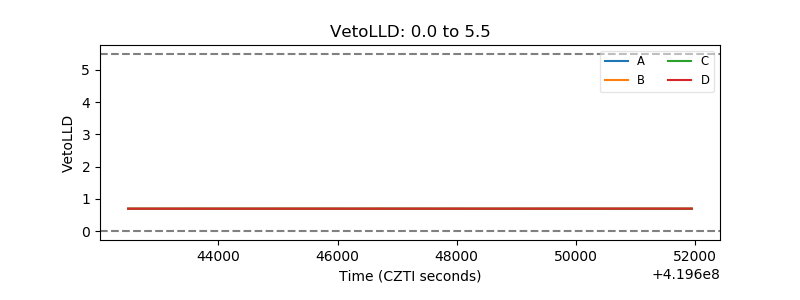 |
| Alpha Counter | 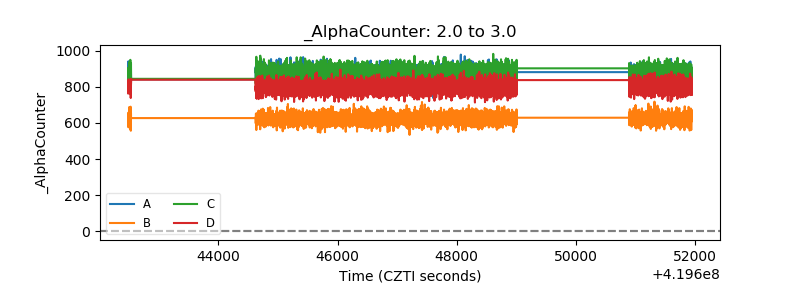 |
| _CPM_Rate |  |
| CZT Counter | 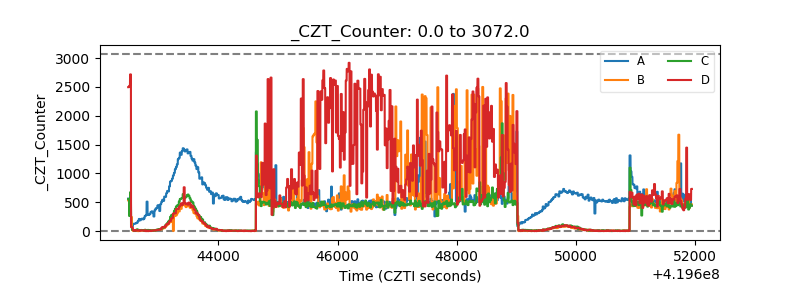 |
| +2.5 Volts monitor |  |
| +5 Volts monitor | 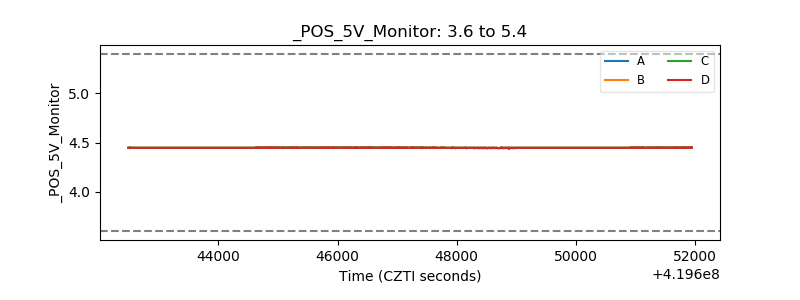 |
| _ROLL_ROT | 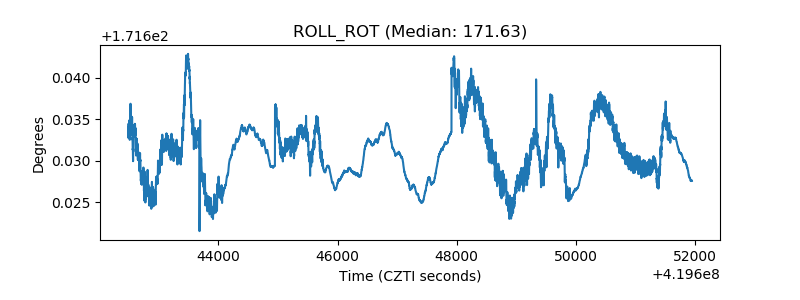 |
| _Roll_DEC | 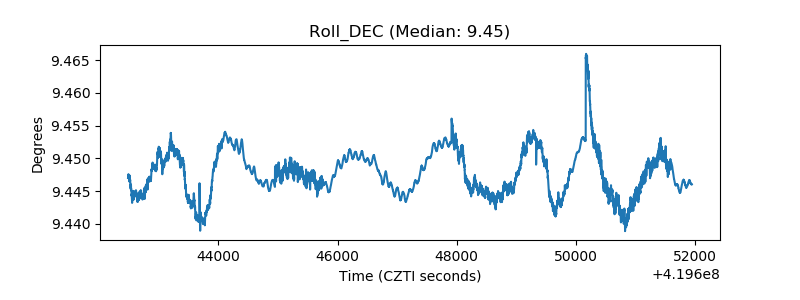 |
| _Roll_RA | 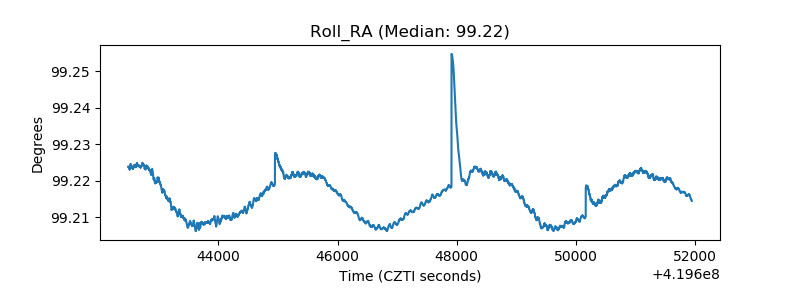 |
| Veto Counter | 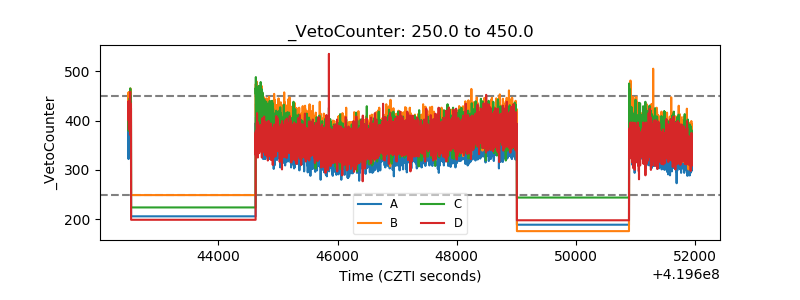 |