| Param | Original file | Final file |
|---|---|---|
| Filename | modeM0/AS1A12_097T01_9000005574_40874cztM0_level2.fits | modeM0/AS1A12_097T01_9000005574_40874cztM0_level2_quad_clean.evt |
| Size (bytes) | 715,492,800 | 174,271,680 |
| Size | 682.3 MB | 166.2 MB |
| Events in quadrant A | 6,061,204 | 1,157,146 |
| Events in quadrant B | 4,852,138 | 1,207,496 |
| Events in quadrant C | 5,163,565 | 1,151,916 |
| Events in quadrant D | 9,564,558 | 1,006,362 |
| Mode M9 | |||
|---|---|---|---|
| Quadrant | BADHDUFLAG | Total packets | Discarded packets |
| A | 0 | 36 | 0 |
| B | 0 | 36 | 0 |
| C | 0 | 36 | 0 |
| D | 0 | 37 | 0 |
| Mode SS | |||
|---|---|---|---|
| Quadrant | BADHDUFLAG | Total packets | Discarded packets |
| A | 0 | 220 | 0 |
| B | 0 | 220 | 0 |
| C | 0 | 220 | 0 |
| D | 0 | 220 | 0 |
| Mode M0 | |||
|---|---|---|---|
| Quadrant | BADHDUFLAG | Total packets | Discarded packets |
| A | 0 | 24599 | 4 |
| B | 0 | 22133 | 3 |
| C | 0 | 22183 | 3 |
| D | 0 | 35965 | 3 |
| Quadrant | Total seconds | Saturated seconds | Saturation percentage |
|---|---|---|---|
| A | 10890 | 44 | 0.404040% |
| B | 10890 | 22 | 0.202020% |
| C | 10890 | 13 | 0.119376% |
| D | 10890 | 652 | 5.987144% |
Noise dominated data is calculated using 1-second bins in cleaned event files. If a bin has >2000 counts, and if more than 50% of those come from <1% of pixels, then it is considered to be noise-dominated and hence unusable.
| Quadrant | # 1 sec bins | Bins with >0 counts | Bins with >2000 counts | High rate bins dominated by noise | Noise dominated (total time) | Noise dominated (detector-on time) | Marked lightcurve |
|---|---|---|---|---|---|---|---|
| A | 13664 | 10892 | 24 | 24 | 0.18% | 0.22% | 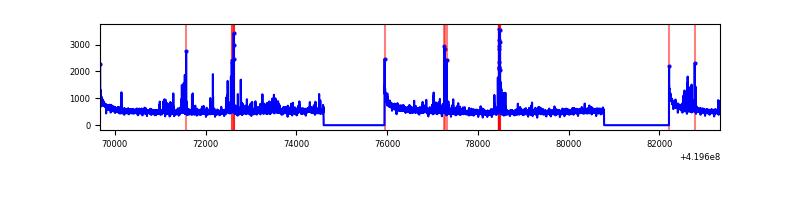 |
| B | 13664 | 10892 | 6 | 6 | 0.04% | 0.06% | 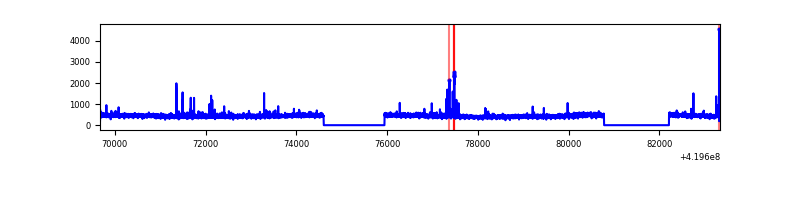 |
| C | 13664 | 10892 | 5 | 5 | 0.04% | 0.05% | 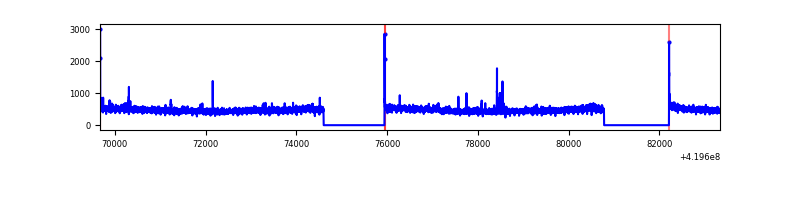 |
| D | 13664 | 10892 | 595 | 595 | 4.35% | 5.46% | 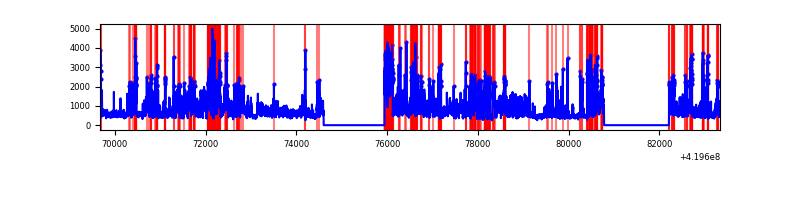 |
Top three noisy pixels from each quadrant. If the there are fewer than three noisy pixels in the level2.evt file, extra rows are filled as -1
| Pixel properties | Quadrant properties | ||||||
|---|---|---|---|---|---|---|---|
| Quadrant | DetID | PixID | Counts | Sigma | Mean | Median | Sigma |
| A | 10 | 83 | 974196 | 3977.25 | 1196 | 1169 | 244.6 |
| A | 13 | 248 | 249246 | 1014.01 | 1196 | 1169 | 244.6 |
| A | 12 | 189 | 203160 | 825.64 | 1196 | 1169 | 244.6 |
| B | 0 | 229 | 59960 | 255.02 | 1192 | 1159 | 230.6 |
| B | 15 | 35 | 40079 | 168.79 | 1192 | 1159 | 230.6 |
| B | 12 | 111 | 29722 | 123.88 | 1192 | 1159 | 230.6 |
| C | 15 | 214 | 457357 | 1654.73 | 1173 | 1181 | 275.7 |
| C | 9 | 54 | 43387 | 153.1 | 1173 | 1181 | 275.7 |
| C | 0 | 10 | 30156 | 105.1 | 1173 | 1181 | 275.7 |
| D | 12 | 79 | 2694223 | 9588.5 | 1139 | 1107 | 280.9 |
| D | 13 | 249 | 869208 | 3090.76 | 1139 | 1107 | 280.9 |
| D | 1 | 47 | 631432 | 2244.19 | 1139 | 1107 | 280.9 |
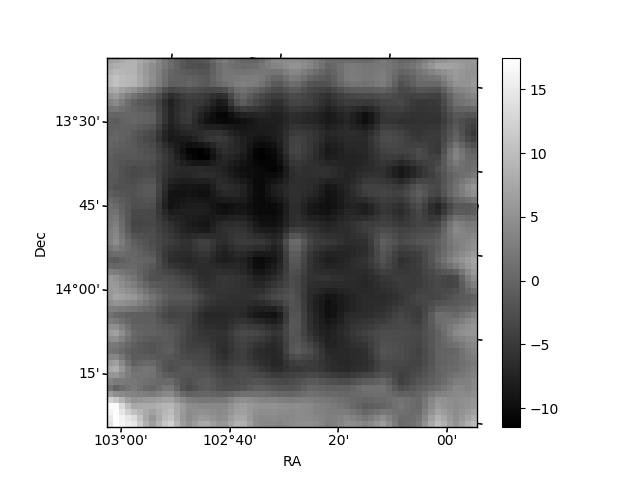
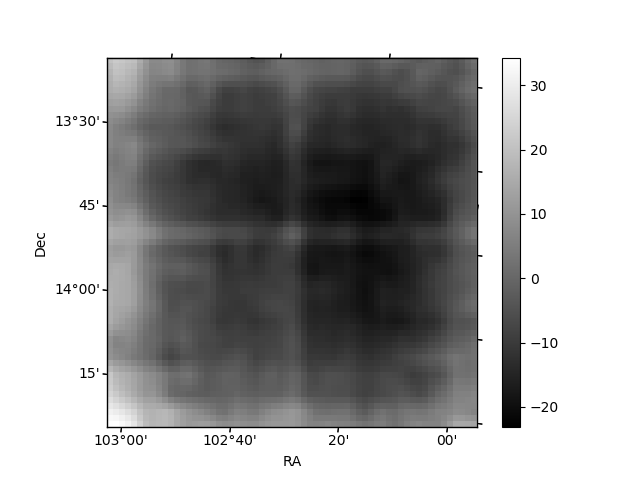
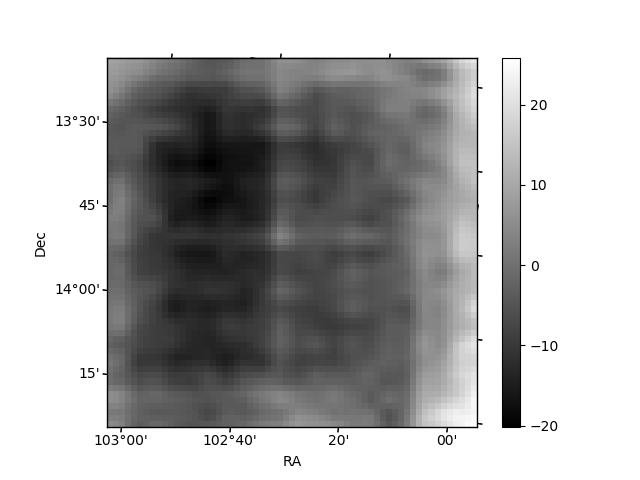
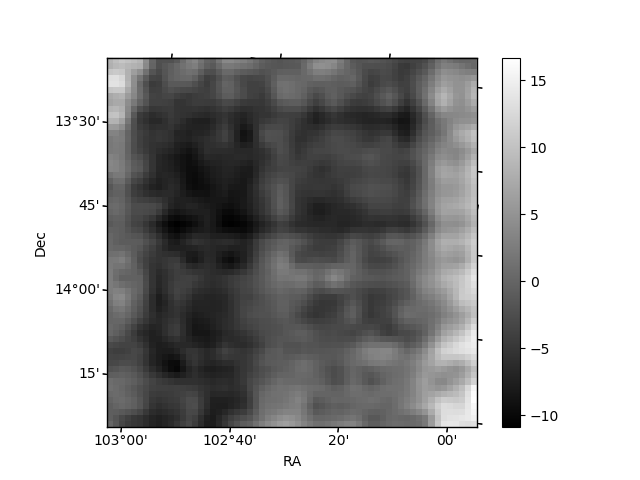
Histogram calculated using DETX and DETY for each event in the final _common_clean file
| Quadrant A | 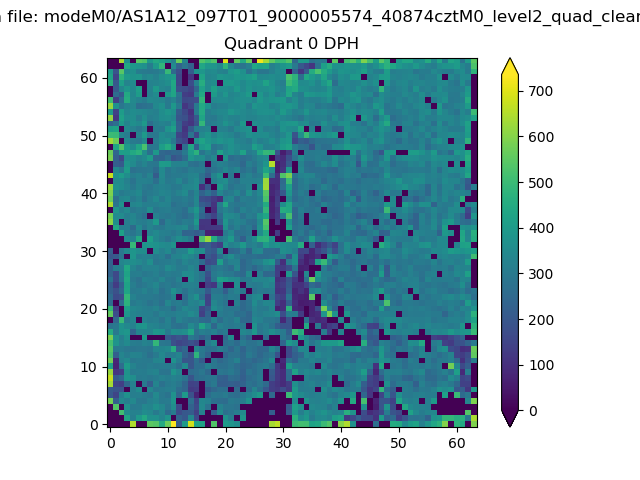 |
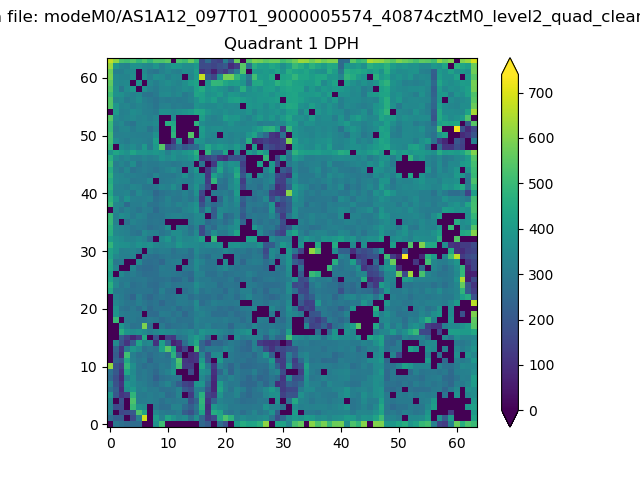 |
Quadrant B |
|---|---|---|---|
| Quadrant D | 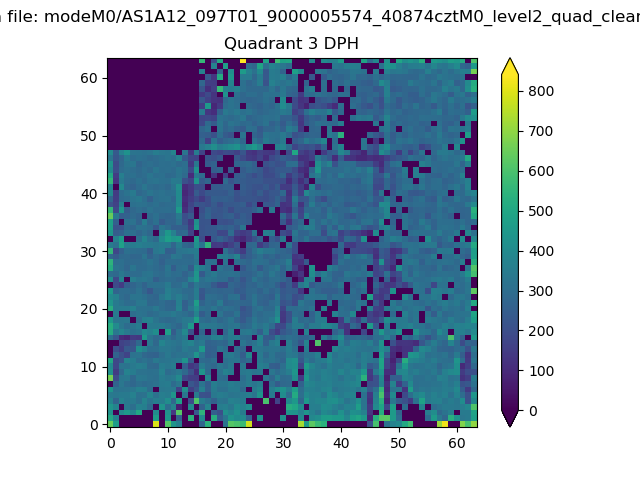 |
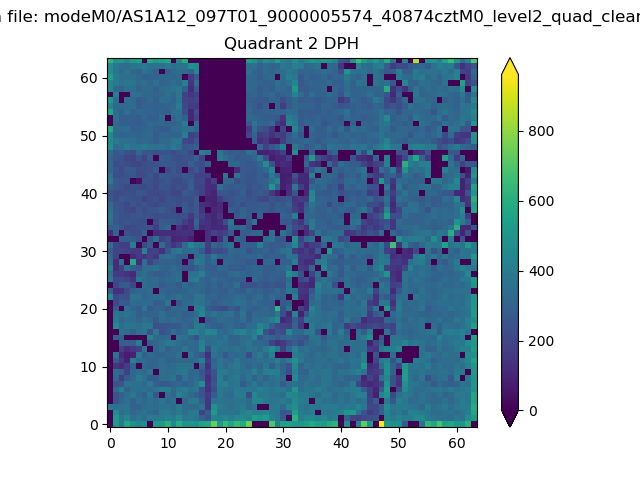 |
Quadrant C |
| Plot type | Count rate plots | Images |
|---|---|---|
| Comparison with Poisson distribution Blue bars denote a histogram of data divided into 1 sec bins. Red curve is a Poisson curve with rate = median count rate of data. |
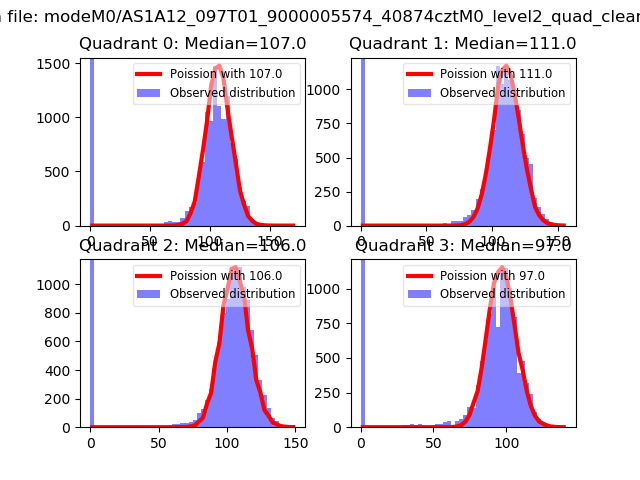 |
 |
| Quadrant-wise count rates Data is divided into 100 sec bins |
 |
|
| Module-wise count rates for Quadrant A Data is divided into 100 sec bins |
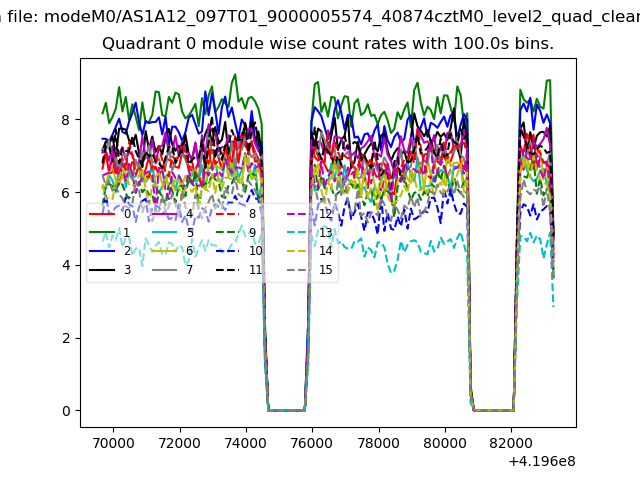 |
 |
| Module-wise count rates for Quadrant B Data is divided into 100 sec bins |
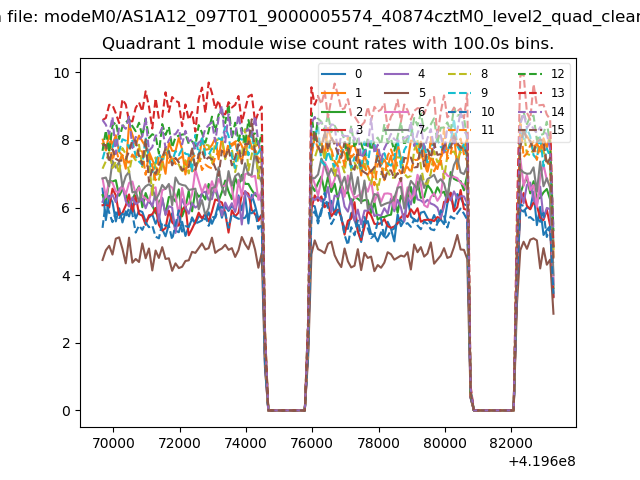 |
 |
| Module-wise count rates for Quadrant C Data is divided into 100 sec bins |
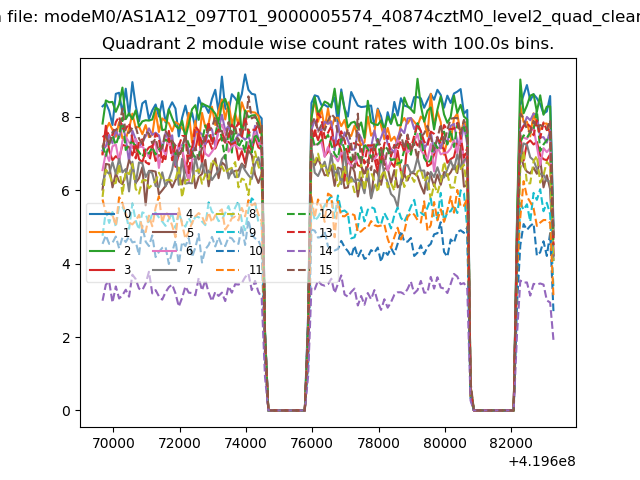 |
 |
| Module-wise count rates for Quadrant D Data is divided into 100 sec bins |
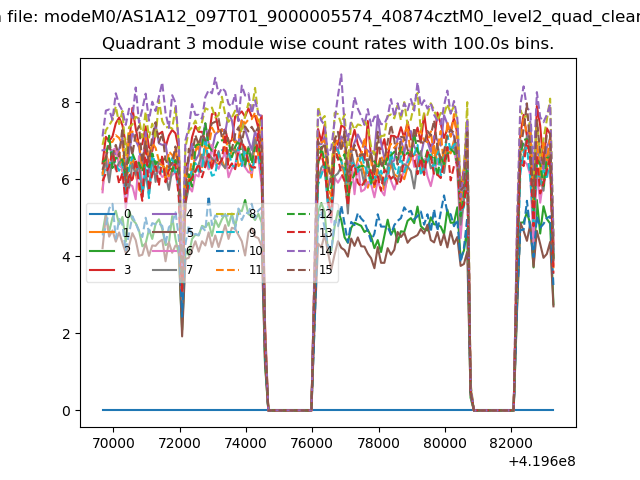 |
 |
| Parameter | Plot |
|---|---|
| CZT HV Monitor |  |
| D_VDD | 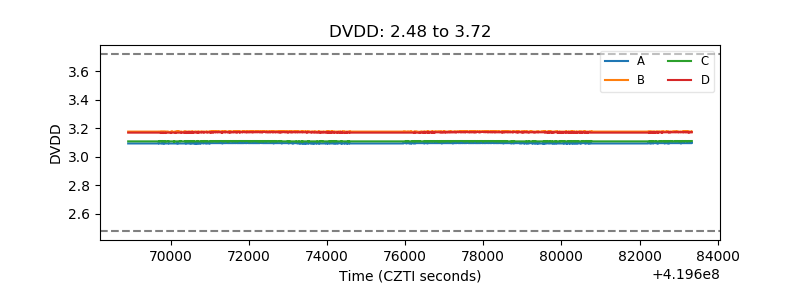 |
| Temperature 1 |  |
| Veto HV Monitor | 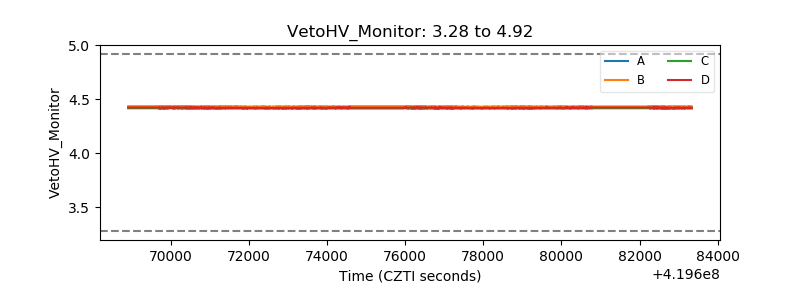 |
| Veto LLD | 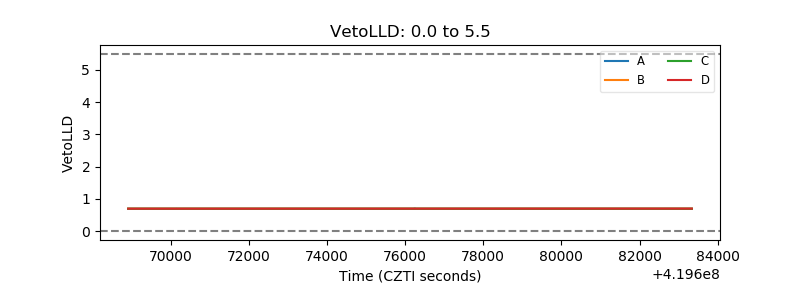 |
| Alpha Counter |  |
| _CPM_Rate |  |
| CZT Counter | 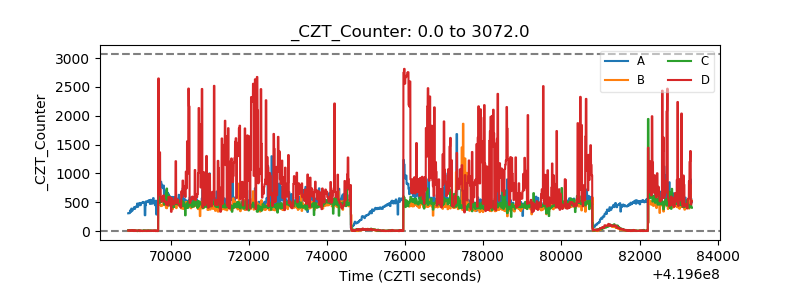 |
| +2.5 Volts monitor | 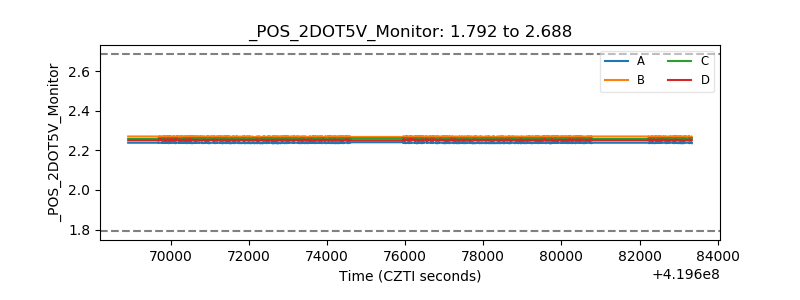 |
| +5 Volts monitor |  |
| _ROLL_ROT | 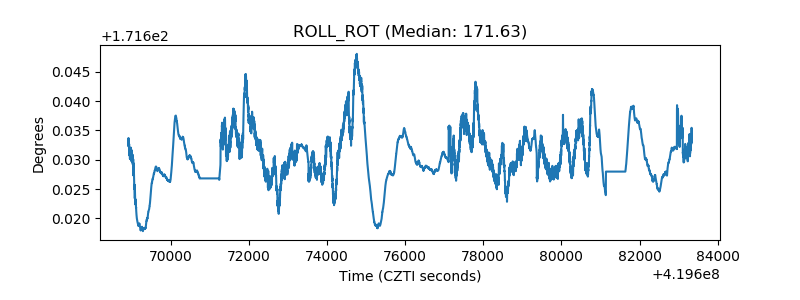 |
| _Roll_DEC | 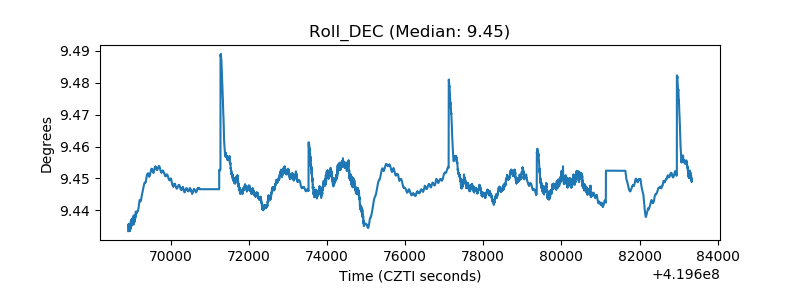 |
| _Roll_RA | 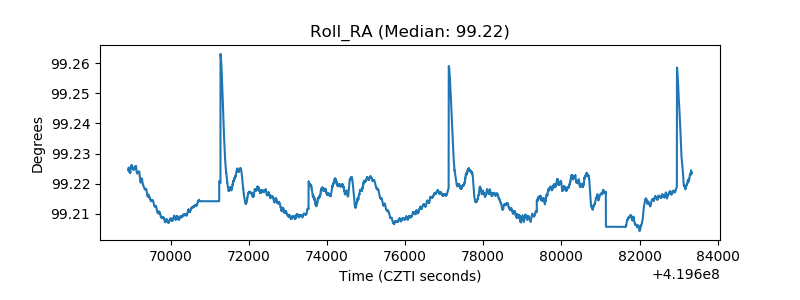 |
| Veto Counter | 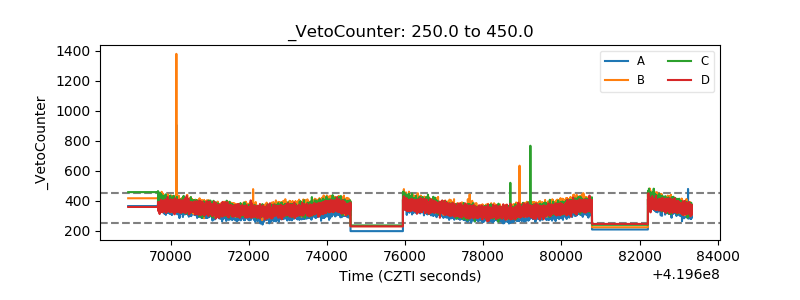 |