| Param | Original file | Final file |
|---|---|---|
| Filename | modeM0/AS1A12_097T01_9000005574_40875cztM0_level2.fits | modeM0/AS1A12_097T01_9000005574_40875cztM0_level2_quad_clean.evt |
| Size (bytes) | 392,702,400 | 92,090,880 |
| Size | 374.5 MB | 87.8 MB |
| Events in quadrant A | 3,147,420 | 616,373 |
| Events in quadrant B | 2,699,248 | 636,545 |
| Events in quadrant C | 2,692,123 | 611,649 |
| Events in quadrant D | 5,552,882 | 523,991 |
| Mode M9 | |||
|---|---|---|---|
| Quadrant | BADHDUFLAG | Total packets | Discarded packets |
| A | 0 | 15 | 0 |
| B | 0 | 15 | 0 |
| C | 0 | 15 | 0 |
| D | 0 | 16 | 0 |
| Mode SS | |||
|---|---|---|---|
| Quadrant | BADHDUFLAG | Total packets | Discarded packets |
| A | 0 | 116 | 0 |
| B | 0 | 116 | 0 |
| C | 0 | 116 | 0 |
| D | 0 | 116 | 0 |
| Mode M0 | |||
|---|---|---|---|
| Quadrant | BADHDUFLAG | Total packets | Discarded packets |
| A | 0 | 12869 | 3 |
| B | 0 | 12074 | 2 |
| C | 0 | 11686 | 2 |
| D | 0 | 20438 | 2 |
| Quadrant | Total seconds | Saturated seconds | Saturation percentage |
|---|---|---|---|
| A | 5718 | 19 | 0.332284% |
| B | 5718 | 37 | 0.647079% |
| C | 5718 | 10 | 0.174886% |
| D | 5718 | 495 | 8.656873% |
Noise dominated data is calculated using 1-second bins in cleaned event files. If a bin has >2000 counts, and if more than 50% of those come from <1% of pixels, then it is considered to be noise-dominated and hence unusable.
| Quadrant | # 1 sec bins | Bins with >0 counts | Bins with >2000 counts | High rate bins dominated by noise | Noise dominated (total time) | Noise dominated (detector-on time) | Marked lightcurve |
|---|---|---|---|---|---|---|---|
| A | 7270 | 5719 | 6 | 6 | 0.08% | 0.10% |  |
| B | 7270 | 5719 | 27 | 27 | 0.37% | 0.47% | 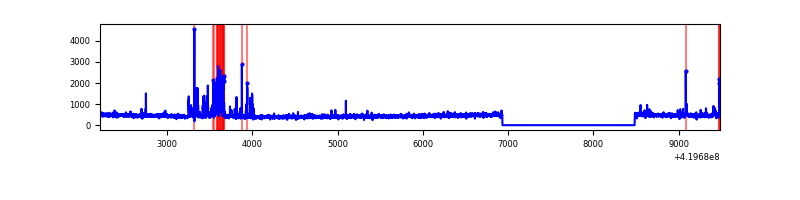 |
| C | 7270 | 5719 | 4 | 4 | 0.06% | 0.07% | 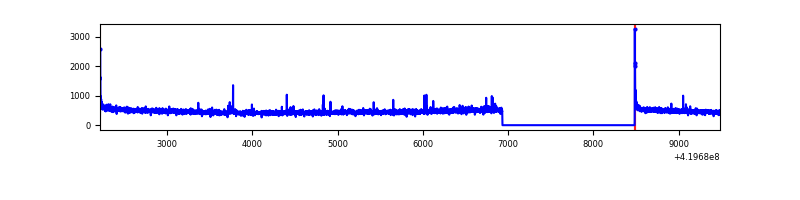 |
| D | 7270 | 5719 | 598 | 598 | 8.23% | 10.46% | 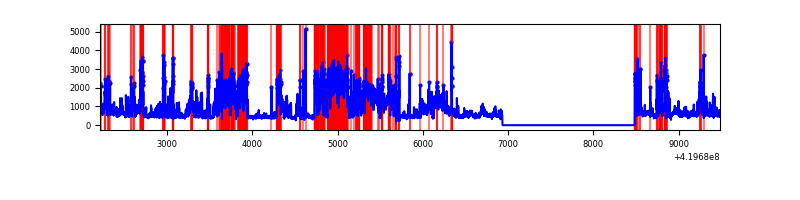 |
Top three noisy pixels from each quadrant. If the there are fewer than three noisy pixels in the level2.evt file, extra rows are filled as -1
| Pixel properties | Quadrant properties | ||||||
|---|---|---|---|---|---|---|---|
| Quadrant | DetID | PixID | Counts | Sigma | Mean | Median | Sigma |
| A | 10 | 83 | 560760 | 4306.62 | 626 | 610 | 130.1 |
| A | 13 | 248 | 137434 | 1051.95 | 626 | 610 | 130.1 |
| A | 13 | 6 | 16051 | 118.72 | 626 | 610 | 130.1 |
| B | 15 | 85 | 176411 | 1427.05 | 622 | 603 | 123.2 |
| B | 0 | 229 | 36072 | 287.9 | 622 | 603 | 123.2 |
| B | 15 | 32 | 19689 | 154.92 | 622 | 603 | 123.2 |
| C | 15 | 214 | 243076 | 1686.72 | 611 | 614 | 143.7 |
| C | 0 | 10 | 25231 | 171.25 | 611 | 614 | 143.7 |
| C | 12 | 249 | 17362 | 116.51 | 611 | 614 | 143.7 |
| D | 12 | 79 | 2318357 | 15726.28 | 596 | 579 | 147.4 |
| D | 13 | 249 | 305686 | 2070.17 | 596 | 579 | 147.4 |
| D | 2 | 249 | 222419 | 1505.2 | 596 | 579 | 147.4 |
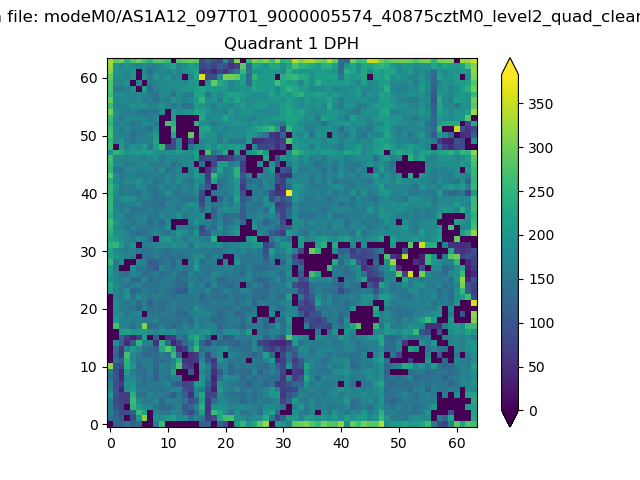
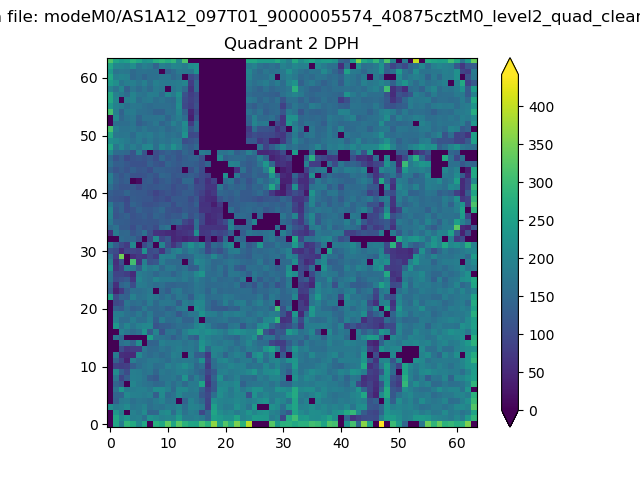
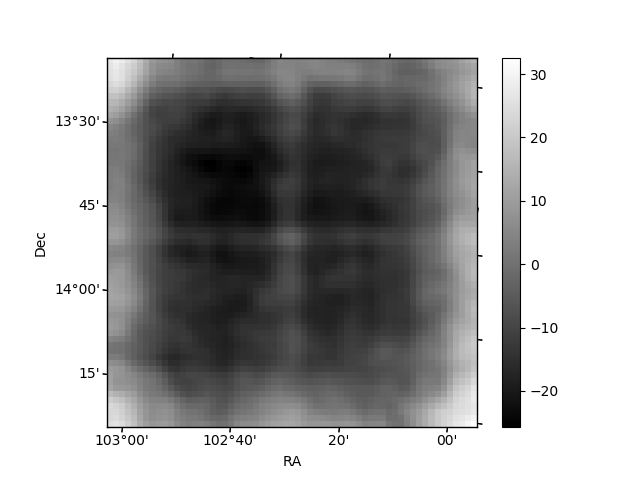
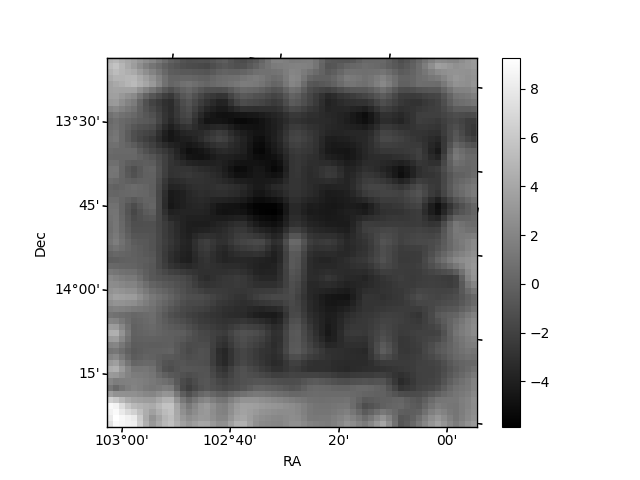
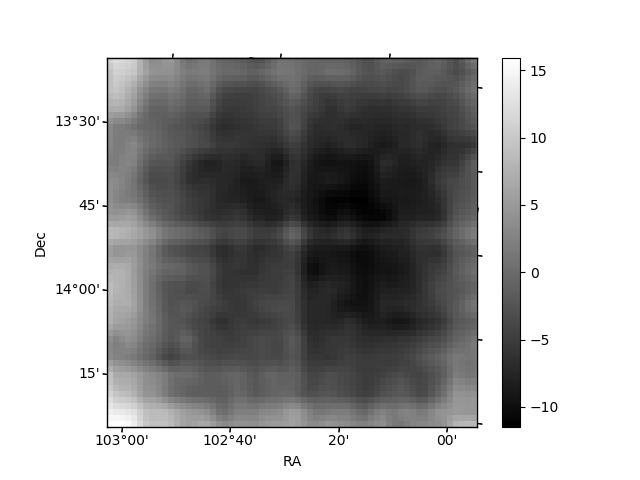
Histogram calculated using DETX and DETY for each event in the final _common_clean file
| Quadrant A | 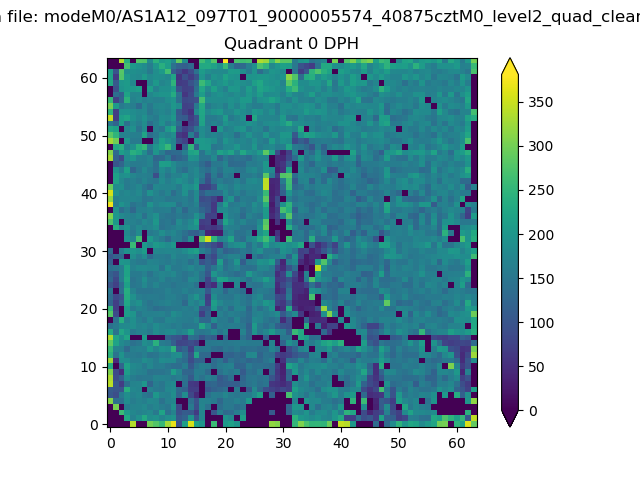 |
 |
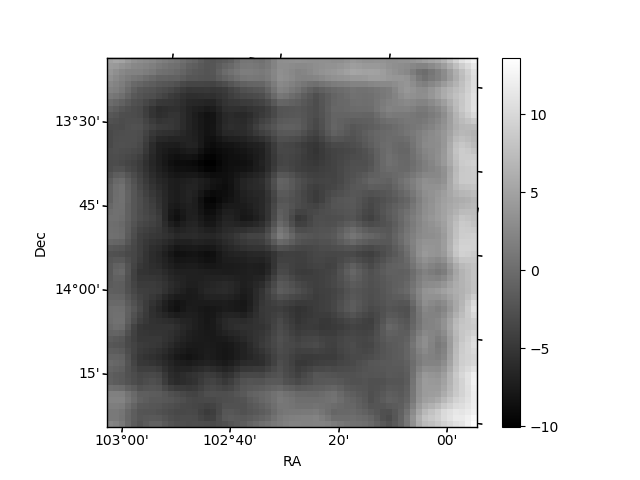
Quadrant B |
|---|---|---|---|
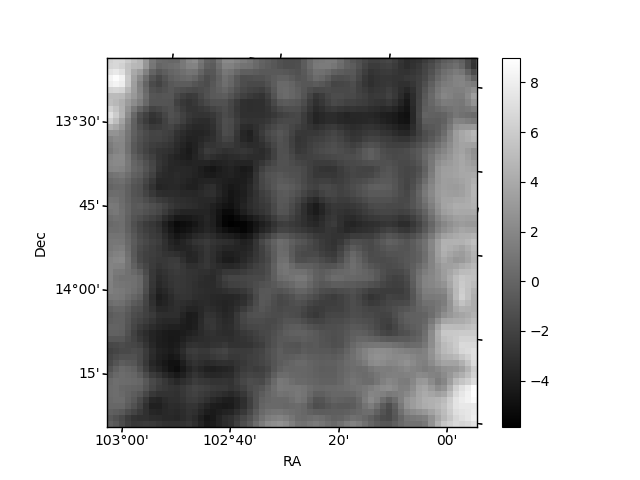
| Quadrant D | 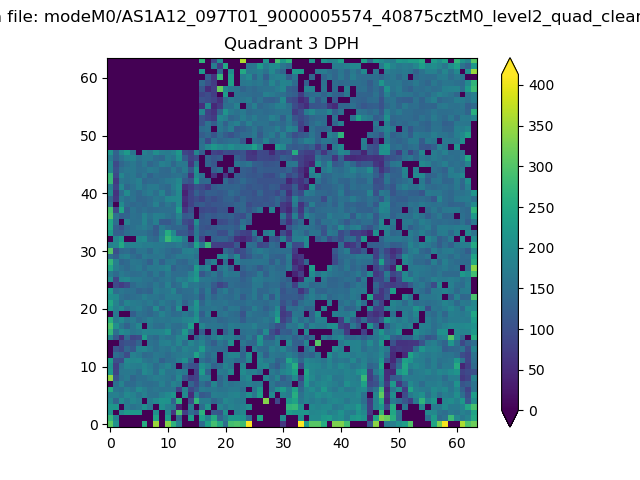 |
 |
Quadrant C |
| Plot type | Count rate plots | Images |
|---|---|---|
| Comparison with Poisson distribution Blue bars denote a histogram of data divided into 1 sec bins. Red curve is a Poisson curve with rate = median count rate of data. |
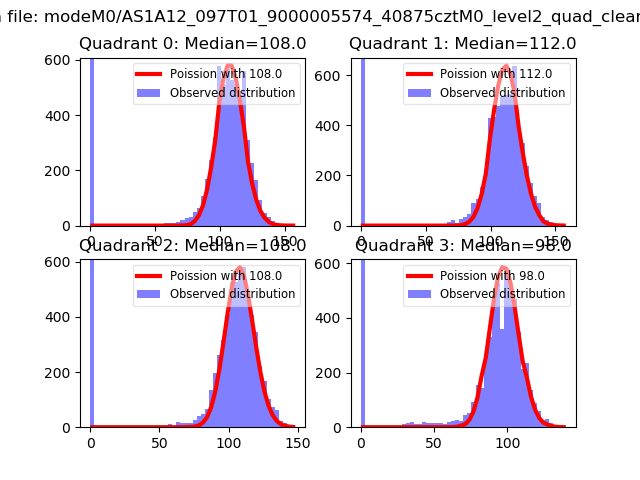 |
 |
| Quadrant-wise count rates Data is divided into 100 sec bins |
 |
|
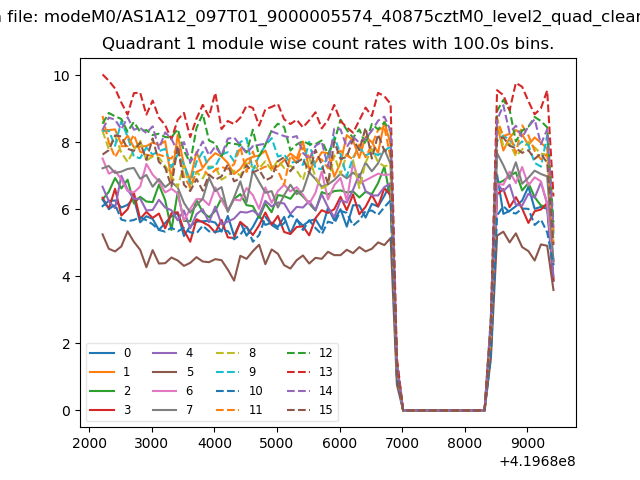
| Module-wise count rates for Quadrant A Data is divided into 100 sec bins |
 |
 |
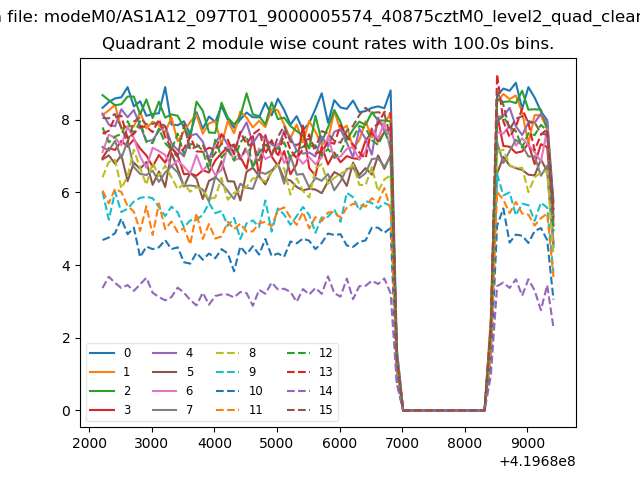
| Module-wise count rates for Quadrant B Data is divided into 100 sec bins |
 |
 |
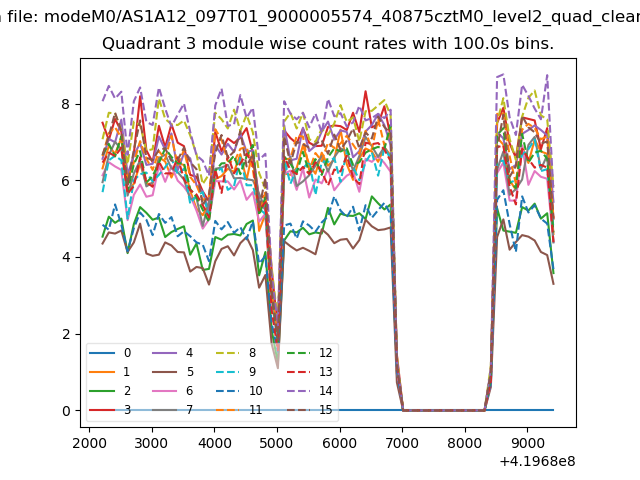
| Module-wise count rates for Quadrant C Data is divided into 100 sec bins |
 |
 |
| Module-wise count rates for Quadrant D Data is divided into 100 sec bins |
 |
 |
| Parameter | Plot |
|---|---|
| CZT HV Monitor | 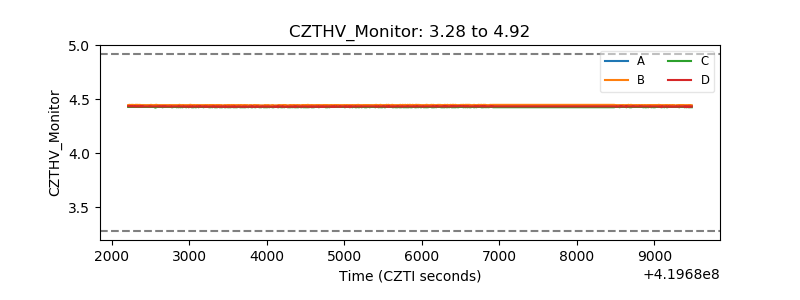 |
| D_VDD | 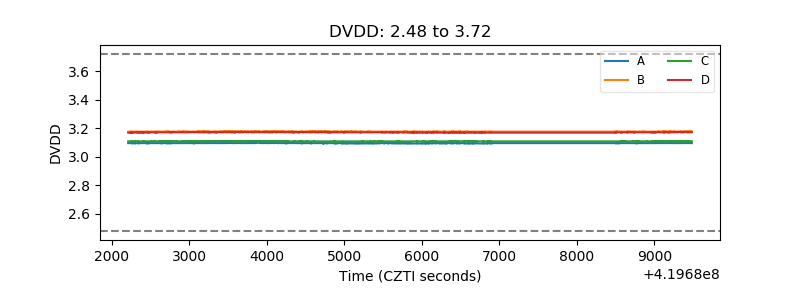 |
| Temperature 1 | 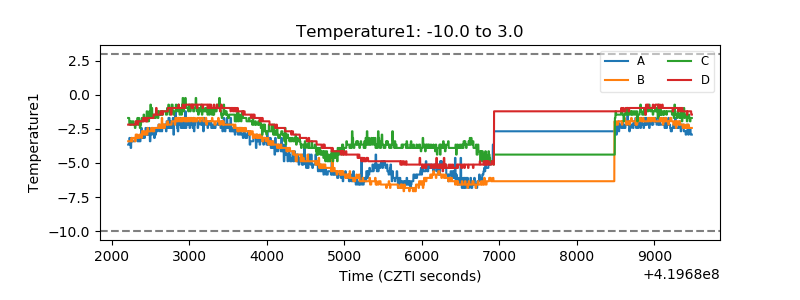 |
| Veto HV Monitor | 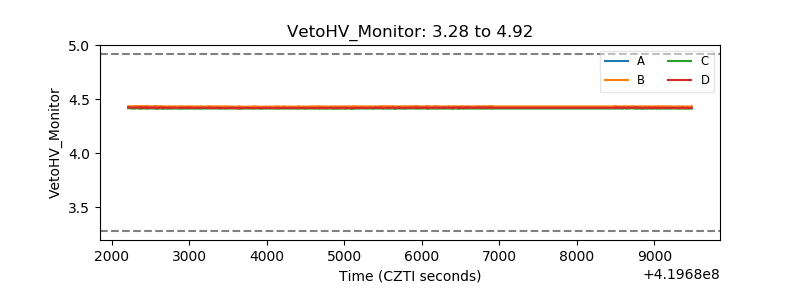 |
| Veto LLD | 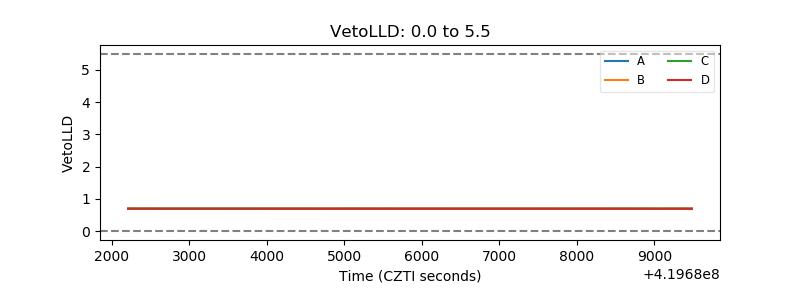 |
| Alpha Counter | 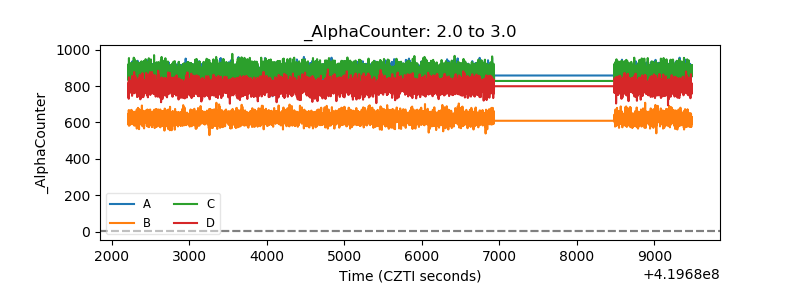 |
| _CPM_Rate | 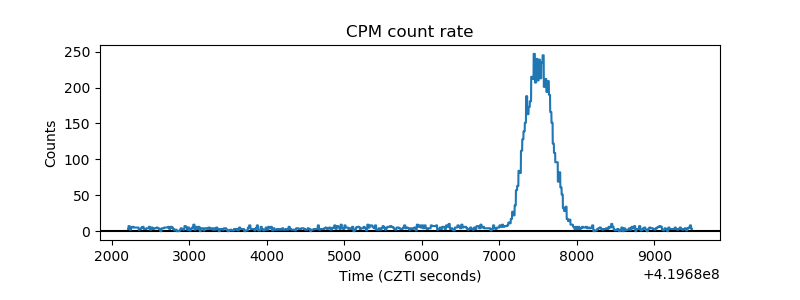 |
| CZT Counter | 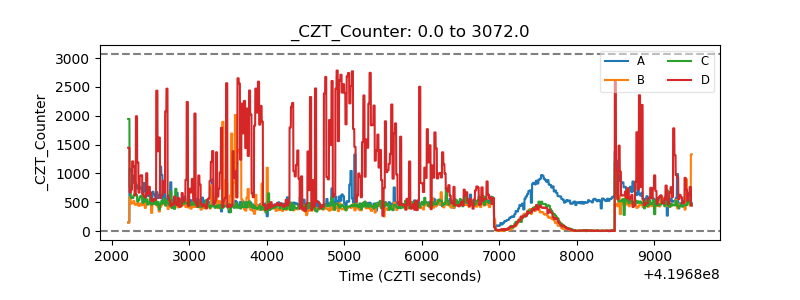 |
| +2.5 Volts monitor |  |
| +5 Volts monitor | 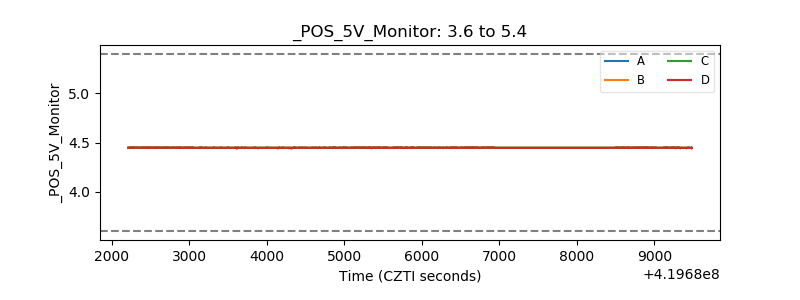 |
| _ROLL_ROT | 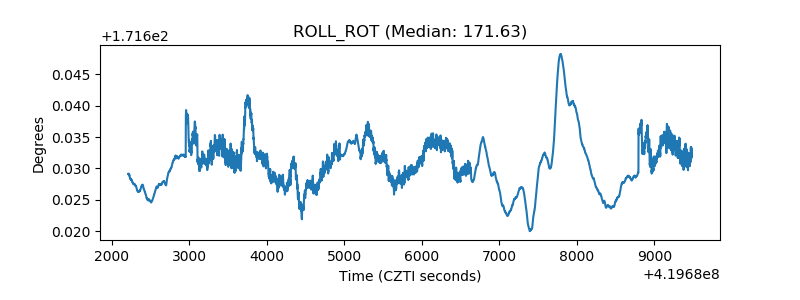 |
| _Roll_DEC | 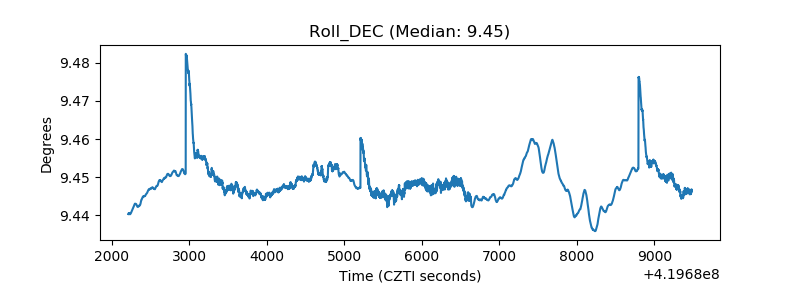 |
| _Roll_RA | 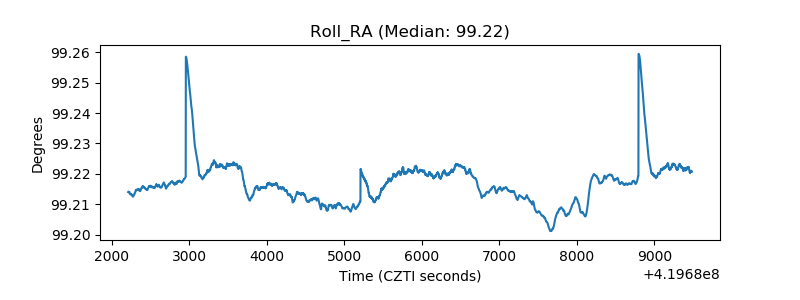 |
| Veto Counter | 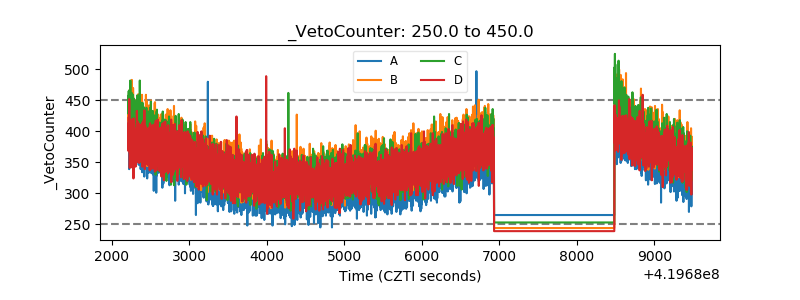 |