| Param | Original file | Final file |
|---|---|---|
| Filename | modeM0/AS1A12_097T01_9000005574_40876cztM0_level2.fits | modeM0/AS1A12_097T01_9000005574_40876cztM0_level2_quad_clean.evt |
| Size (bytes) | 331,721,280 | 89,328,960 |
| Size | 316.4 MB | 85.2 MB |
| Events in quadrant A | 2,955,005 | 592,742 |
| Events in quadrant B | 2,524,390 | 613,245 |
| Events in quadrant C | 2,540,990 | 587,067 |
| Events in quadrant D | 3,834,379 | 530,673 |
| Mode M9 | |||
|---|---|---|---|
| Quadrant | BADHDUFLAG | Total packets | Discarded packets |
| A | 0 | 17 | 0 |
| B | 0 | 17 | 0 |
| C | 0 | 17 | 0 |
| D | 0 | 17 | 0 |
| Mode SS | |||
|---|---|---|---|
| Quadrant | BADHDUFLAG | Total packets | Discarded packets |
| A | 0 | 110 | 0 |
| B | 0 | 110 | 0 |
| C | 0 | 110 | 0 |
| D | 0 | 110 | 0 |
| Mode M0 | |||
|---|---|---|---|
| Quadrant | BADHDUFLAG | Total packets | Discarded packets |
| A | 0 | 12163 | 2 |
| B | 0 | 11394 | 1 |
| C | 0 | 11047 | 1 |
| D | 0 | 15201 | 1 |
| Quadrant | Total seconds | Saturated seconds | Saturation percentage |
|---|---|---|---|
| A | 5448 | 10 | 0.183554% |
| B | 5448 | 39 | 0.715859% |
| C | 5448 | 5 | 0.091777% |
| D | 5448 | 143 | 2.624816% |
Noise dominated data is calculated using 1-second bins in cleaned event files. If a bin has >2000 counts, and if more than 50% of those come from <1% of pixels, then it is considered to be noise-dominated and hence unusable.
| Quadrant | # 1 sec bins | Bins with >0 counts | Bins with >2000 counts | High rate bins dominated by noise | Noise dominated (total time) | Noise dominated (detector-on time) | Marked lightcurve |
|---|---|---|---|---|---|---|---|
| A | 7150 | 5449 | 2 | 2 | 0.03% | 0.04% | 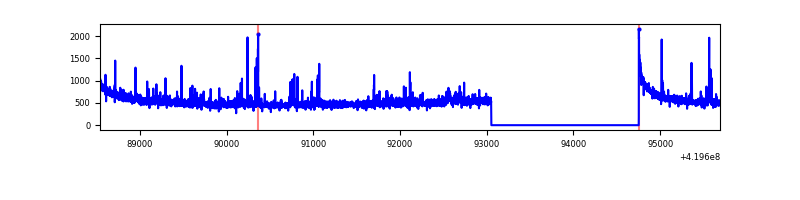 |
| B | 7150 | 5449 | 24 | 24 | 0.34% | 0.44% | 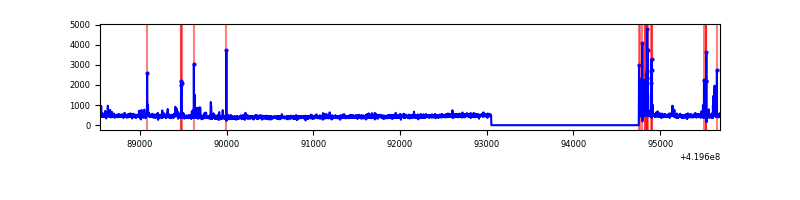 |
| C | 7150 | 5449 | 2 | 2 | 0.03% | 0.04% | 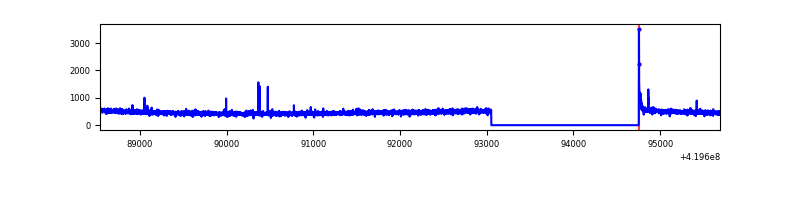 |
| D | 7150 | 5449 | 121 | 121 | 1.69% | 2.22% | 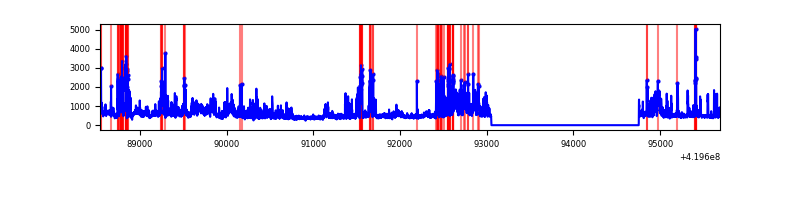 |
Top three noisy pixels from each quadrant. If the there are fewer than three noisy pixels in the level2.evt file, extra rows are filled as -1
| Pixel properties | Quadrant properties | ||||||
|---|---|---|---|---|---|---|---|
| Quadrant | DetID | PixID | Counts | Sigma | Mean | Median | Sigma |
| A | 10 | 83 | 515069 | 4172.54 | 591 | 579 | 123.3 |
| A | 13 | 248 | 88218 | 710.76 | 591 | 579 | 123.3 |
| A | 2 | 79 | 40939 | 327.32 | 591 | 579 | 123.3 |
| B | 15 | 85 | 97736 | 845.59 | 591 | 575 | 114.9 |
| B | 5 | 255 | 63355 | 546.37 | 591 | 575 | 114.9 |
| B | 0 | 229 | 19059 | 160.87 | 591 | 575 | 114.9 |
| C | 15 | 214 | 229516 | 1658.66 | 581 | 583 | 138.0 |
| C | 0 | 10 | 23917 | 169.06 | 581 | 583 | 138.0 |
| C | 12 | 249 | 17235 | 120.65 | 581 | 583 | 138.0 |
| D | 12 | 79 | 628305 | 4397.07 | 575 | 557 | 142.8 |
| D | 1 | 47 | 285539 | 1996.16 | 575 | 557 | 142.8 |
| D | 2 | 249 | 275491 | 1925.78 | 575 | 557 | 142.8 |
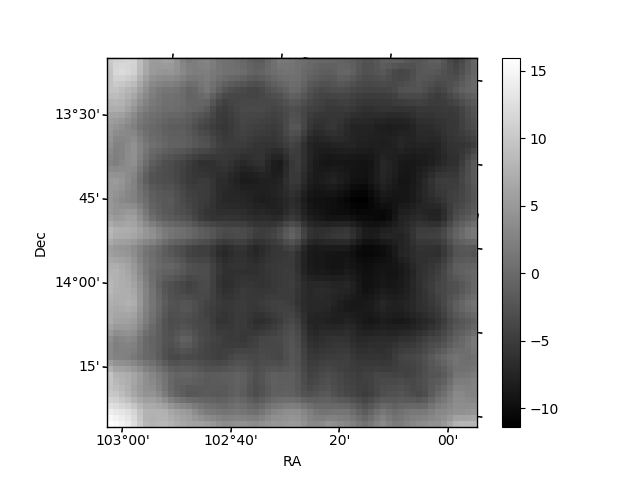
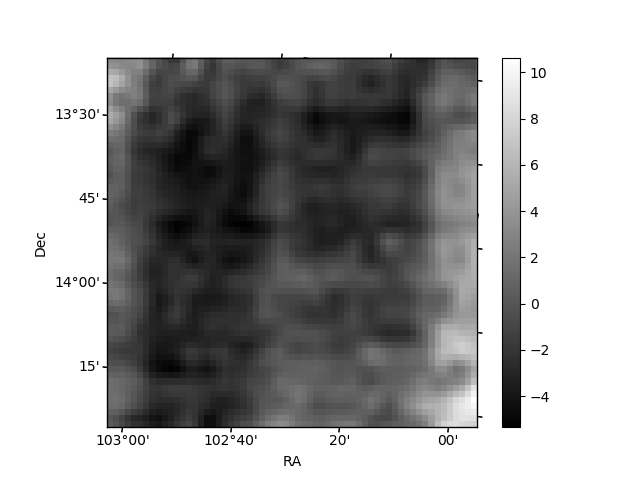
Histogram calculated using DETX and DETY for each event in the final _common_clean file
| Quadrant A | 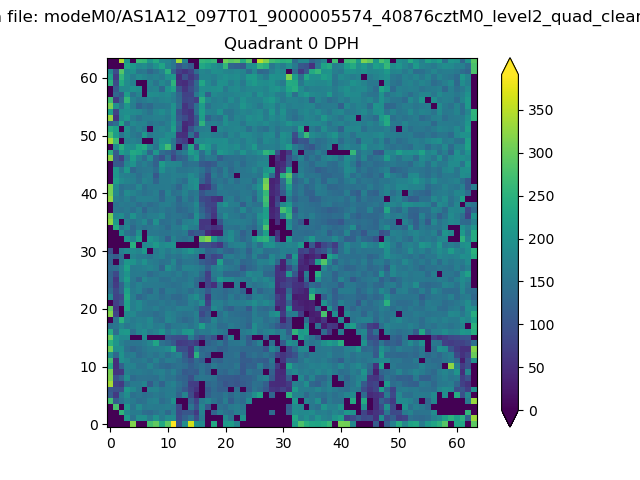 |
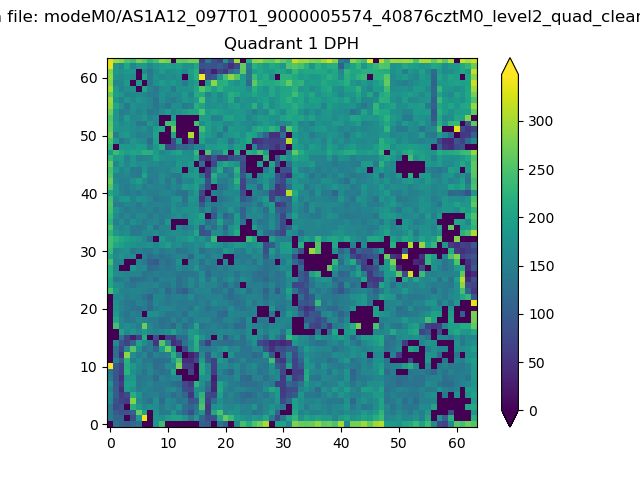 |
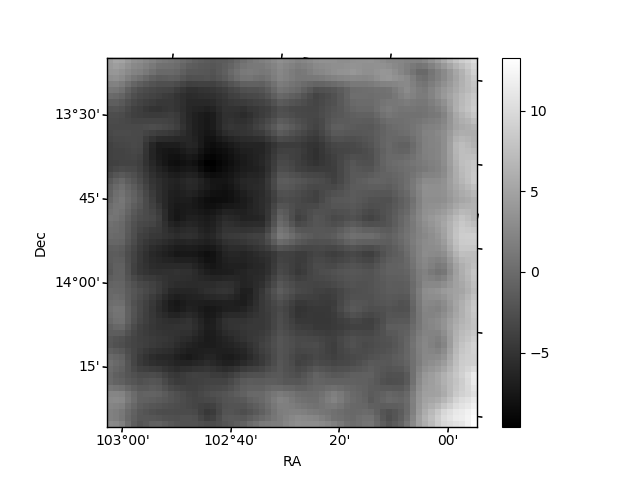
Quadrant B |
|---|---|---|---|
| Quadrant D | 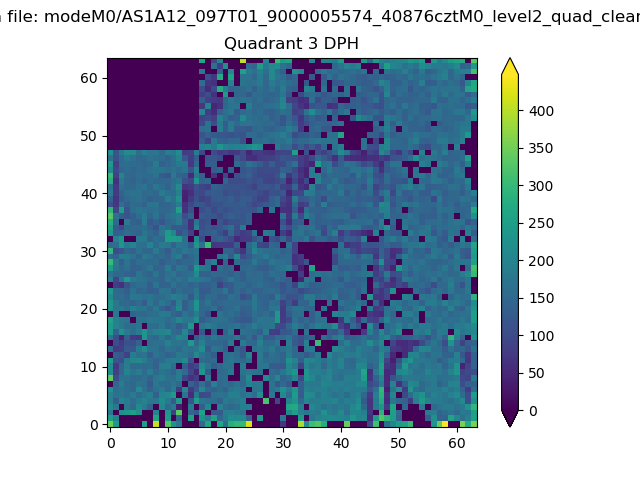 |
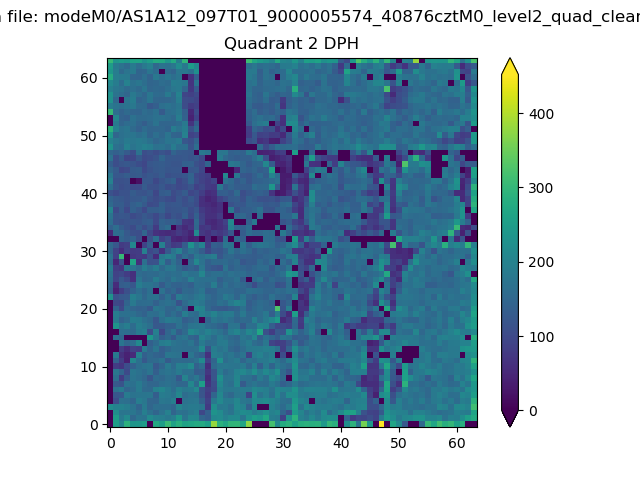 |
Quadrant C |
| Plot type | Count rate plots | Images |
|---|---|---|
| Comparison with Poisson distribution Blue bars denote a histogram of data divided into 1 sec bins. Red curve is a Poisson curve with rate = median count rate of data. |
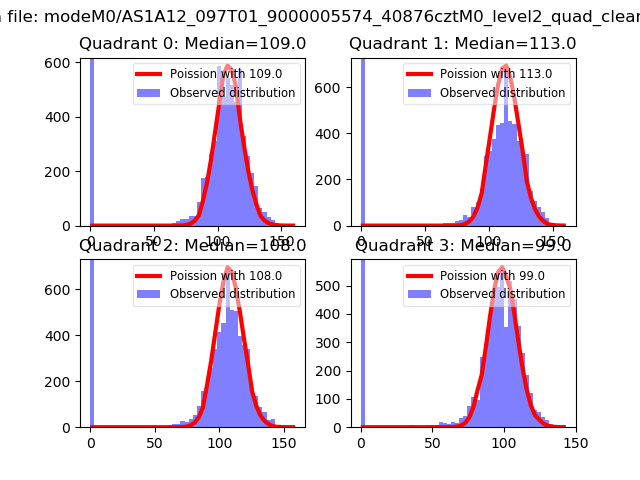 |
 |
| Quadrant-wise count rates Data is divided into 100 sec bins |
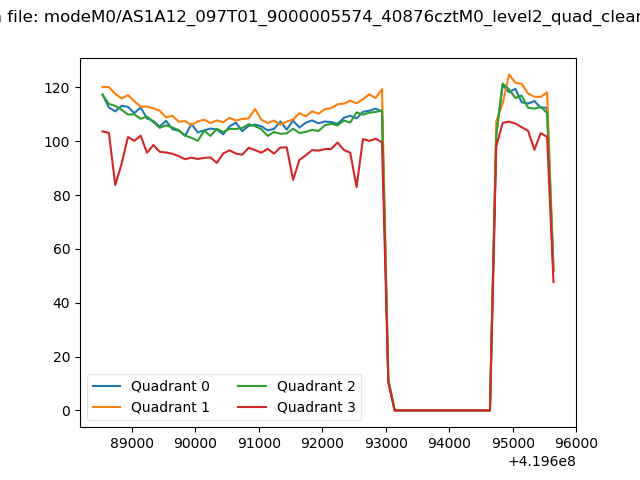 |
|
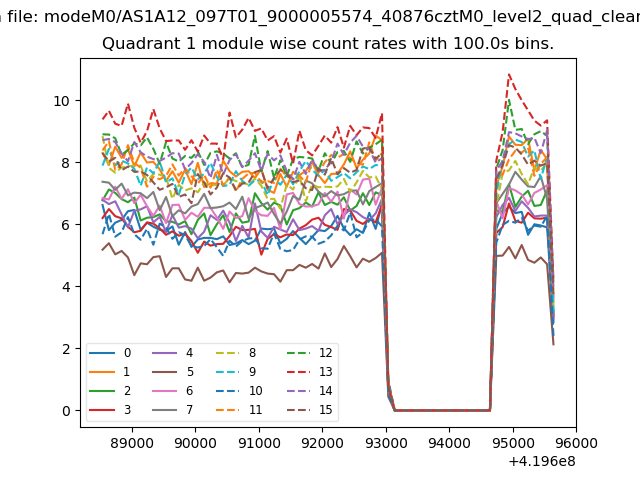
| Module-wise count rates for Quadrant A Data is divided into 100 sec bins |
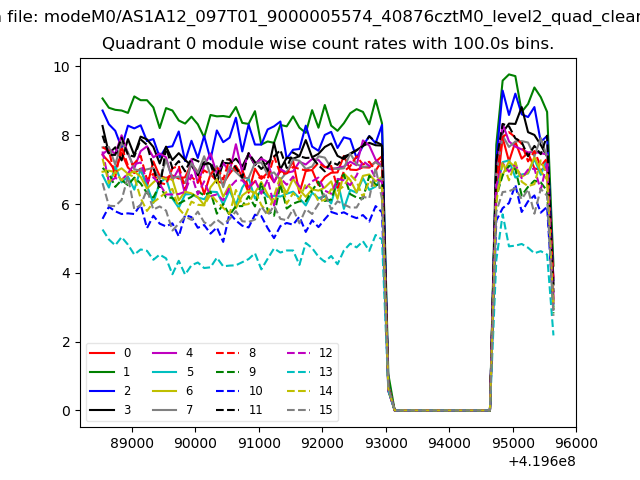 |
 |
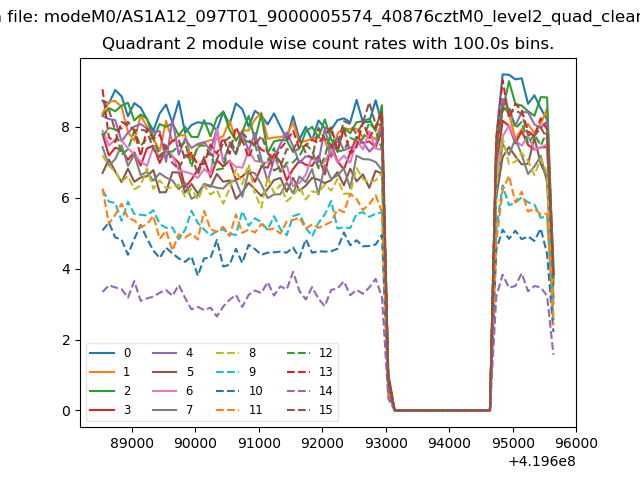
| Module-wise count rates for Quadrant B Data is divided into 100 sec bins |
 |
 |
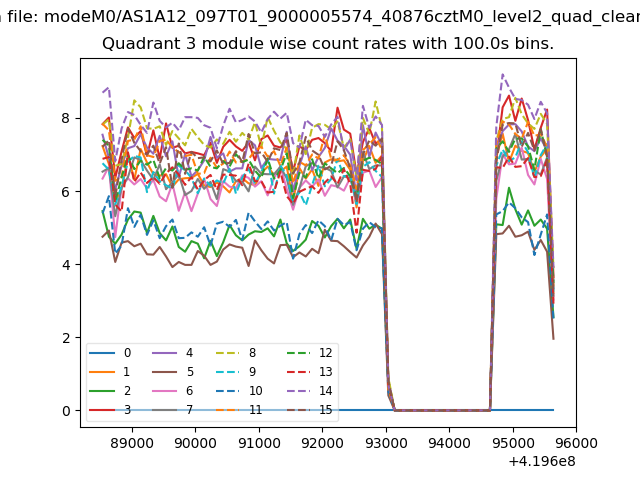
| Module-wise count rates for Quadrant C Data is divided into 100 sec bins |
 |
 |
| Module-wise count rates for Quadrant D Data is divided into 100 sec bins |
 |
 |
| Parameter | Plot |
|---|---|
| CZT HV Monitor | 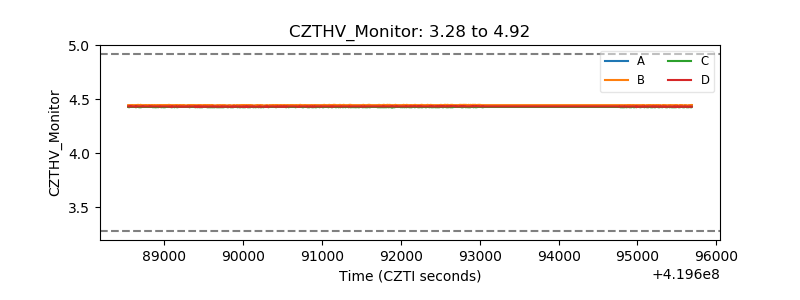 |
| D_VDD | 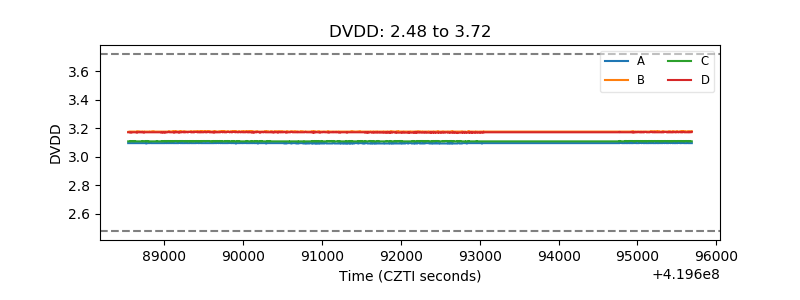 |
| Temperature 1 | 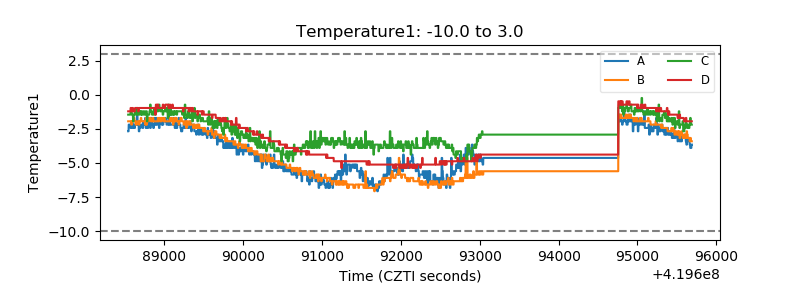 |
| Veto HV Monitor | 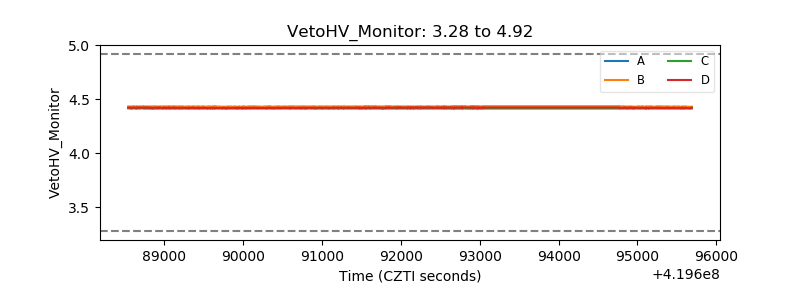 |
| Veto LLD | 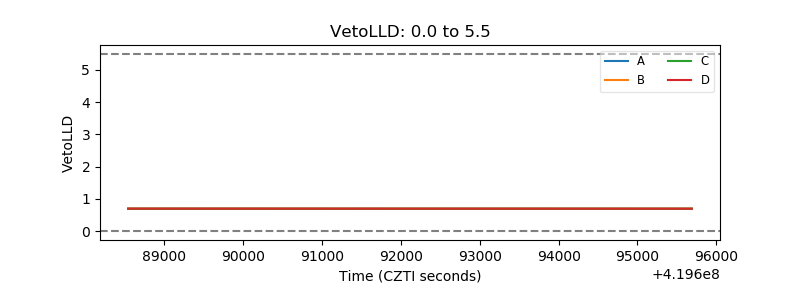 |
| Alpha Counter |  |
| _CPM_Rate |  |
| CZT Counter | 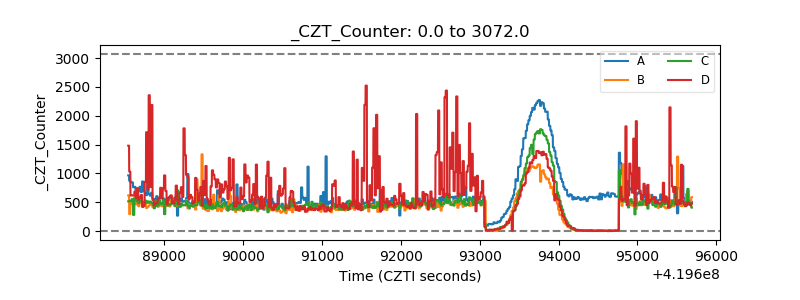 |
| +2.5 Volts monitor | 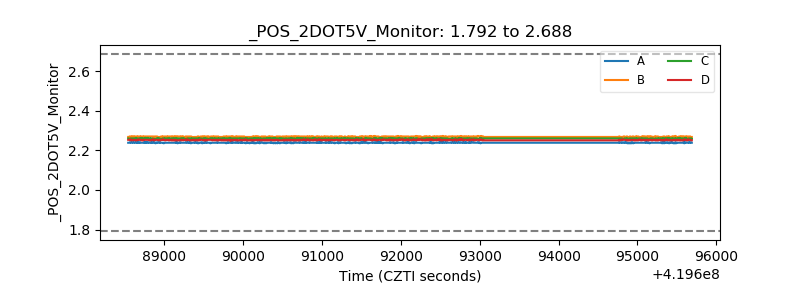 |
| +5 Volts monitor |  |
| _ROLL_ROT | 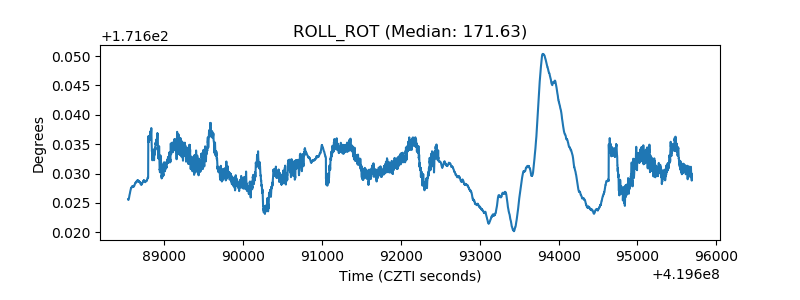 |
| _Roll_DEC | 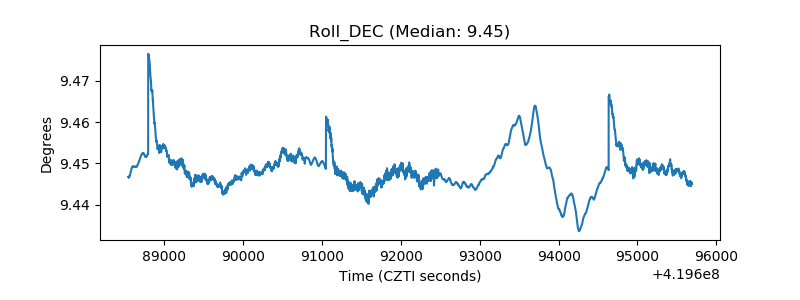 |
| _Roll_RA |  |
| Veto Counter | 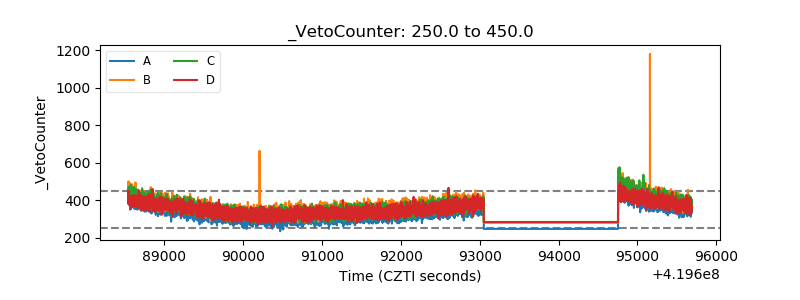 |