| Param | Original file | Final file |
|---|---|---|
| Filename | modeM0/AS1A12_097T01_9000005574_40878cztM0_level2.fits | modeM0/AS1A12_097T01_9000005574_40878cztM0_level2_quad_clean.evt |
| Size (bytes) | 361,874,880 | 86,264,640 |
| Size | 345.1 MB | 82.3 MB |
| Events in quadrant A | 2,870,059 | 587,595 |
| Events in quadrant B | 2,846,040 | 597,673 |
| Events in quadrant C | 2,520,570 | 577,676 |
| Events in quadrant D | 4,751,135 | 482,900 |
| Mode M9 | |||
|---|---|---|---|
| Quadrant | BADHDUFLAG | Total packets | Discarded packets |
| A | 0 | 25 | 0 |
| B | 0 | 25 | 0 |
| C | 0 | 25 | 0 |
| D | 0 | 26 | 0 |
| Mode SS | |||
|---|---|---|---|
| Quadrant | BADHDUFLAG | Total packets | Discarded packets |
| A | 0 | 104 | 0 |
| B | 0 | 104 | 0 |
| C | 0 | 104 | 0 |
| D | 0 | 104 | 0 |
| Mode M0 | |||
|---|---|---|---|
| Quadrant | BADHDUFLAG | Total packets | Discarded packets |
| A | 0 | 11791 | 3 |
| B | 0 | 12072 | 2 |
| C | 0 | 10787 | 2 |
| D | 0 | 17672 | 2 |
| Quadrant | Total seconds | Saturated seconds | Saturation percentage |
|---|---|---|---|
| A | 5234 | 17 | 0.324799% |
| B | 5234 | 129 | 2.464654% |
| C | 5234 | 25 | 0.477646% |
| D | 5234 | 560 | 10.699274% |
Noise dominated data is calculated using 1-second bins in cleaned event files. If a bin has >2000 counts, and if more than 50% of those come from <1% of pixels, then it is considered to be noise-dominated and hence unusable.
| Quadrant | # 1 sec bins | Bins with >0 counts | Bins with >2000 counts | High rate bins dominated by noise | Noise dominated (total time) | Noise dominated (detector-on time) | Marked lightcurve |
|---|---|---|---|---|---|---|---|
| A | 7057 | 5235 | 4 | 4 | 0.06% | 0.08% | 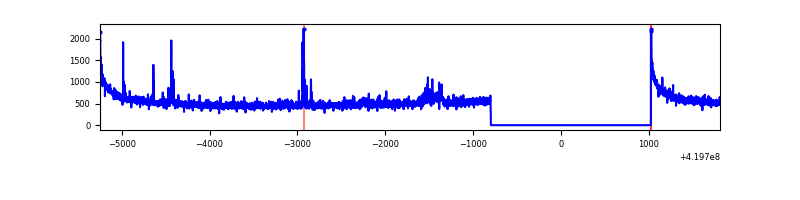 |
| B | 7057 | 5235 | 84 | 84 | 1.19% | 1.60% | 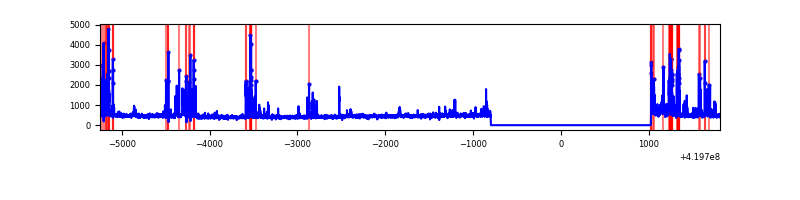 |
| C | 7057 | 5235 | 18 | 18 | 0.26% | 0.34% | 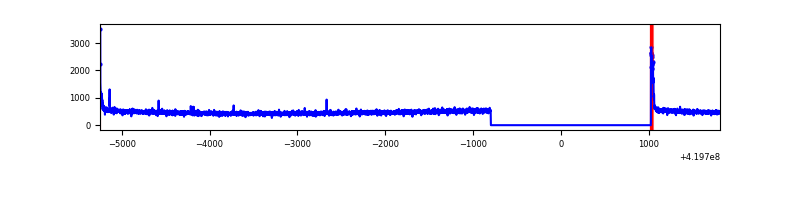 |
| D | 7057 | 5235 | 512 | 512 | 7.26% | 9.78% | 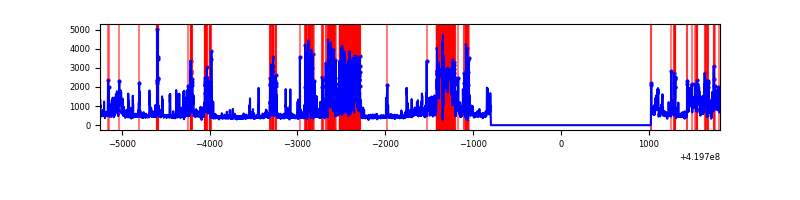 |
Top three noisy pixels from each quadrant. If the there are fewer than three noisy pixels in the level2.evt file, extra rows are filled as -1
| Pixel properties | Quadrant properties | ||||||
|---|---|---|---|---|---|---|---|
| Quadrant | DetID | PixID | Counts | Sigma | Mean | Median | Sigma |
| A | 10 | 83 | 533267 | 4457.5 | 575 | 563 | 119.5 |
| A | 12 | 189 | 49085 | 406.02 | 575 | 563 | 119.5 |
| A | 13 | 248 | 47026 | 388.79 | 575 | 563 | 119.5 |
| B | 5 | 255 | 270908 | 2456.58 | 572 | 556 | 110.1 |
| B | 4 | 171 | 215931 | 1957.03 | 572 | 556 | 110.1 |
| B | 15 | 85 | 70377 | 634.44 | 572 | 556 | 110.1 |
| C | 15 | 214 | 223647 | 1686.94 | 564 | 567 | 132.2 |
| C | 0 | 10 | 79995 | 600.64 | 564 | 567 | 132.2 |
| C | 5 | 10 | 9500 | 67.55 | 564 | 567 | 132.2 |
| D | 12 | 79 | 984177 | 7501.0 | 530 | 515 | 131.1 |
| D | 2 | 249 | 802880 | 6118.51 | 530 | 515 | 131.1 |
| D | 1 | 47 | 573623 | 4370.29 | 530 | 515 | 131.1 |
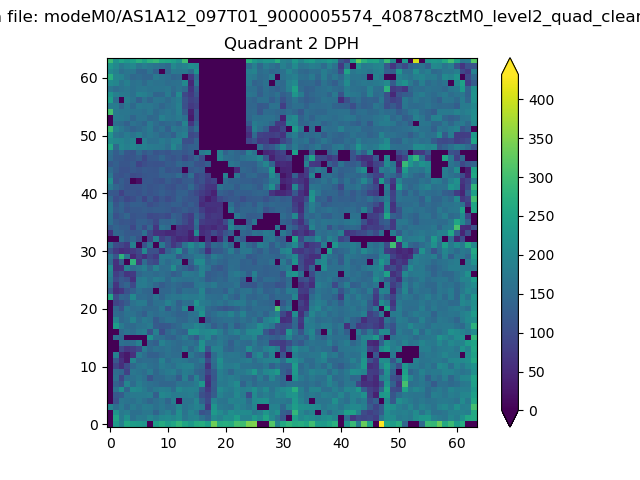
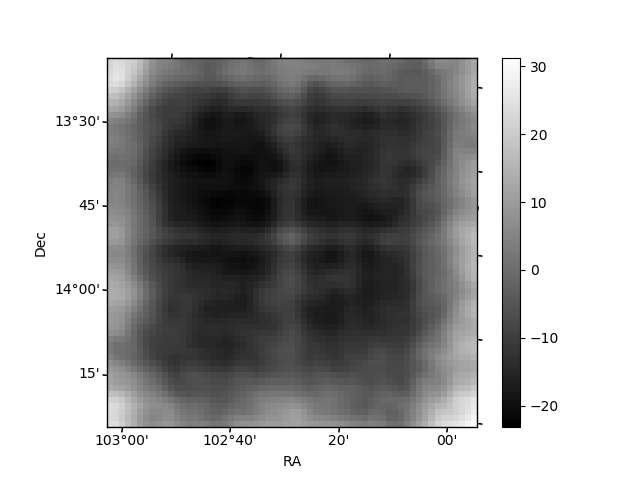
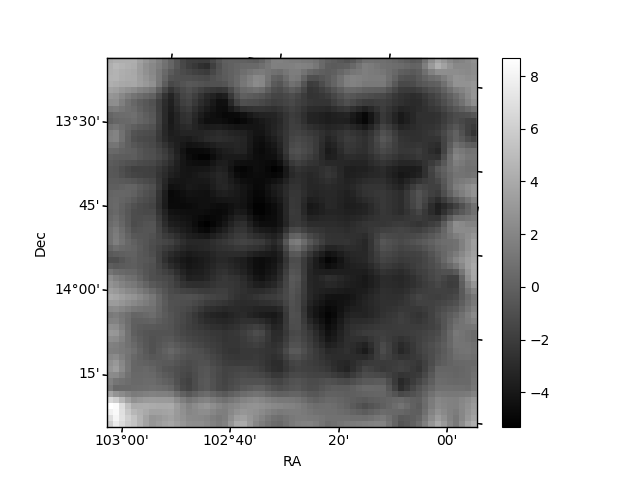
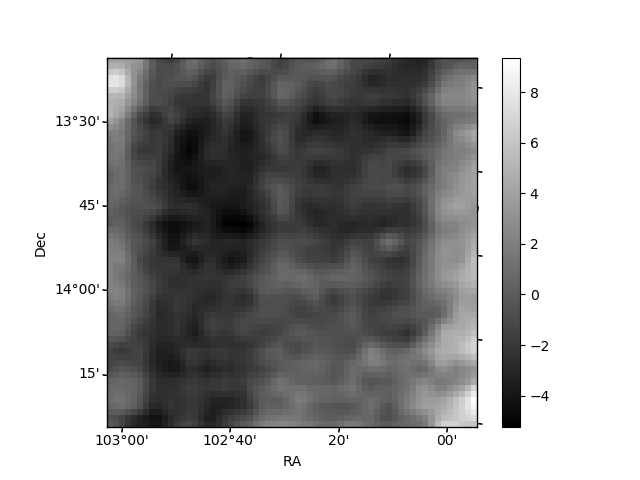
Histogram calculated using DETX and DETY for each event in the final _common_clean file
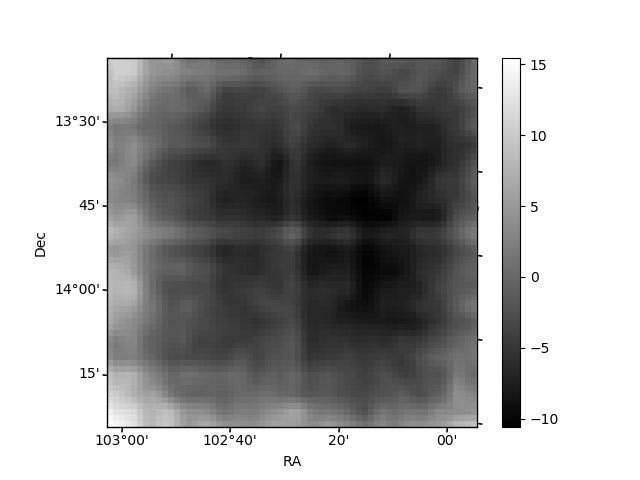
| Quadrant A | 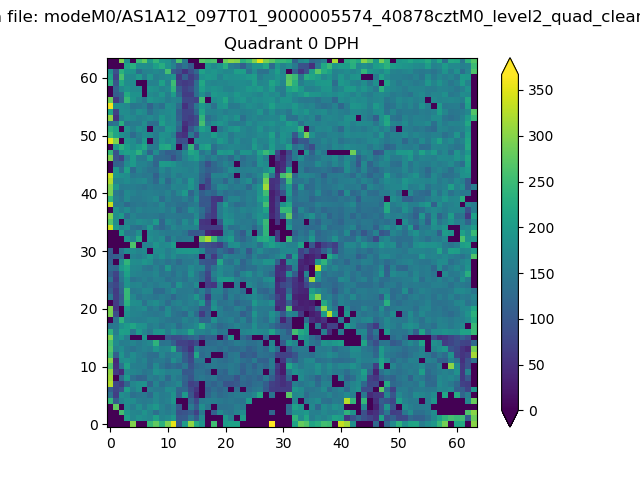 |
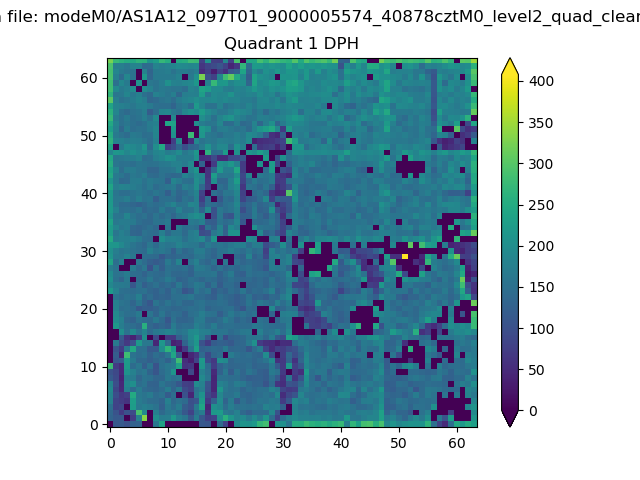 |
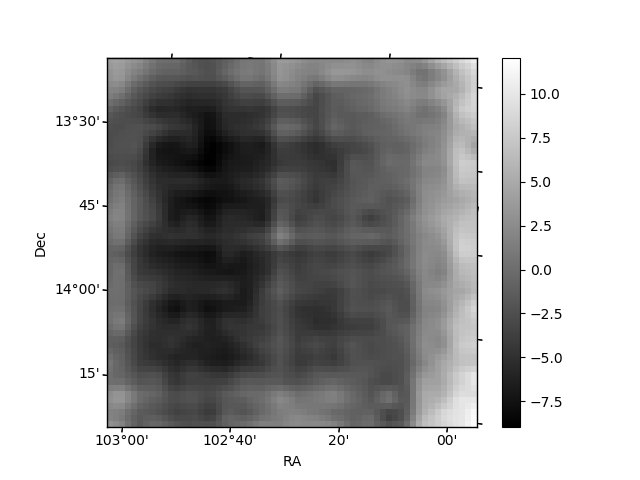
Quadrant B |
|---|---|---|---|
| Quadrant D | 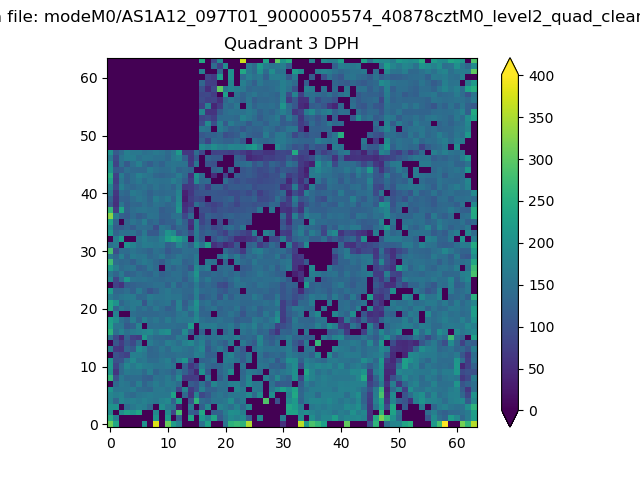 |
 |
Quadrant C |
| Plot type | Count rate plots | Images |
|---|---|---|
| Comparison with Poisson distribution Blue bars denote a histogram of data divided into 1 sec bins. Red curve is a Poisson curve with rate = median count rate of data. |
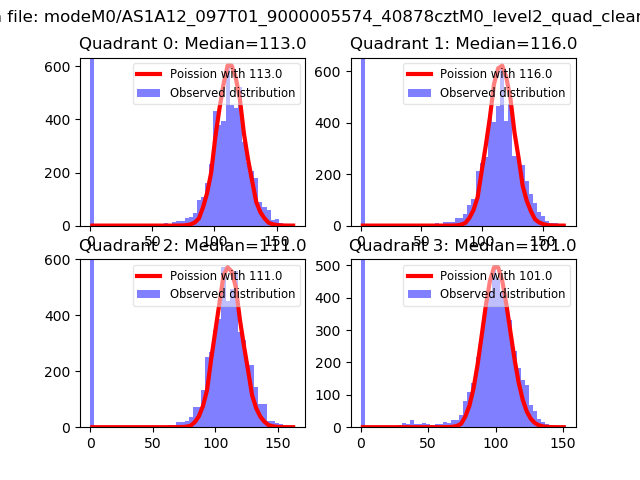 |
 |
| Quadrant-wise count rates Data is divided into 100 sec bins |
 |
|
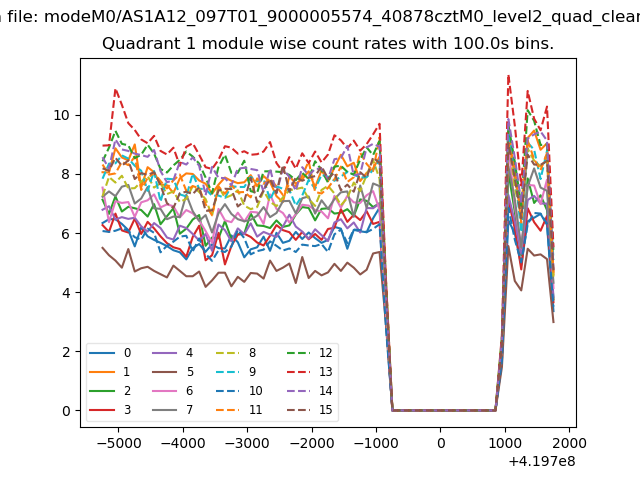
| Module-wise count rates for Quadrant A Data is divided into 100 sec bins |
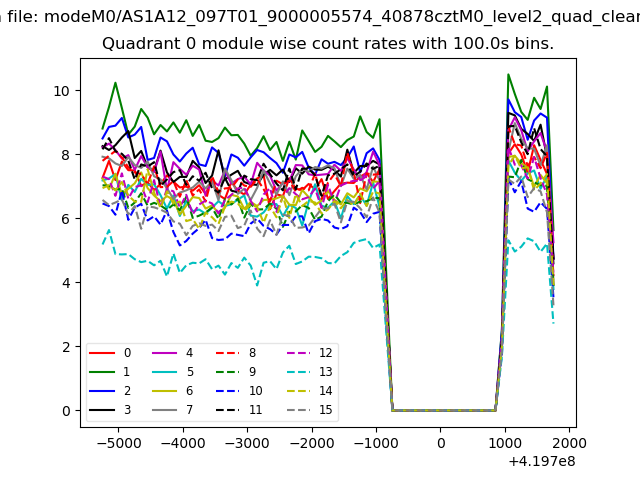 |
 |
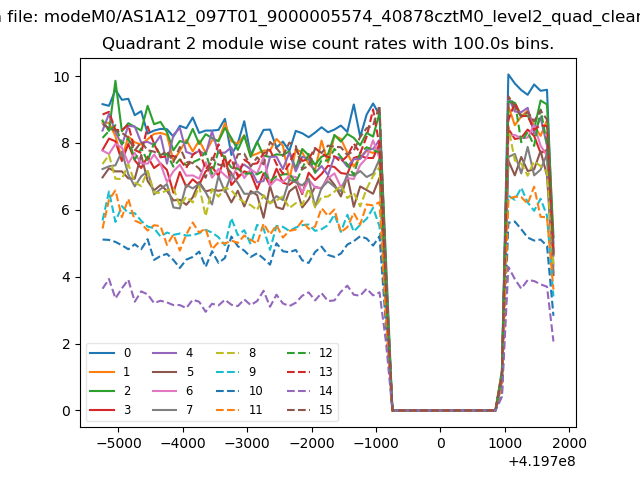
| Module-wise count rates for Quadrant B Data is divided into 100 sec bins |
 |
 |
| Module-wise count rates for Quadrant C Data is divided into 100 sec bins |
 |
 |
| Module-wise count rates for Quadrant D Data is divided into 100 sec bins |
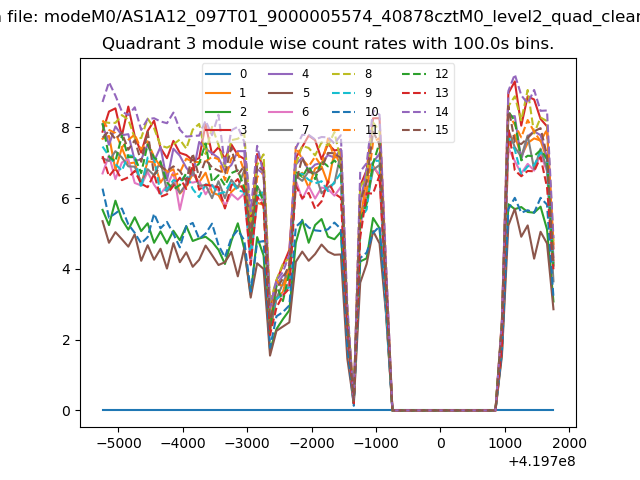 |
 |
| Parameter | Plot |
|---|---|
| CZT HV Monitor | 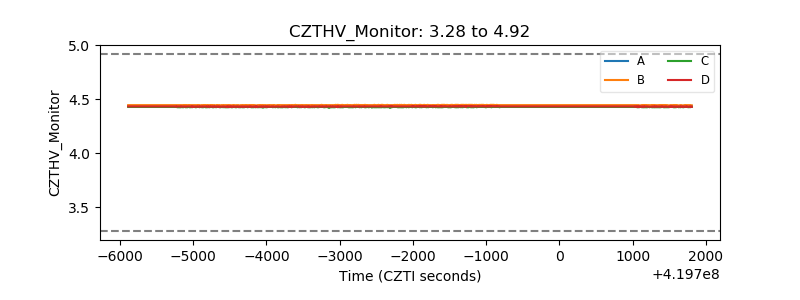 |
| D_VDD | 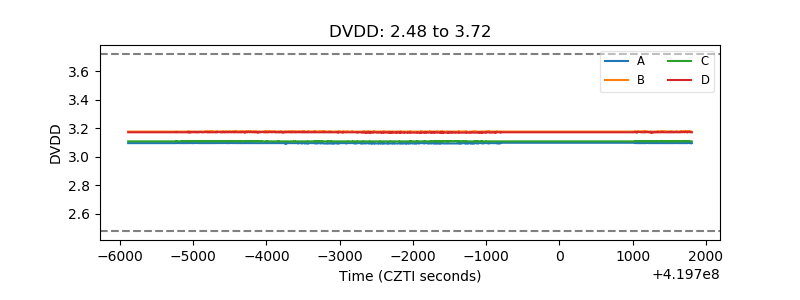 |
| Temperature 1 | 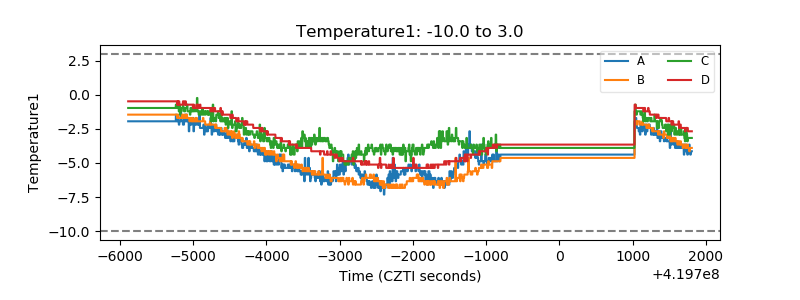 |
| Veto HV Monitor | 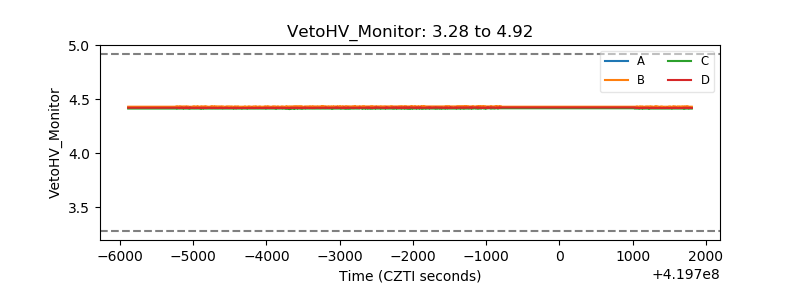 |
| Veto LLD | 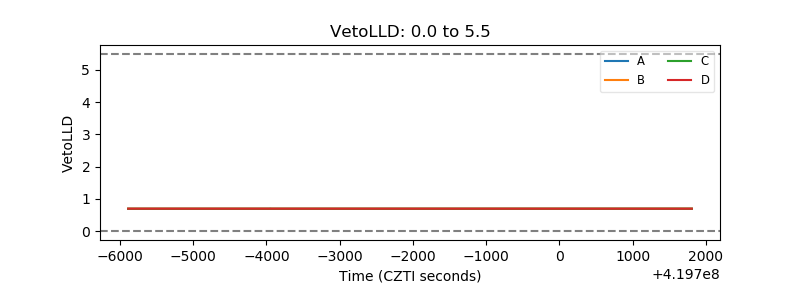 |
| Alpha Counter |  |
| _CPM_Rate |  |
| CZT Counter | 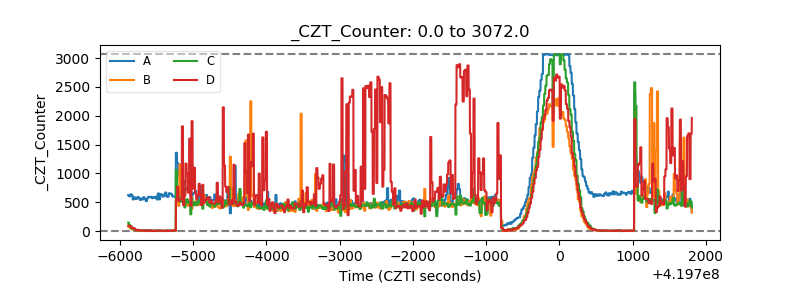 |
| +2.5 Volts monitor | 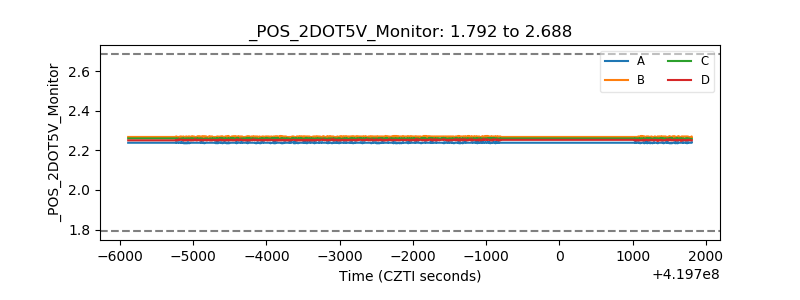 |
| +5 Volts monitor |  |
| _ROLL_ROT | 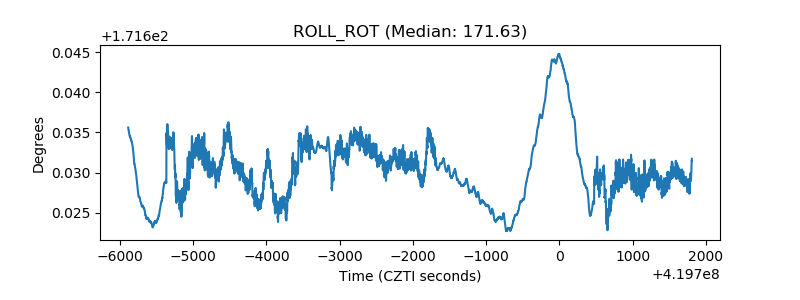 |
| _Roll_DEC |  |
| _Roll_RA | 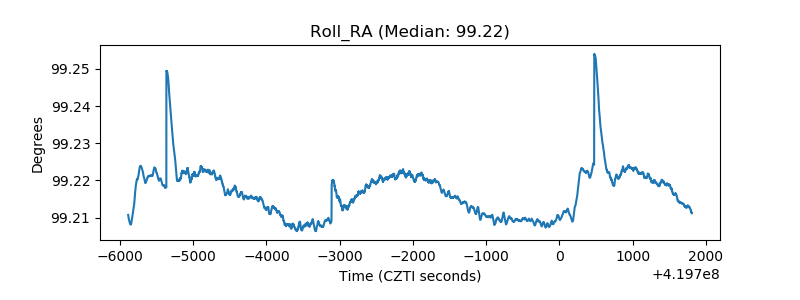 |
| Veto Counter | 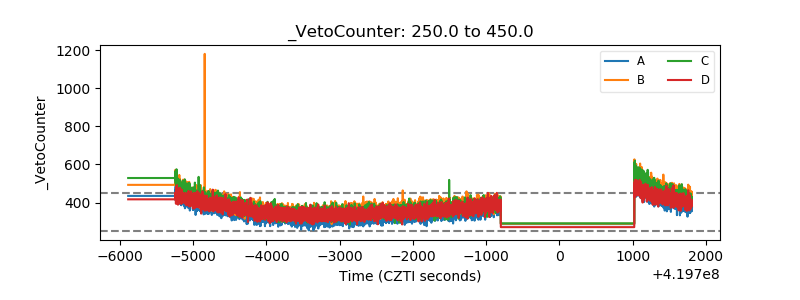 |