| Param | Original file | Final file |
|---|---|---|
| Filename | modeM0/AS1A12_097T01_9000005574_40879cztM0_level2.fits | modeM0/AS1A12_097T01_9000005574_40879cztM0_level2_quad_clean.evt |
| Size (bytes) | 354,121,920 | 89,121,600 |
| Size | 337.7 MB | 85.0 MB |
| Events in quadrant A | 2,840,418 | 599,060 |
| Events in quadrant B | 3,098,302 | 618,957 |
| Events in quadrant C | 2,545,810 | 590,826 |
| Events in quadrant D | 4,223,876 | 529,595 |
| Mode M9 | |||
|---|---|---|---|
| Quadrant | BADHDUFLAG | Total packets | Discarded packets |
| A | 0 | 23 | 0 |
| B | 0 | 23 | 0 |
| C | 0 | 23 | 0 |
| D | 0 | 24 | 0 |
| Mode SS | |||
|---|---|---|---|
| Quadrant | BADHDUFLAG | Total packets | Discarded packets |
| A | 0 | 104 | 0 |
| B | 0 | 104 | 0 |
| C | 0 | 104 | 0 |
| D | 0 | 104 | 0 |
| Mode M0 | |||
|---|---|---|---|
| Quadrant | BADHDUFLAG | Total packets | Discarded packets |
| A | 0 | 11525 | 3 |
| B | 0 | 12636 | 2 |
| C | 0 | 10674 | 2 |
| D | 0 | 16031 | 2 |
| Quadrant | Total seconds | Saturated seconds | Saturation percentage |
|---|---|---|---|
| A | 5144 | 13 | 0.252722% |
| B | 5144 | 124 | 2.410575% |
| C | 5144 | 36 | 0.699844% |
| D | 5144 | 158 | 3.071540% |
Noise dominated data is calculated using 1-second bins in cleaned event files. If a bin has >2000 counts, and if more than 50% of those come from <1% of pixels, then it is considered to be noise-dominated and hence unusable.
| Quadrant | # 1 sec bins | Bins with >0 counts | Bins with >2000 counts | High rate bins dominated by noise | Noise dominated (total time) | Noise dominated (detector-on time) | Marked lightcurve |
|---|---|---|---|---|---|---|---|
| A | 7086 | 5145 | 6 | 6 | 0.08% | 0.12% | 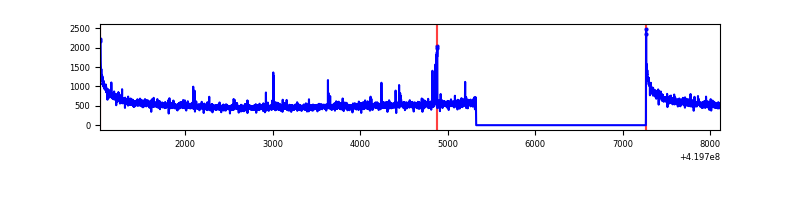 |
| B | 7086 | 5145 | 85 | 85 | 1.20% | 1.65% | 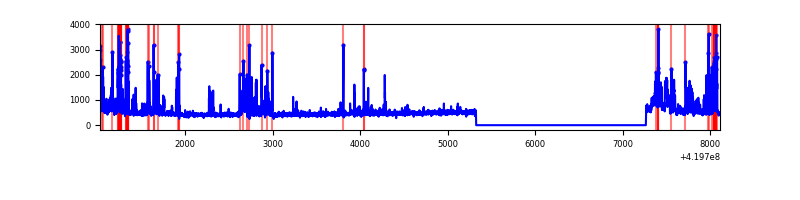 |
| C | 7086 | 5145 | 32 | 32 | 0.45% | 0.62% |  |
| D | 7086 | 5145 | 199 | 199 | 2.81% | 3.87% | 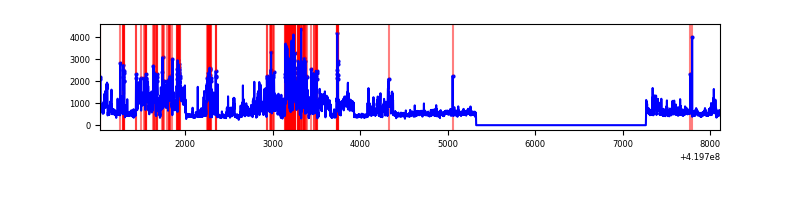 |
Top three noisy pixels from each quadrant. If the there are fewer than three noisy pixels in the level2.evt file, extra rows are filled as -1
| Pixel properties | Quadrant properties | ||||||
|---|---|---|---|---|---|---|---|
| Quadrant | DetID | PixID | Counts | Sigma | Mean | Median | Sigma |
| A | 10 | 83 | 521141 | 4378.94 | 575 | 563 | 118.9 |
| A | 2 | 79 | 53689 | 446.88 | 575 | 563 | 118.9 |
| A | 13 | 6 | 13581 | 109.5 | 575 | 563 | 118.9 |
| B | 5 | 255 | 395375 | 3518.2 | 577 | 561 | 112.2 |
| B | 4 | 171 | 237685 | 2113.02 | 577 | 561 | 112.2 |
| B | 0 | 229 | 139811 | 1240.86 | 577 | 561 | 112.2 |
| C | 15 | 214 | 217294 | 1624.54 | 568 | 572 | 133.4 |
| C | 0 | 10 | 104651 | 780.17 | 568 | 572 | 133.4 |
| C | 5 | 10 | 8591 | 60.11 | 568 | 572 | 133.4 |
| D | 12 | 79 | 1521707 | 11134.78 | 556 | 540 | 136.6 |
| D | 2 | 249 | 267349 | 1953.01 | 556 | 540 | 136.6 |
| D | 2 | 16 | 100541 | 732.0 | 556 | 540 | 136.6 |
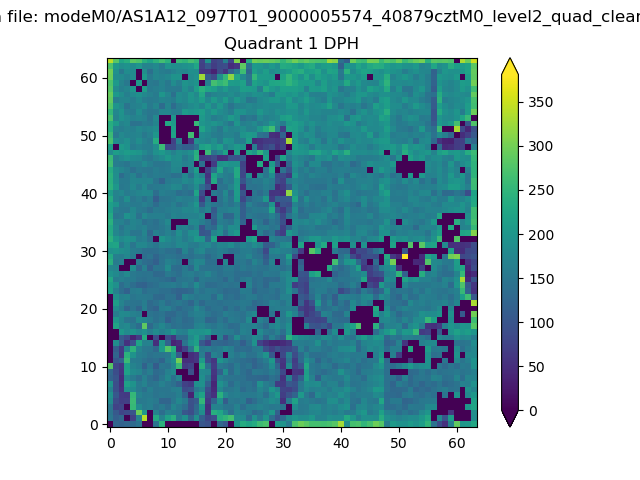
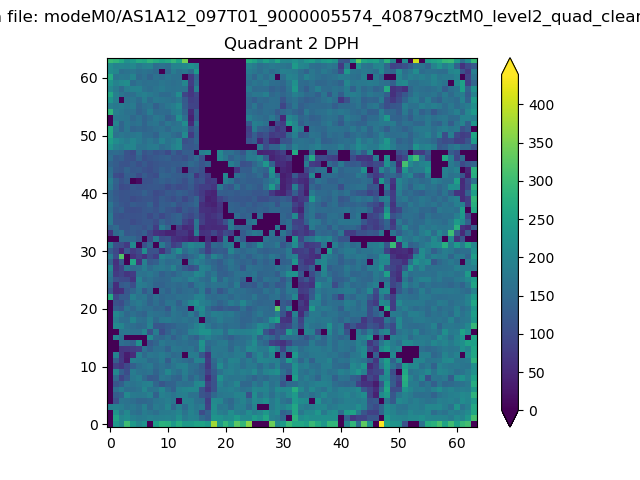
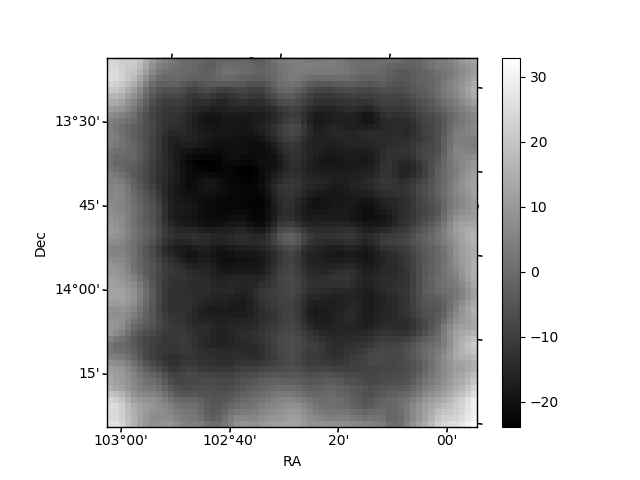
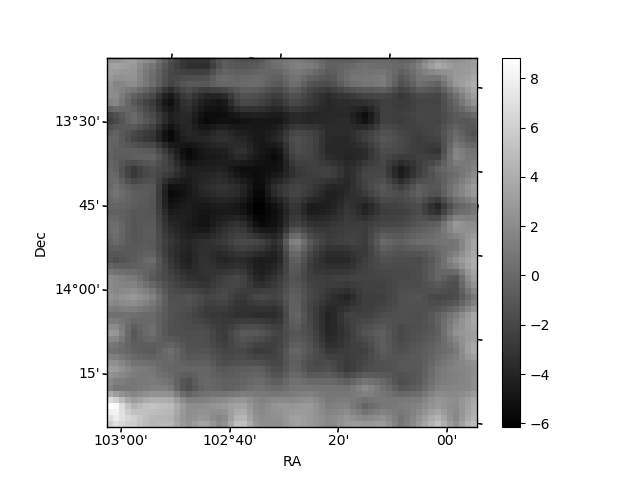
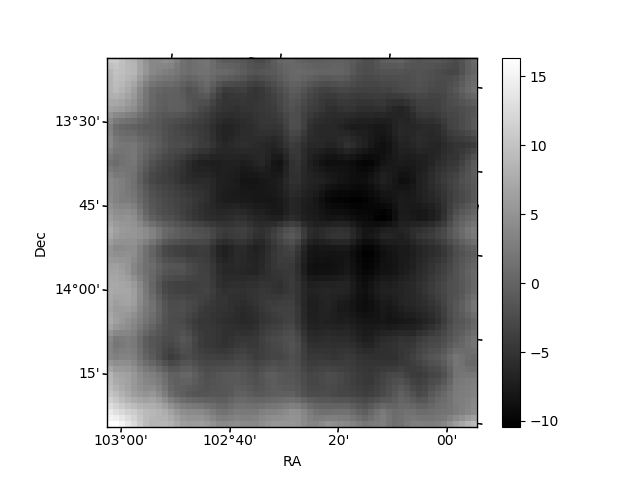
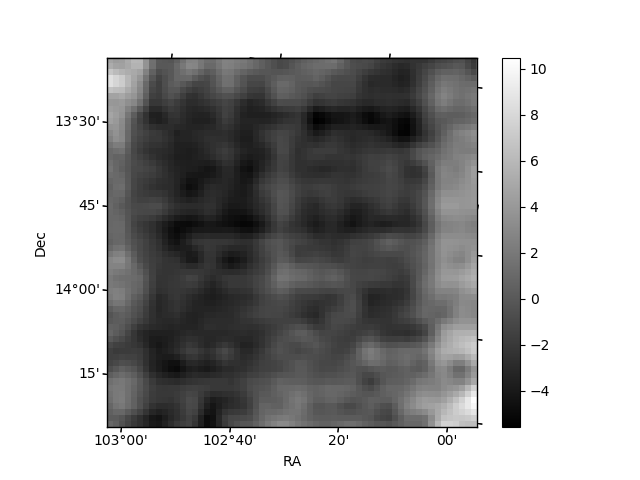
Histogram calculated using DETX and DETY for each event in the final _common_clean file
| Quadrant A | 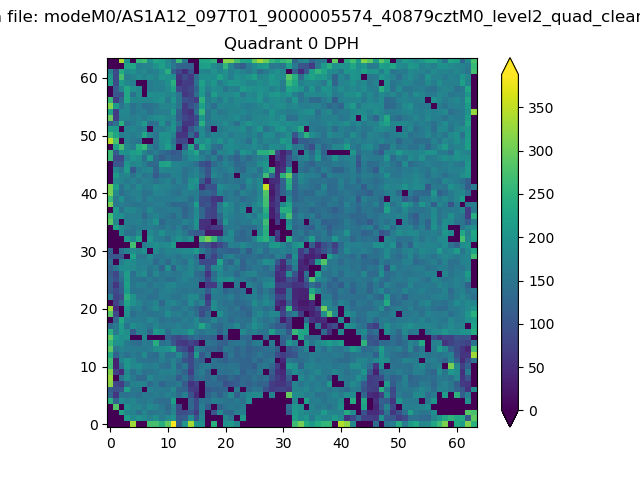 |
 |
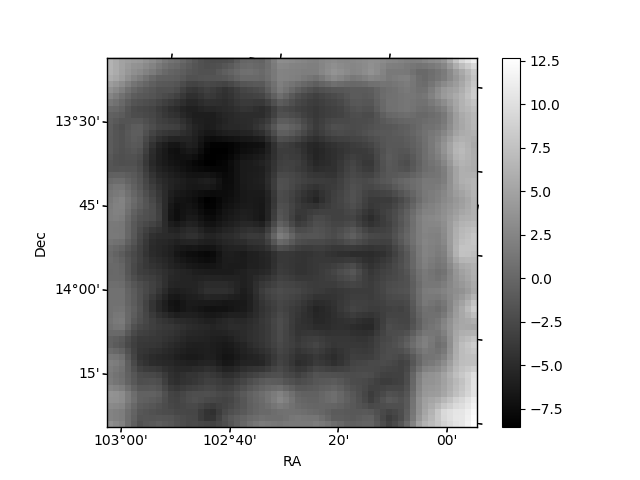
Quadrant B |
|---|---|---|---|
| Quadrant D | 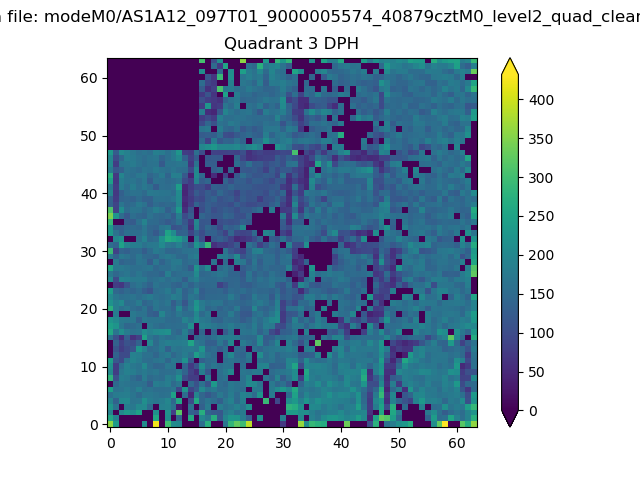 |
 |
Quadrant C |
| Plot type | Count rate plots | Images |
|---|---|---|
| Comparison with Poisson distribution Blue bars denote a histogram of data divided into 1 sec bins. Red curve is a Poisson curve with rate = median count rate of data. |
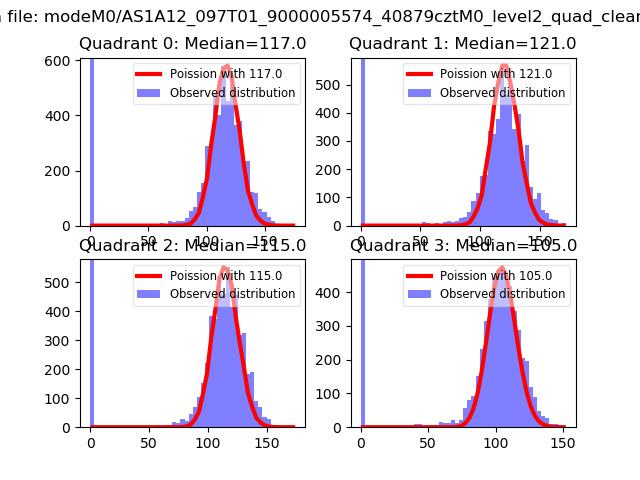 |
 |
| Quadrant-wise count rates Data is divided into 100 sec bins |
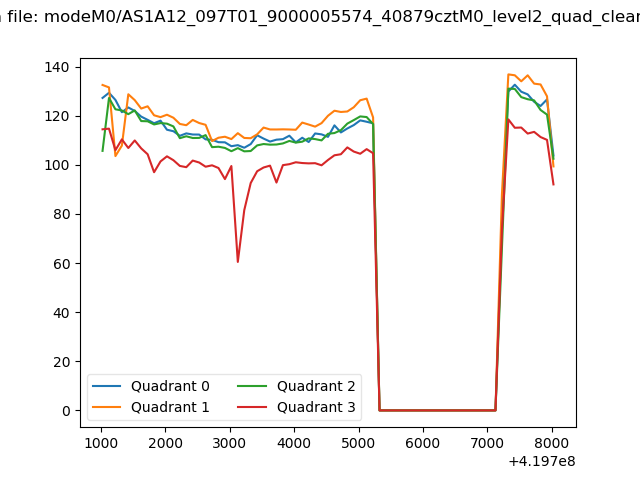 |
|
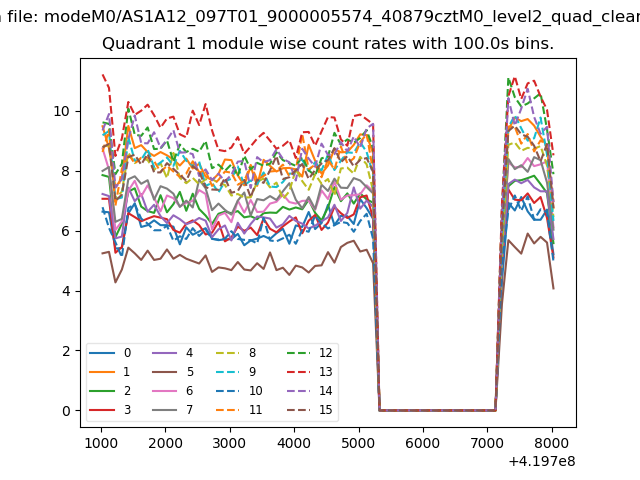
| Module-wise count rates for Quadrant A Data is divided into 100 sec bins |
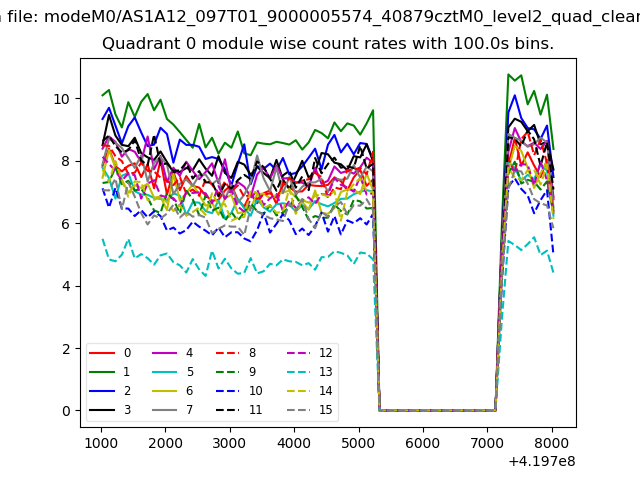 |
 |
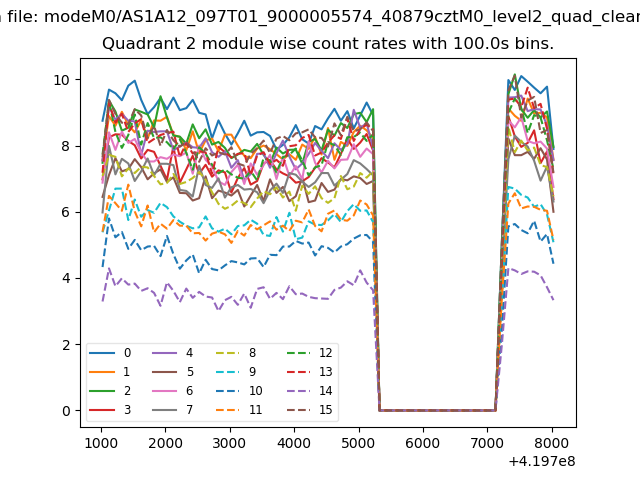
| Module-wise count rates for Quadrant B Data is divided into 100 sec bins |
 |
 |
| Module-wise count rates for Quadrant C Data is divided into 100 sec bins |
 |
 |
| Module-wise count rates for Quadrant D Data is divided into 100 sec bins |
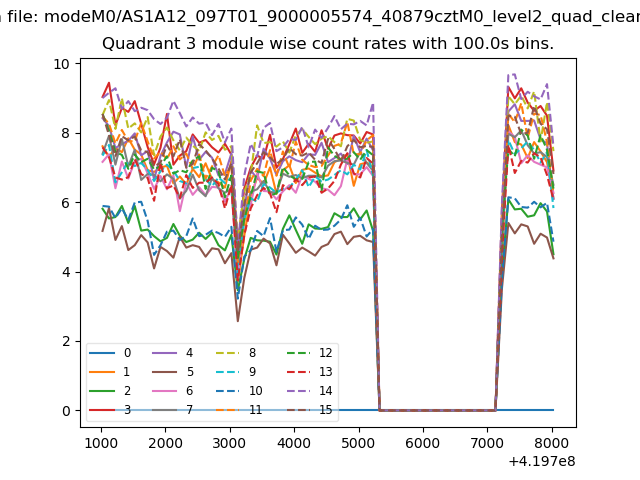 |
 |
| Parameter | Plot |
|---|---|
| CZT HV Monitor | 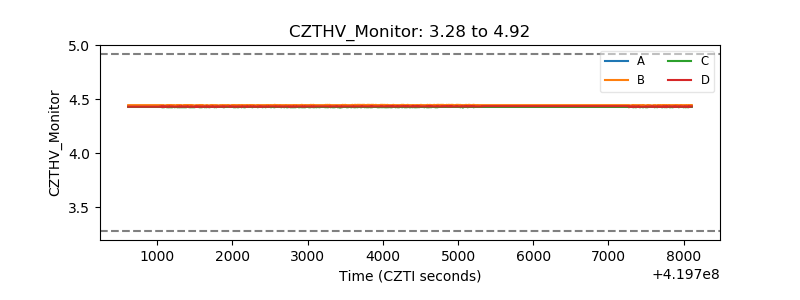 |
| D_VDD | 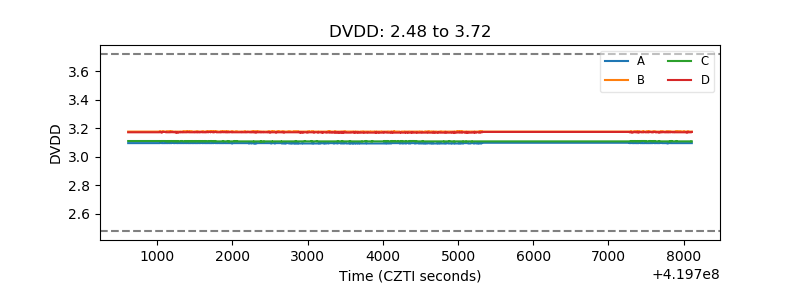 |
| Temperature 1 | 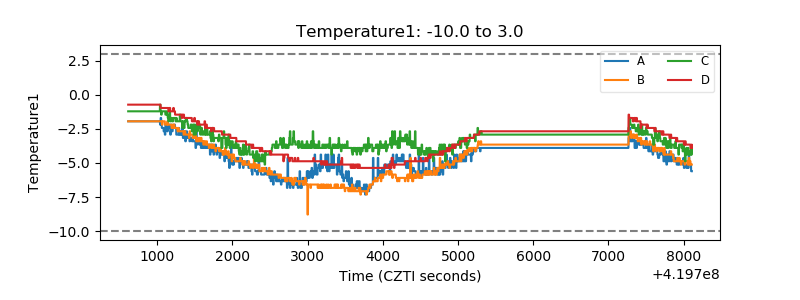 |
| Veto HV Monitor | 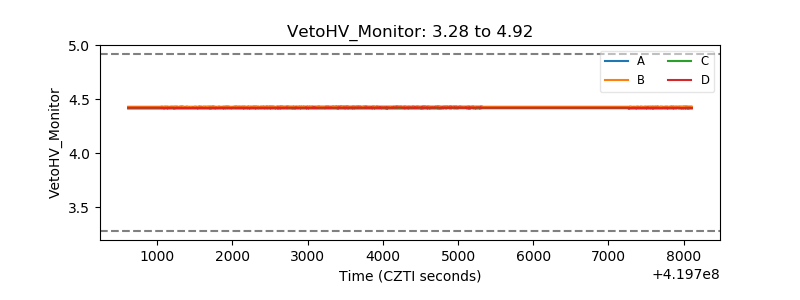 |
| Veto LLD | 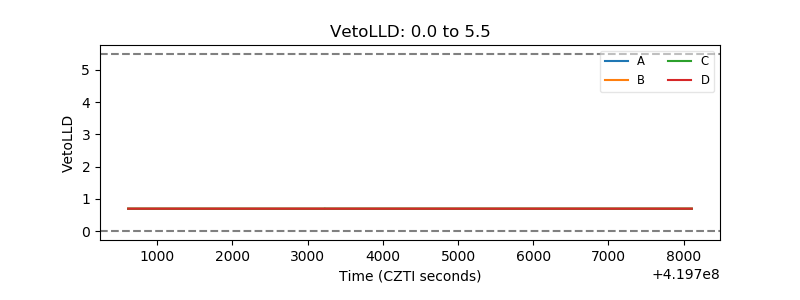 |
| Alpha Counter | 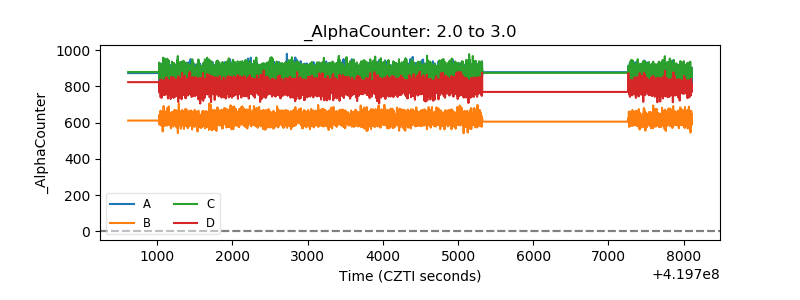 |
| _CPM_Rate | 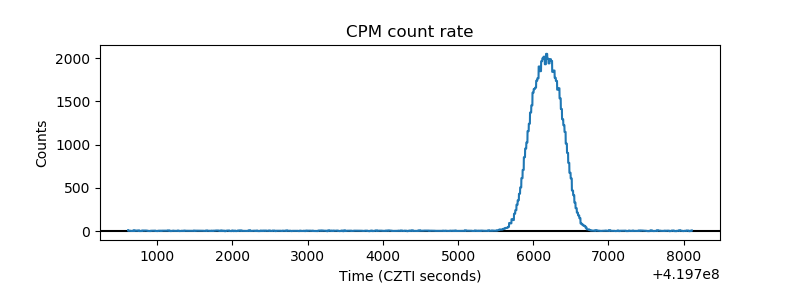 |
| CZT Counter | 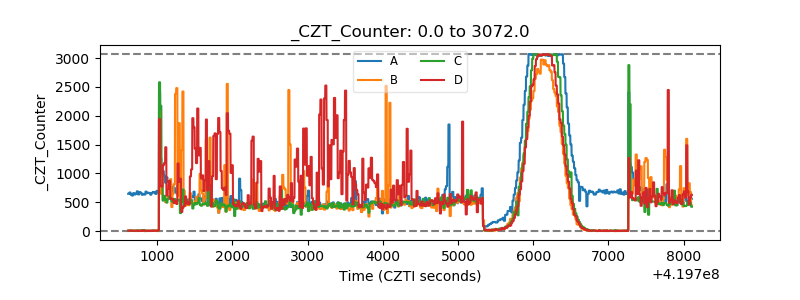 |
| +2.5 Volts monitor | 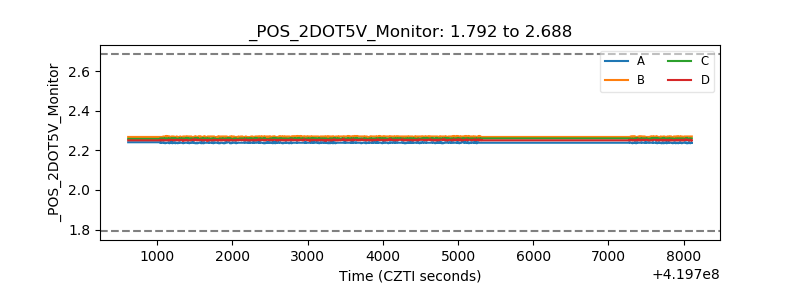 |
| +5 Volts monitor | 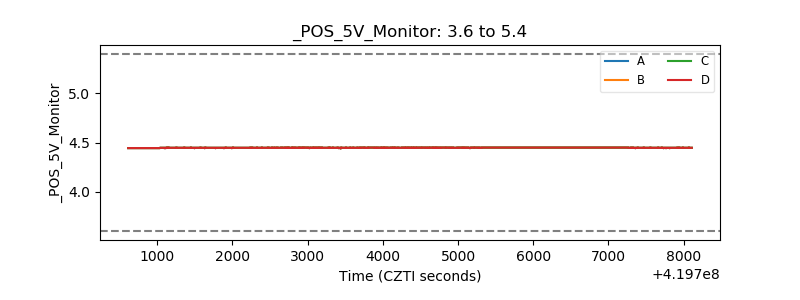 |
| _ROLL_ROT | 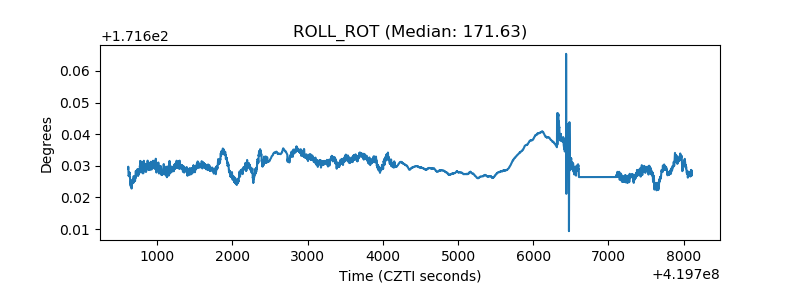 |
| _Roll_DEC | 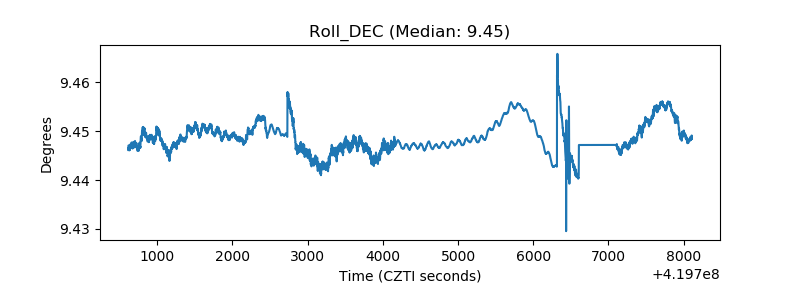 |
| _Roll_RA | 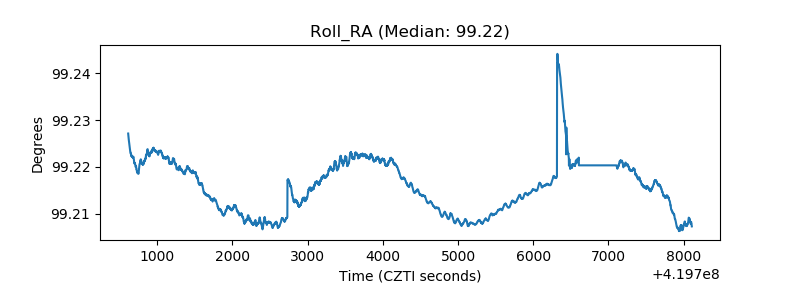 |
| Veto Counter | 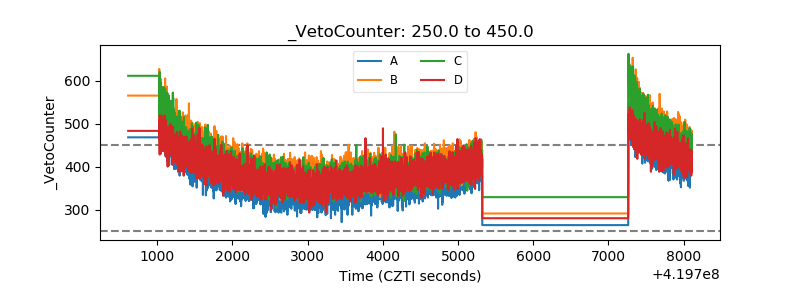 |