| Param | Original file | Final file |
|---|---|---|
| Filename | modeM0/AS1A12_097T01_9000005574_40880cztM0_level2.fits | modeM0/AS1A12_097T01_9000005574_40880cztM0_level2_quad_clean.evt |
| Size (bytes) | 341,429,760 | 87,932,160 |
| Size | 325.6 MB | 83.9 MB |
| Events in quadrant A | 2,801,810 | 598,791 |
| Events in quadrant B | 3,339,847 | 606,417 |
| Events in quadrant C | 2,542,379 | 590,352 |
| Events in quadrant D | 3,564,483 | 516,362 |
| Mode M9 | |||
|---|---|---|---|
| Quadrant | BADHDUFLAG | Total packets | Discarded packets |
| A | 0 | 22 | 0 |
| B | 0 | 22 | 0 |
| C | 0 | 22 | 0 |
| D | 0 | 23 | 0 |
| Mode SS | |||
|---|---|---|---|
| Quadrant | BADHDUFLAG | Total packets | Discarded packets |
| A | 0 | 100 | 0 |
| B | 0 | 100 | 0 |
| C | 0 | 100 | 0 |
| D | 0 | 100 | 0 |
| Mode M0 | |||
|---|---|---|---|
| Quadrant | BADHDUFLAG | Total packets | Discarded packets |
| A | 0 | 11337 | 3 |
| B | 0 | 13255 | 2 |
| C | 0 | 10495 | 2 |
| D | 0 | 13856 | 2 |
| Quadrant | Total seconds | Saturated seconds | Saturation percentage |
|---|---|---|---|
| A | 5010 | 14 | 0.279441% |
| B | 5010 | 225 | 4.491018% |
| C | 5010 | 28 | 0.558882% |
| D | 5010 | 227 | 4.530938% |
Noise dominated data is calculated using 1-second bins in cleaned event files. If a bin has >2000 counts, and if more than 50% of those come from <1% of pixels, then it is considered to be noise-dominated and hence unusable.
| Quadrant | # 1 sec bins | Bins with >0 counts | Bins with >2000 counts | High rate bins dominated by noise | Noise dominated (total time) | Noise dominated (detector-on time) | Marked lightcurve |
|---|---|---|---|---|---|---|---|
| A | 7042 | 5011 | 9 | 9 | 0.13% | 0.18% | 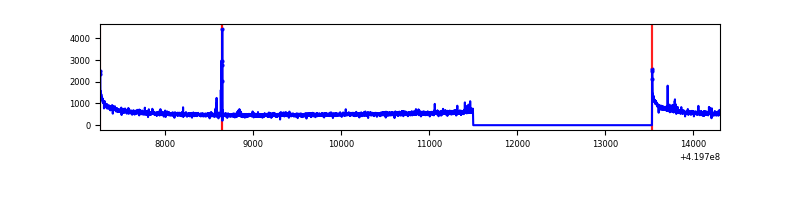 |
| B | 7042 | 5011 | 153 | 153 | 2.17% | 3.05% | 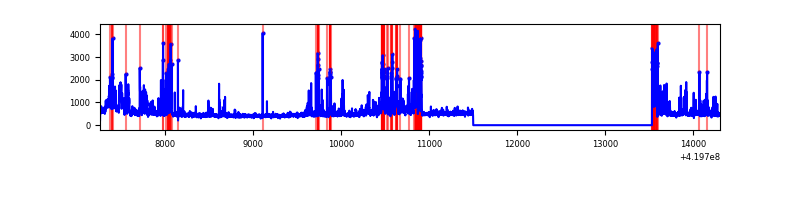 |
| C | 7042 | 5011 | 25 | 25 | 0.36% | 0.50% | 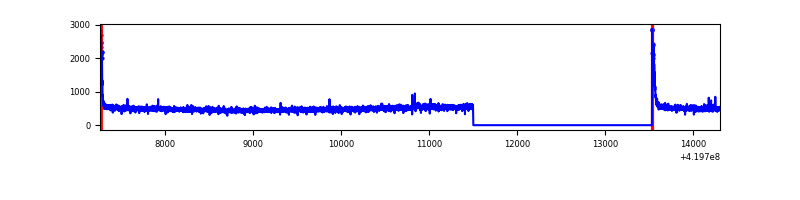 |
| D | 7042 | 5010 | 184 | 184 | 2.61% | 3.67% | 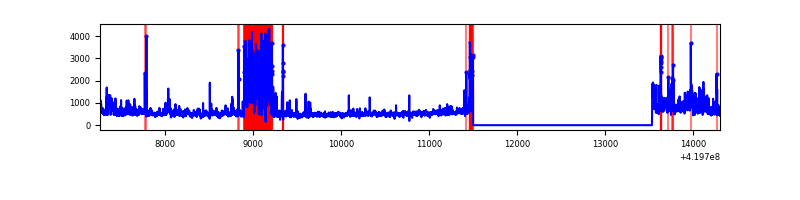 |
Top three noisy pixels from each quadrant. If the there are fewer than three noisy pixels in the level2.evt file, extra rows are filled as -1
| Pixel properties | Quadrant properties | ||||||
|---|---|---|---|---|---|---|---|
| Quadrant | DetID | PixID | Counts | Sigma | Mean | Median | Sigma |
| A | 10 | 83 | 504738 | 4277.23 | 573 | 563 | 117.9 |
| A | 13 | 248 | 34313 | 286.32 | 573 | 563 | 117.9 |
| A | 12 | 189 | 19310 | 159.04 | 573 | 563 | 117.9 |
| B | 4 | 171 | 640415 | 5830.74 | 568 | 552 | 109.7 |
| B | 5 | 255 | 262694 | 2388.77 | 568 | 552 | 109.7 |
| B | 0 | 229 | 126470 | 1147.43 | 568 | 552 | 109.7 |
| C | 15 | 214 | 213020 | 1605.47 | 563 | 568 | 132.3 |
| C | 0 | 10 | 104524 | 785.58 | 563 | 568 | 132.3 |
| C | 10 | 70 | 14928 | 108.52 | 563 | 568 | 132.3 |
| D | 12 | 79 | 639061 | 4768.65 | 543 | 527 | 133.9 |
| D | 2 | 249 | 530828 | 3960.36 | 543 | 527 | 133.9 |
| D | 13 | 249 | 132875 | 988.39 | 543 | 527 | 133.9 |
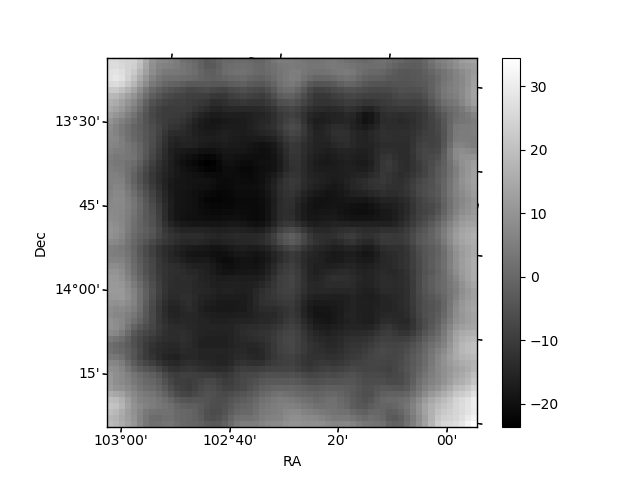
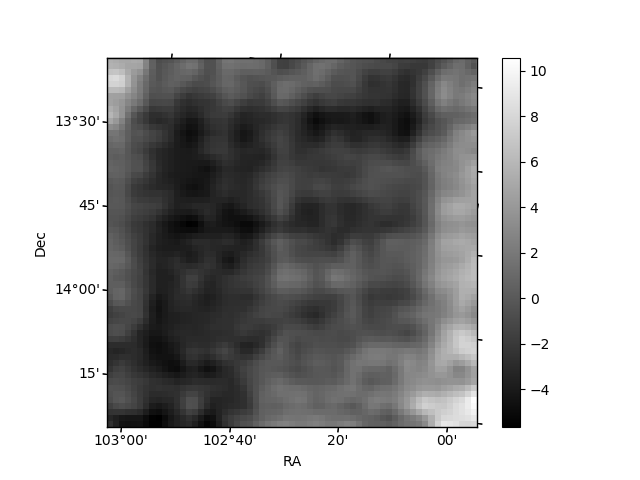
Histogram calculated using DETX and DETY for each event in the final _common_clean file
| Quadrant A | 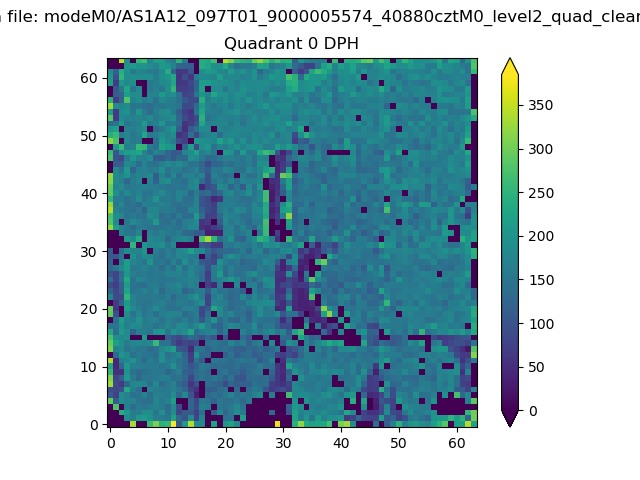 |
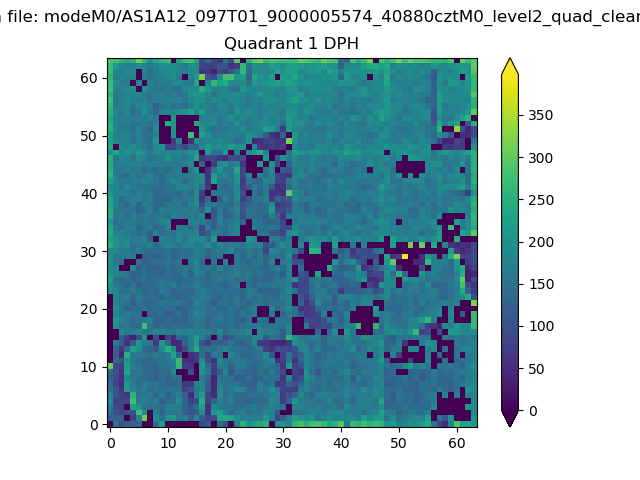 |
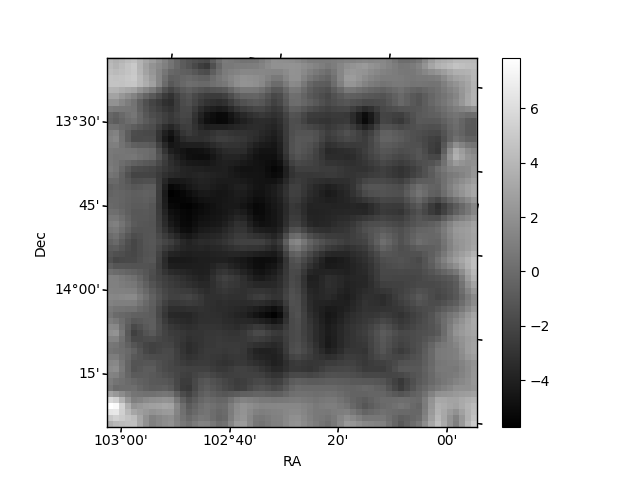
Quadrant B |
|---|---|---|---|
| Quadrant D | 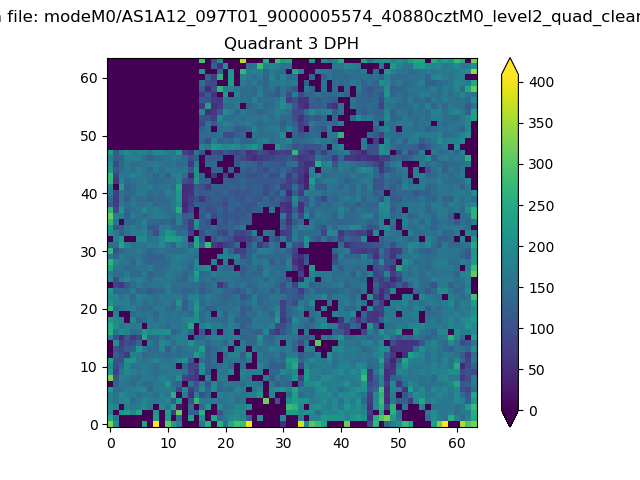 |
 |
Quadrant C |
| Plot type | Count rate plots | Images |
|---|---|---|
| Comparison with Poisson distribution Blue bars denote a histogram of data divided into 1 sec bins. Red curve is a Poisson curve with rate = median count rate of data. |
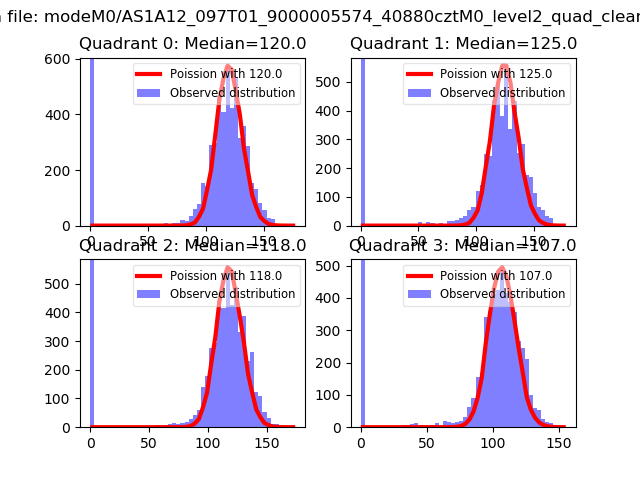 |
 |
| Quadrant-wise count rates Data is divided into 100 sec bins |
 |
|
| Module-wise count rates for Quadrant A Data is divided into 100 sec bins |
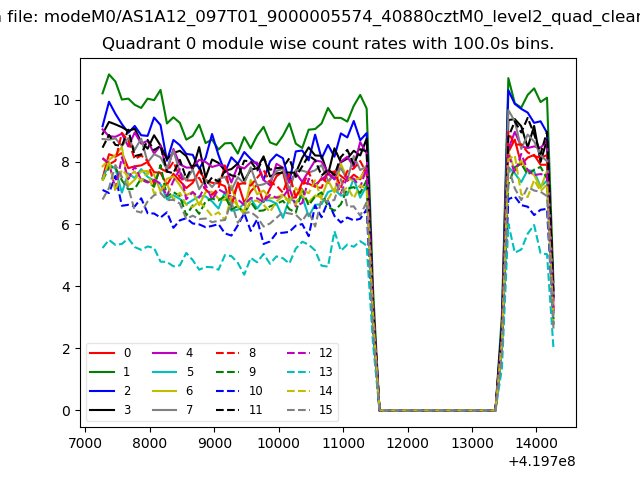 |
 |
| Module-wise count rates for Quadrant B Data is divided into 100 sec bins |
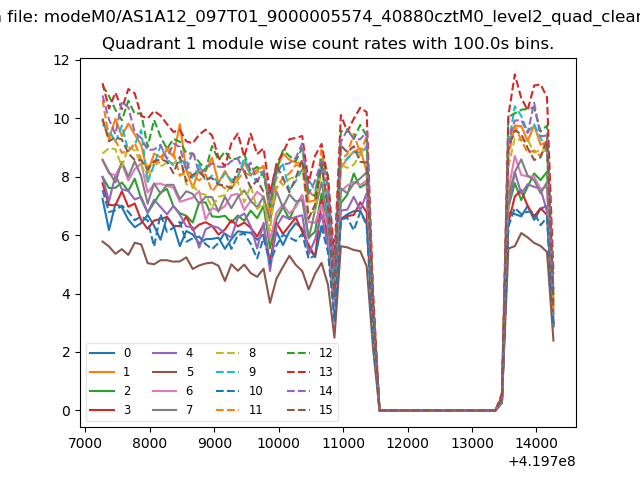 |
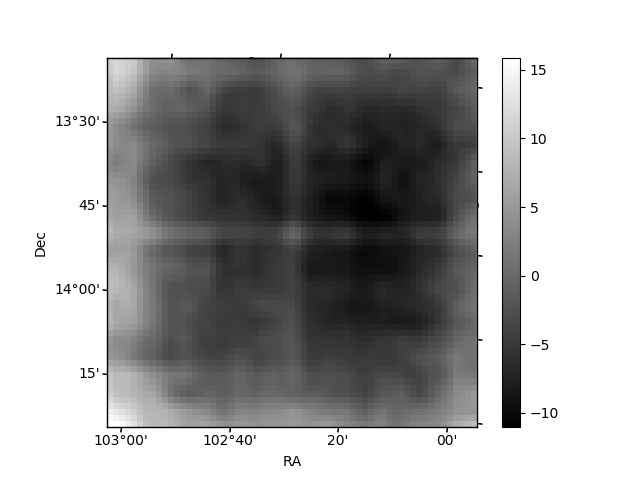 |
| Module-wise count rates for Quadrant C Data is divided into 100 sec bins |
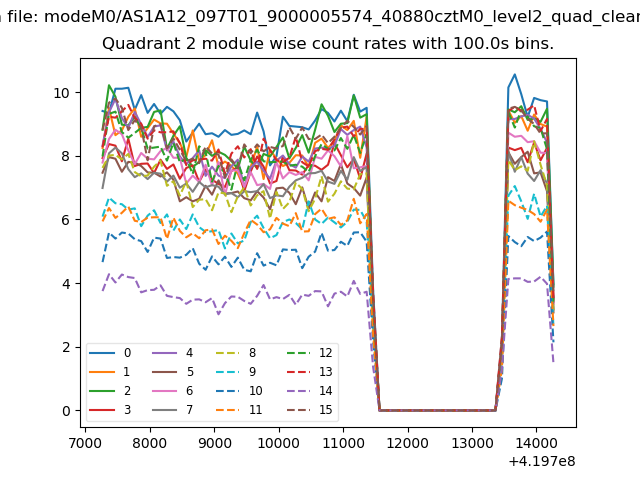 |
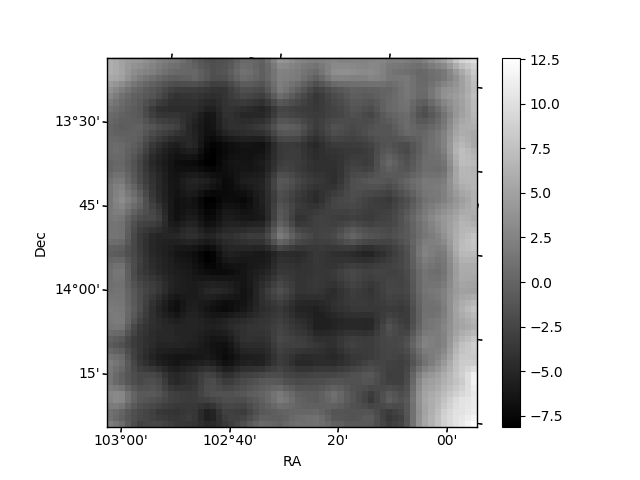 |
| Module-wise count rates for Quadrant D Data is divided into 100 sec bins |
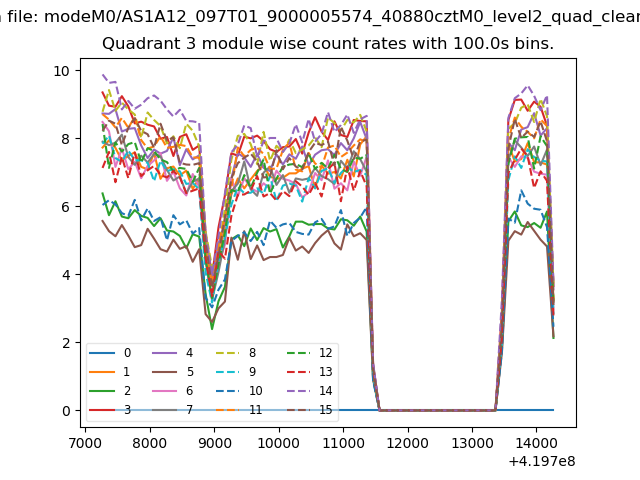 |
 |
| Parameter | Plot |
|---|---|
| CZT HV Monitor | 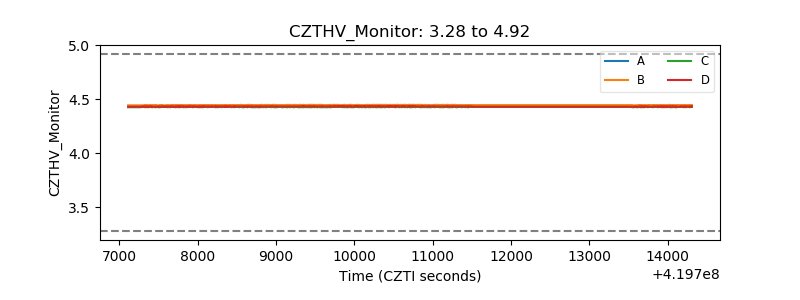 |
| D_VDD | 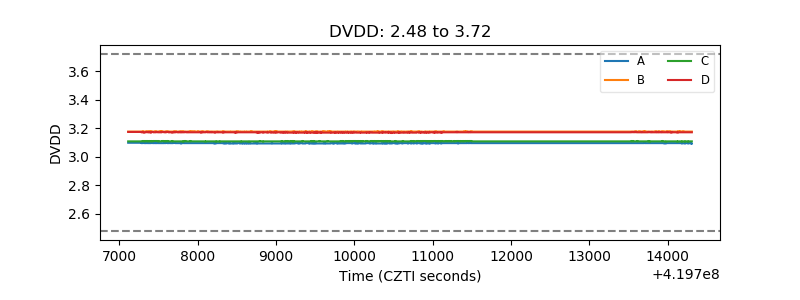 |
| Temperature 1 | 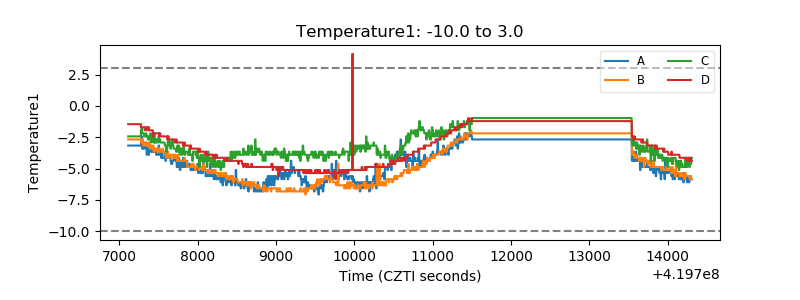 |
| Veto HV Monitor |  |
| Veto LLD | 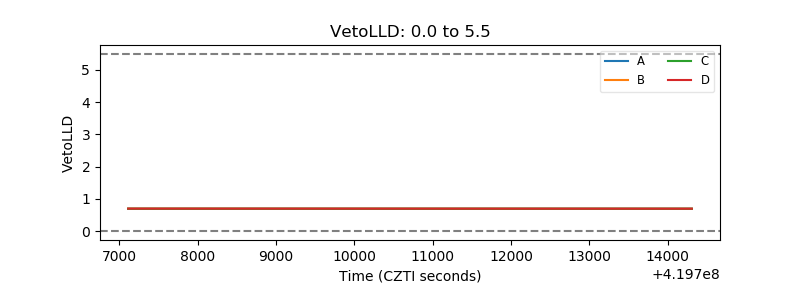 |
| Alpha Counter | 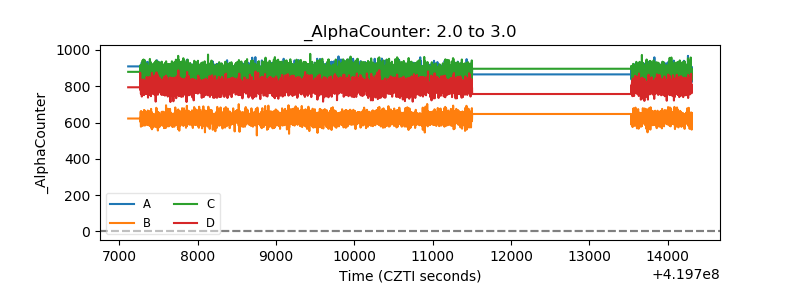 |
| _CPM_Rate | 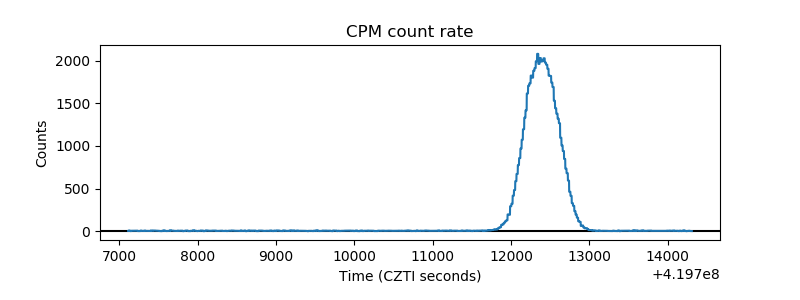 |
| CZT Counter | 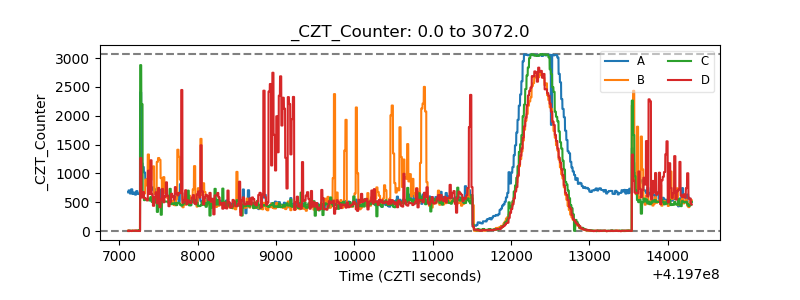 |
| +2.5 Volts monitor | 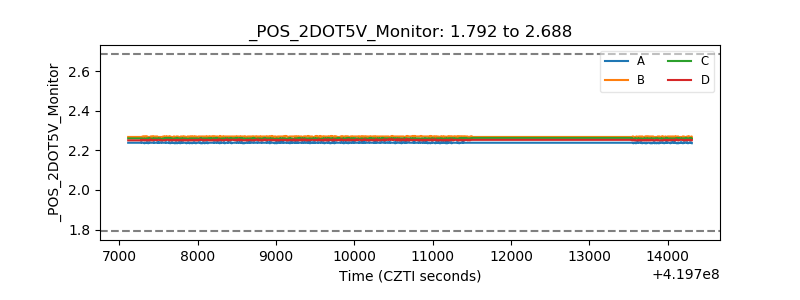 |
| +5 Volts monitor | 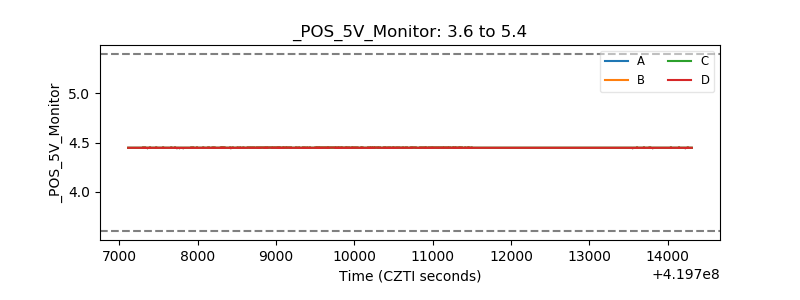 |
| _ROLL_ROT | 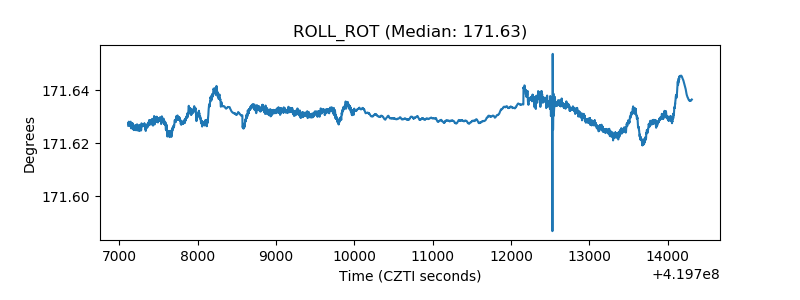 |
| _Roll_DEC | 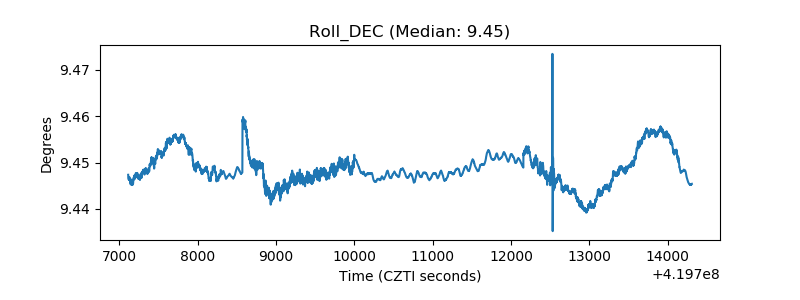 |
| _Roll_RA | 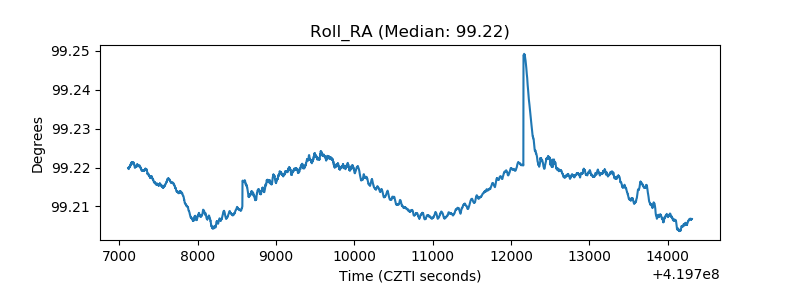 |
| Veto Counter | 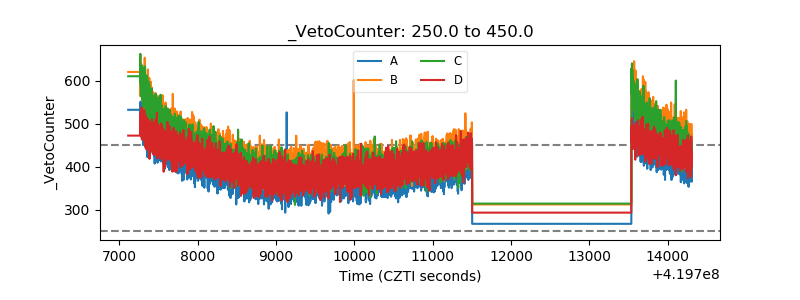 |