| Param | Original file | Final file |
|---|---|---|
| Filename | modeM0/AS1A12_097T01_9000005574_40881cztM0_level2.fits | modeM0/AS1A12_097T01_9000005574_40881cztM0_level2_quad_clean.evt |
| Size (bytes) | 354,916,800 | 85,302,720 |
| Size | 338.5 MB | 81.4 MB |
| Events in quadrant A | 2,734,922 | 580,159 |
| Events in quadrant B | 3,447,100 | 582,436 |
| Events in quadrant C | 2,635,627 | 569,051 |
| Events in quadrant D | 3,941,102 | 509,304 |
| Mode M9 | |||
|---|---|---|---|
| Quadrant | BADHDUFLAG | Total packets | Discarded packets |
| A | 0 | 29 | 0 |
| B | 0 | 29 | 0 |
| C | 0 | 29 | 0 |
| D | 0 | 30 | 0 |
| Mode SS | |||
|---|---|---|---|
| Quadrant | BADHDUFLAG | Total packets | Discarded packets |
| A | 0 | 100 | 0 |
| B | 0 | 100 | 0 |
| C | 0 | 100 | 0 |
| D | 0 | 100 | 0 |
| Mode M0 | |||
|---|---|---|---|
| Quadrant | BADHDUFLAG | Total packets | Discarded packets |
| A | 0 | 10994 | 3 |
| B | 0 | 13406 | 2 |
| C | 0 | 10791 | 2 |
| D | 0 | 15133 | 2 |
| Quadrant | Total seconds | Saturated seconds | Saturation percentage |
|---|---|---|---|
| A | 4874 | 9 | 0.184653% |
| B | 4874 | 296 | 6.073041% |
| C | 4874 | 41 | 0.841198% |
| D | 4874 | 101 | 2.072220% |
Noise dominated data is calculated using 1-second bins in cleaned event files. If a bin has >2000 counts, and if more than 50% of those come from <1% of pixels, then it is considered to be noise-dominated and hence unusable.
| Quadrant | # 1 sec bins | Bins with >0 counts | Bins with >2000 counts | High rate bins dominated by noise | Noise dominated (total time) | Noise dominated (detector-on time) | Marked lightcurve |
|---|---|---|---|---|---|---|---|
| A | 6998 | 4875 | 8 | 8 | 0.11% | 0.16% | 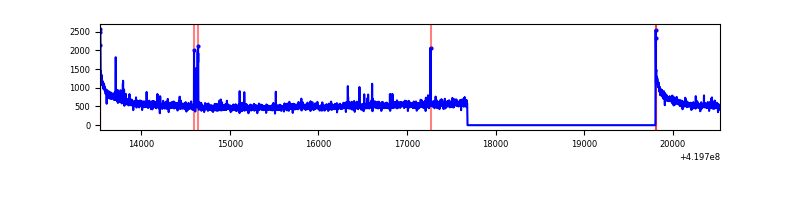 |
| B | 6998 | 4875 | 202 | 202 | 2.89% | 4.14% | 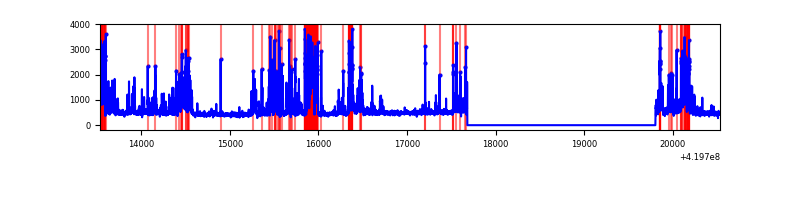 |
| C | 6998 | 4875 | 28 | 28 | 0.40% | 0.57% | 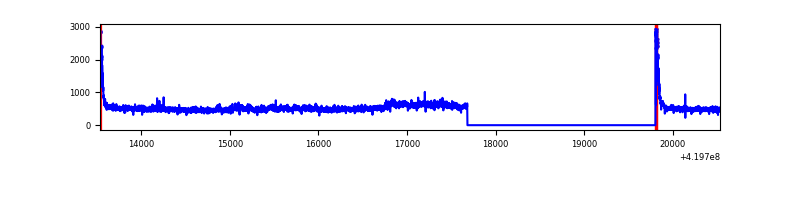 |
| D | 6998 | 4875 | 89 | 89 | 1.27% | 1.83% | 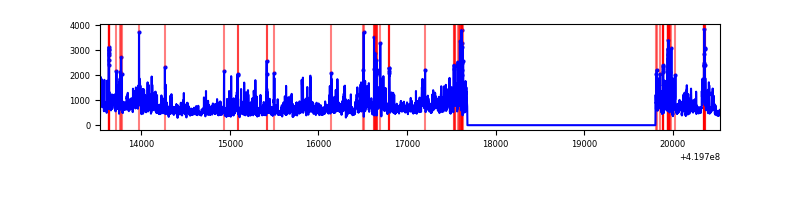 |
Top three noisy pixels from each quadrant. If the there are fewer than three noisy pixels in the level2.evt file, extra rows are filled as -1
| Pixel properties | Quadrant properties | ||||||
|---|---|---|---|---|---|---|---|
| Quadrant | DetID | PixID | Counts | Sigma | Mean | Median | Sigma |
| A | 10 | 83 | 476247 | 4138.81 | 559 | 549 | 114.9 |
| A | 13 | 248 | 35911 | 307.67 | 559 | 549 | 114.9 |
| A | 2 | 79 | 30537 | 260.91 | 559 | 549 | 114.9 |
| B | 4 | 171 | 853155 | 8046.33 | 553 | 540 | 106.0 |
| B | 5 | 255 | 390465 | 3679.81 | 553 | 540 | 106.0 |
| B | 0 | 183 | 18434 | 168.87 | 553 | 540 | 106.0 |
| C | 15 | 214 | 206784 | 1616.67 | 547 | 551 | 127.6 |
| C | 3 | 233 | 152030 | 1187.45 | 547 | 551 | 127.6 |
| C | 0 | 10 | 130964 | 1022.31 | 547 | 551 | 127.6 |
| D | 12 | 79 | 1379020 | 10387.6 | 534 | 518 | 132.7 |
| D | 1 | 47 | 177780 | 1335.74 | 534 | 518 | 132.7 |
| D | 13 | 249 | 141842 | 1064.93 | 534 | 518 | 132.7 |
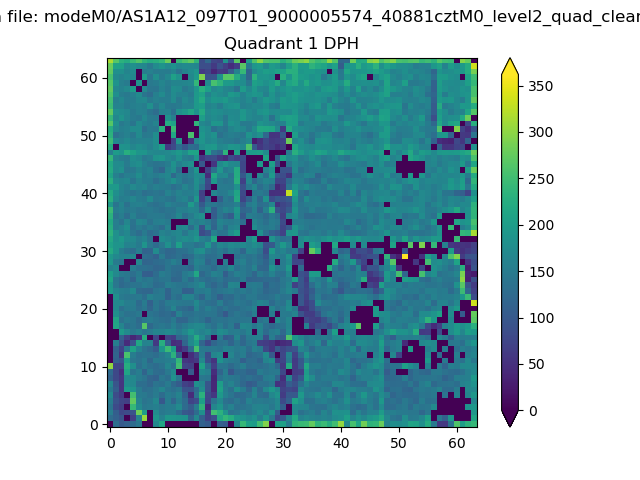
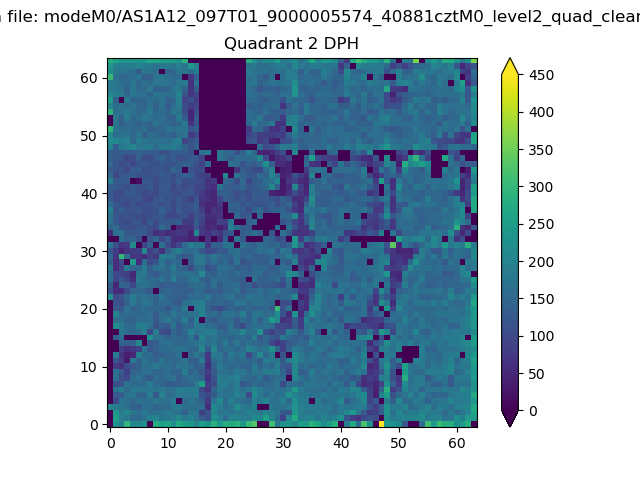
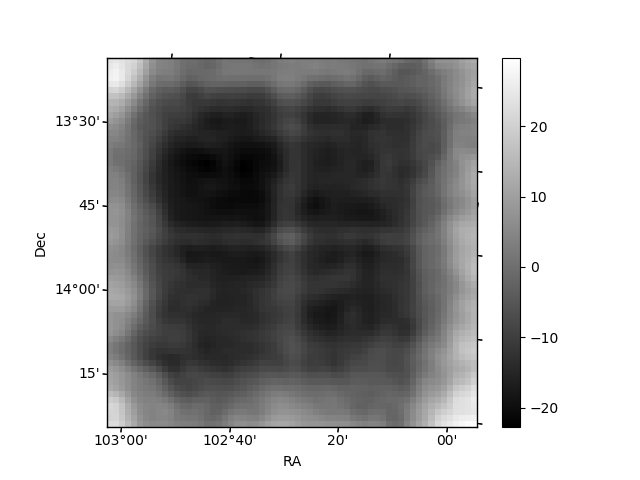
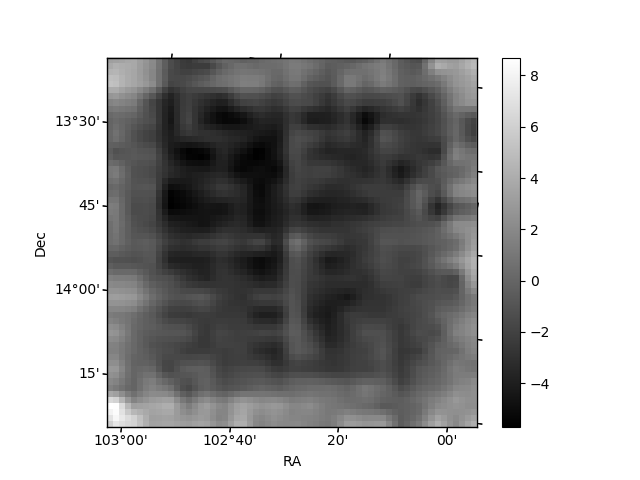
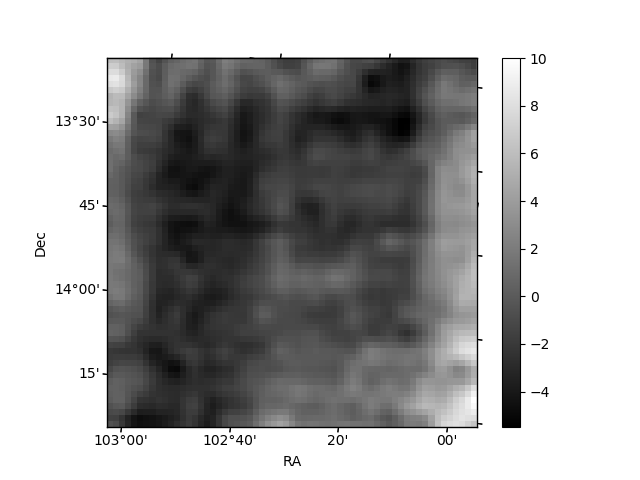
Histogram calculated using DETX and DETY for each event in the final _common_clean file
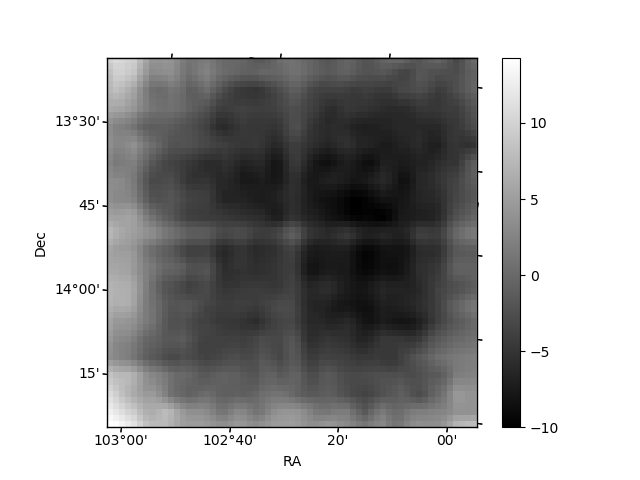
| Quadrant A |  |
 |
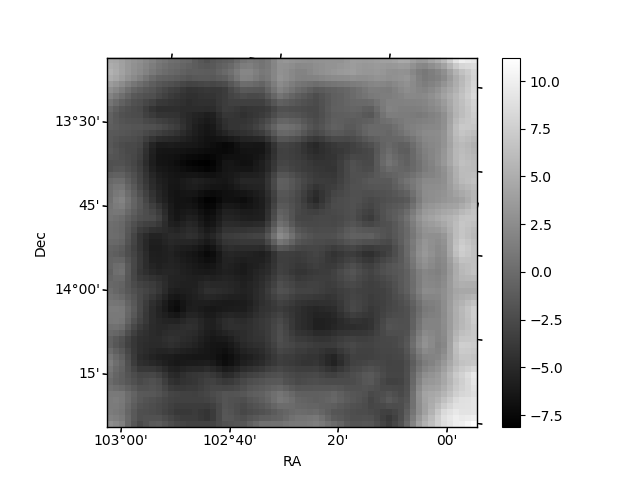
Quadrant B |
|---|---|---|---|
| Quadrant D | 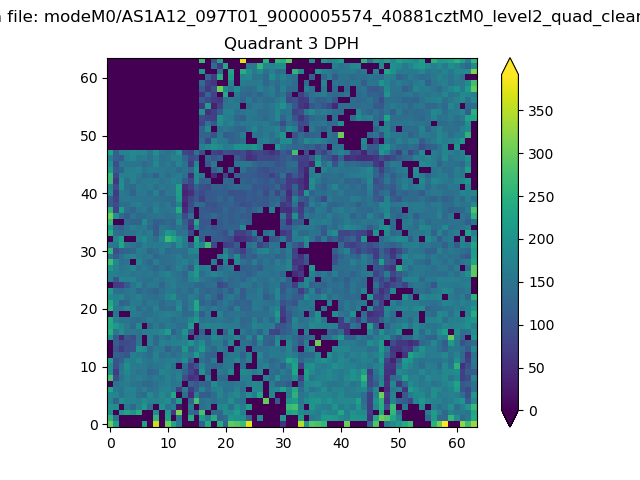 |
 |
Quadrant C |
| Plot type | Count rate plots | Images |
|---|---|---|
| Comparison with Poisson distribution Blue bars denote a histogram of data divided into 1 sec bins. Red curve is a Poisson curve with rate = median count rate of data. |
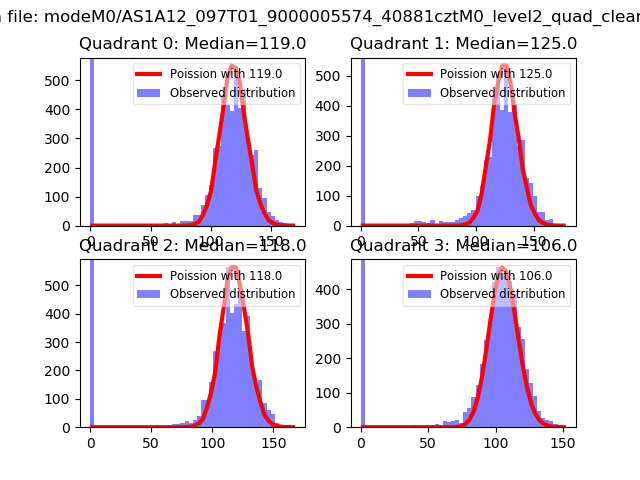 |
 |
| Quadrant-wise count rates Data is divided into 100 sec bins |
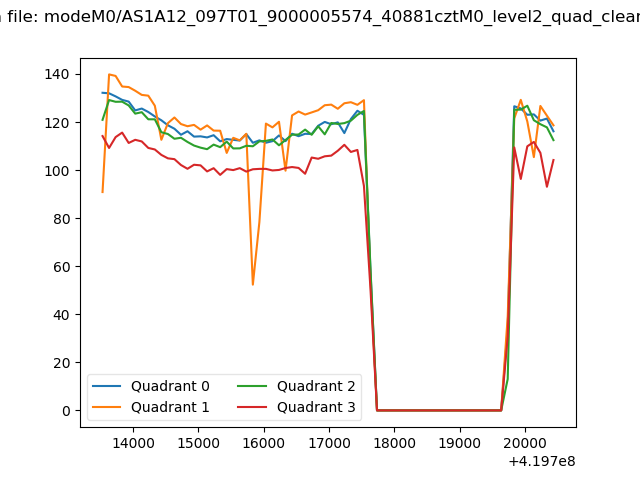 |
|
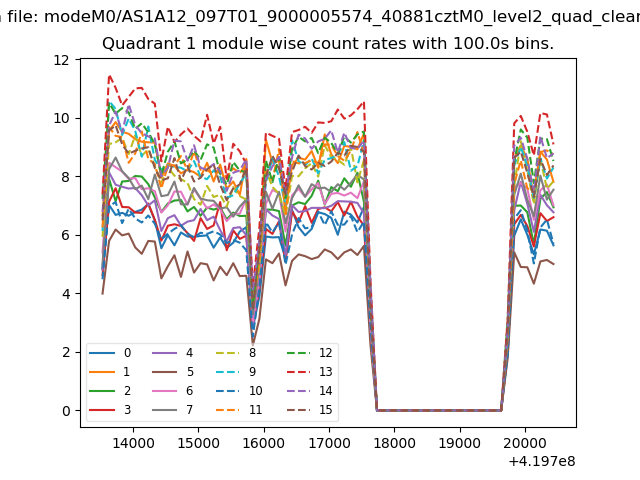
| Module-wise count rates for Quadrant A Data is divided into 100 sec bins |
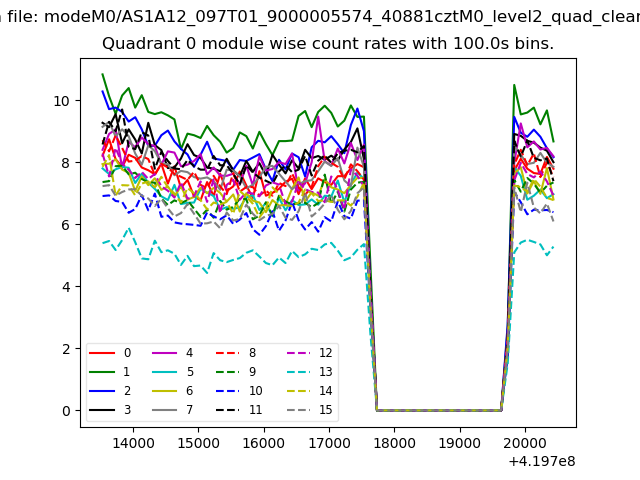 |
 |
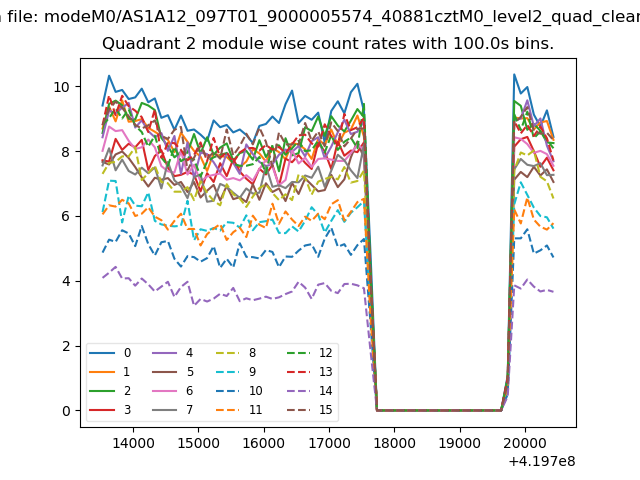
| Module-wise count rates for Quadrant B Data is divided into 100 sec bins |
 |
 |
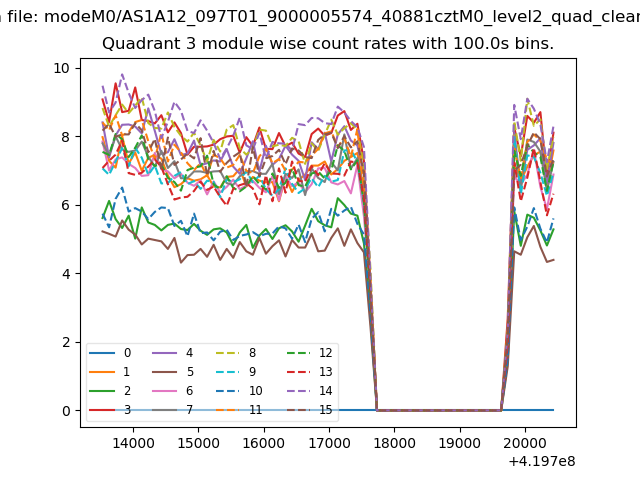
| Module-wise count rates for Quadrant C Data is divided into 100 sec bins |
 |
 |
| Module-wise count rates for Quadrant D Data is divided into 100 sec bins |
 |
 |
| Parameter | Plot |
|---|---|
| CZT HV Monitor |  |
| D_VDD | 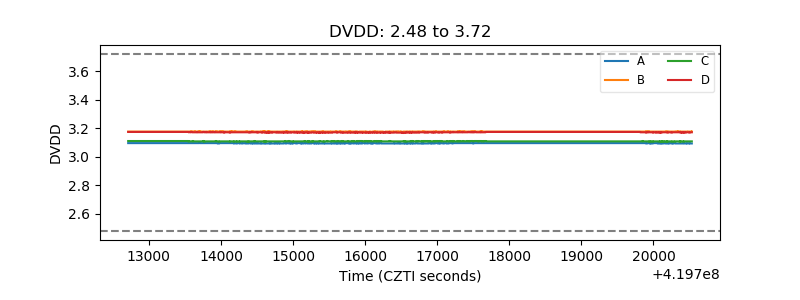 |
| Temperature 1 | 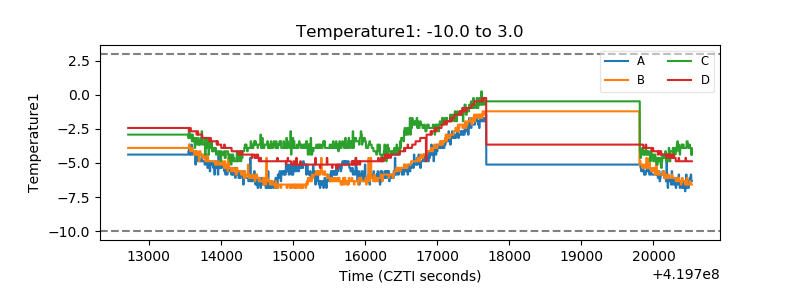 |
| Veto HV Monitor | 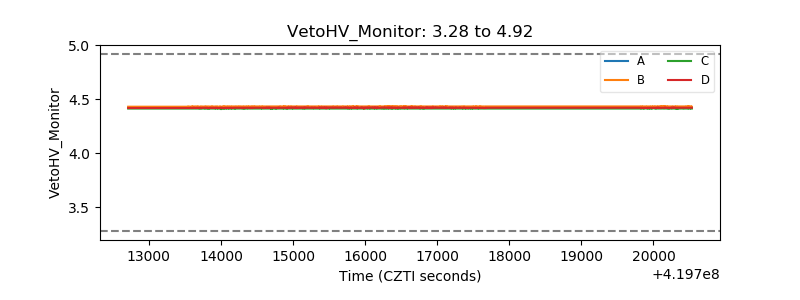 |
| Veto LLD | 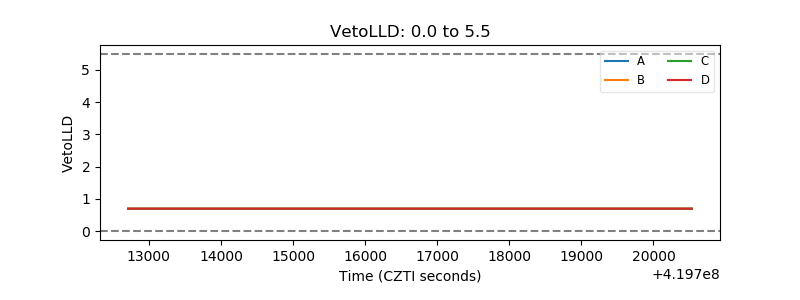 |
| Alpha Counter | 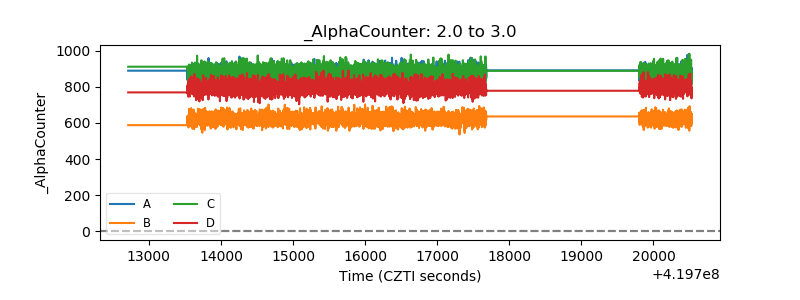 |
| _CPM_Rate | 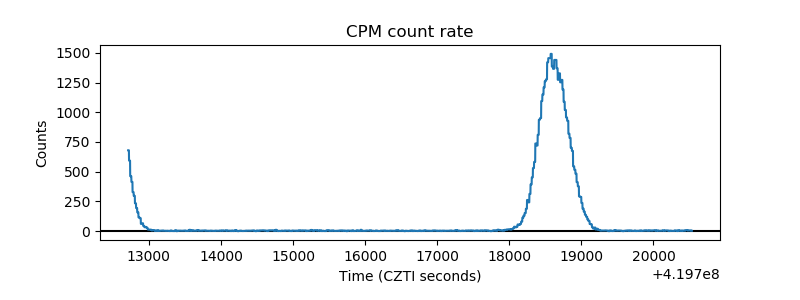 |
| CZT Counter | 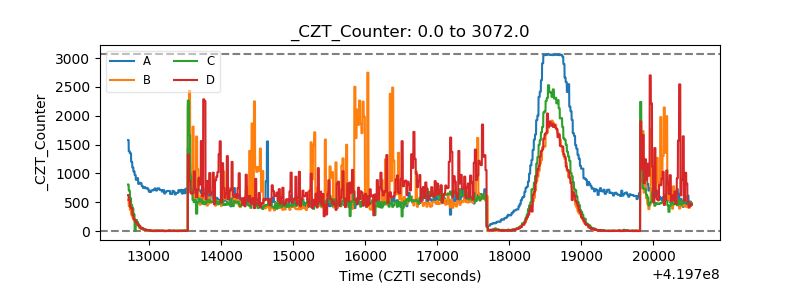 |
| +2.5 Volts monitor | 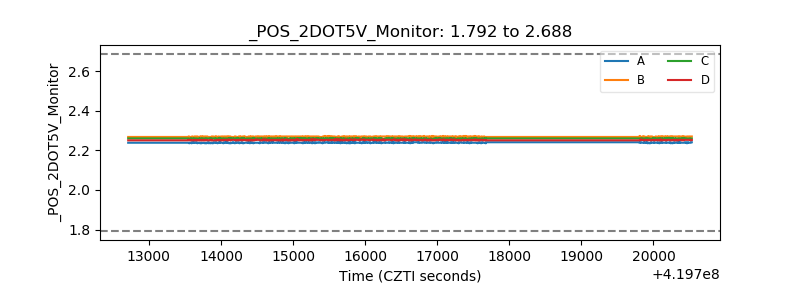 |
| +5 Volts monitor | 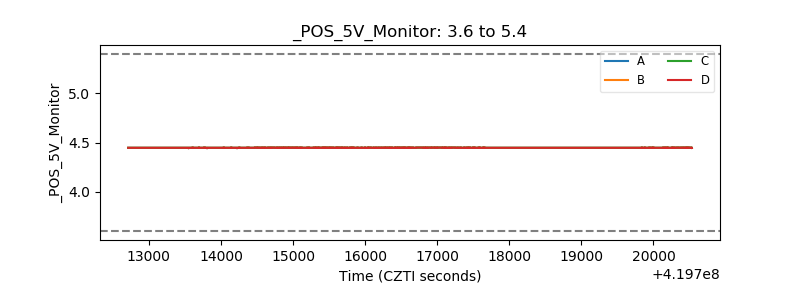 |
| _ROLL_ROT | 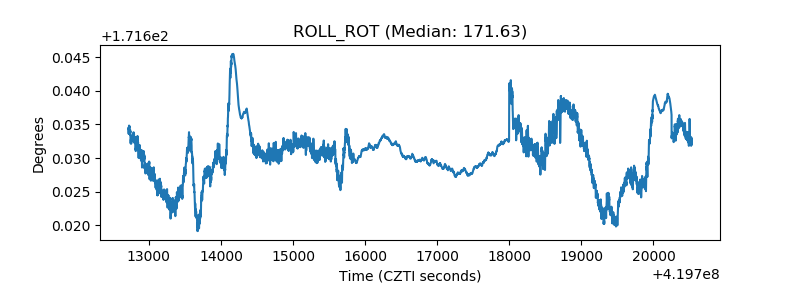 |
| _Roll_DEC | 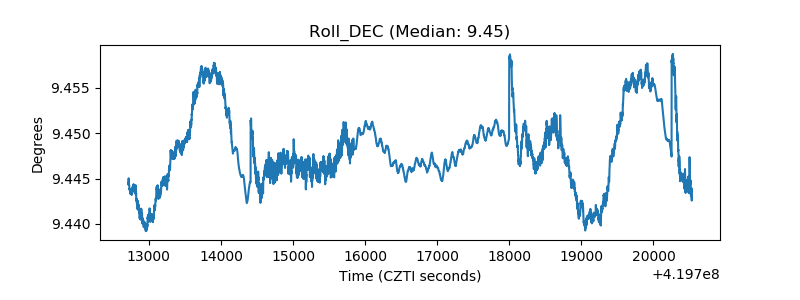 |
| _Roll_RA | 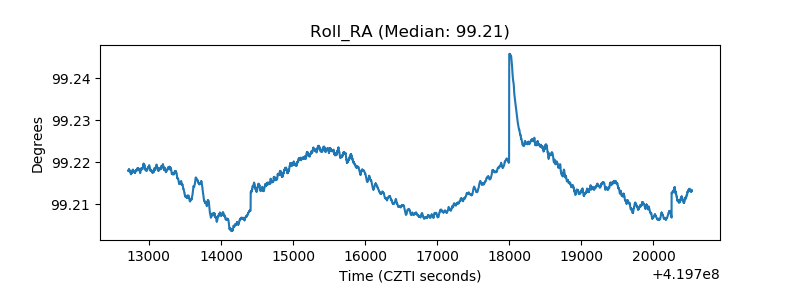 |
| Veto Counter | 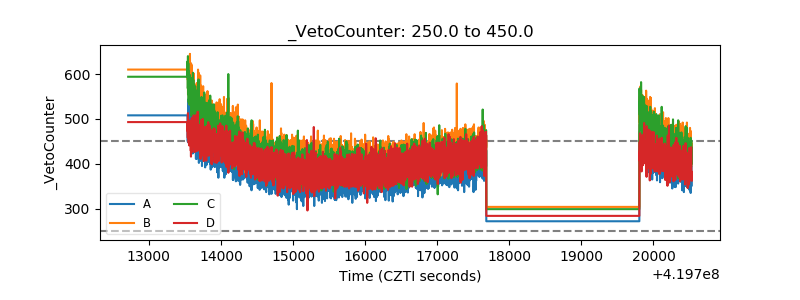 |