| Param | Original file | Final file |
|---|---|---|
| Filename | modeM0/AS1A12_097T01_9000005574_40882cztM0_level2.fits | modeM0/AS1A12_097T01_9000005574_40882cztM0_level2_quad_clean.evt |
| Size (bytes) | 341,472,960 | 83,764,800 |
| Size | 325.7 MB | 79.9 MB |
| Events in quadrant A | 2,744,905 | 566,379 |
| Events in quadrant B | 3,310,196 | 568,135 |
| Events in quadrant C | 2,448,546 | 558,709 |
| Events in quadrant D | 3,752,838 | 497,364 |
| Mode M9 | |||
|---|---|---|---|
| Quadrant | BADHDUFLAG | Total packets | Discarded packets |
| A | 0 | 36 | 0 |
| B | 0 | 36 | 0 |
| C | 0 | 36 | 0 |
| D | 0 | 37 | 0 |
| Mode SS | |||
|---|---|---|---|
| Quadrant | BADHDUFLAG | Total packets | Discarded packets |
| A | 0 | 102 | 0 |
| B | 0 | 102 | 0 |
| C | 0 | 102 | 0 |
| D | 0 | 102 | 0 |
| Mode M0 | |||
|---|---|---|---|
| Quadrant | BADHDUFLAG | Total packets | Discarded packets |
| A | 0 | 11100 | 3 |
| B | 0 | 13130 | 2 |
| C | 0 | 10232 | 2 |
| D | 0 | 14606 | 2 |
| Quadrant | Total seconds | Saturated seconds | Saturation percentage |
|---|---|---|---|
| A | 4928 | 17 | 0.344968% |
| B | 4928 | 292 | 5.925325% |
| C | 4928 | 30 | 0.608766% |
| D | 4928 | 144 | 2.922078% |
Noise dominated data is calculated using 1-second bins in cleaned event files. If a bin has >2000 counts, and if more than 50% of those come from <1% of pixels, then it is considered to be noise-dominated and hence unusable.
| Quadrant | # 1 sec bins | Bins with >0 counts | Bins with >2000 counts | High rate bins dominated by noise | Noise dominated (total time) | Noise dominated (detector-on time) | Marked lightcurve |
|---|---|---|---|---|---|---|---|
| A | 7050 | 4929 | 13 | 13 | 0.18% | 0.26% | 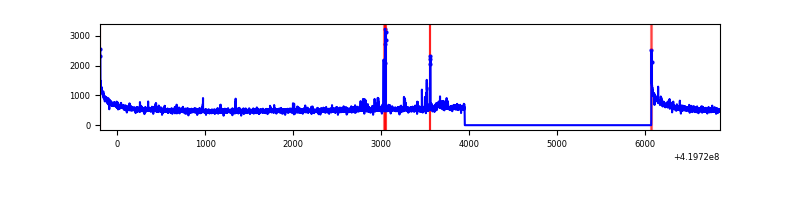 |
| B | 7050 | 4929 | 167 | 167 | 2.37% | 3.39% | 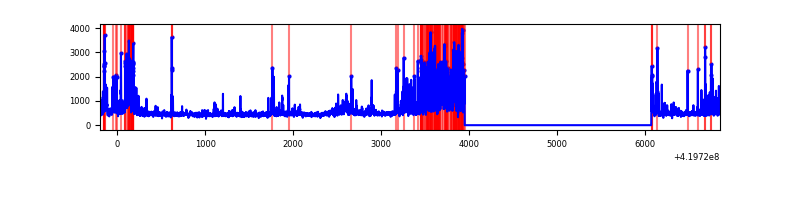 |
| C | 7050 | 4929 | 23 | 23 | 0.33% | 0.47% | 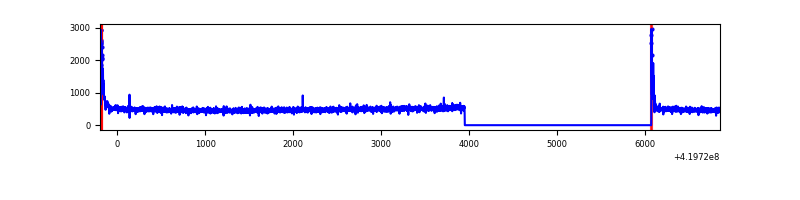 |
| D | 7050 | 4929 | 126 | 126 | 1.79% | 2.56% | 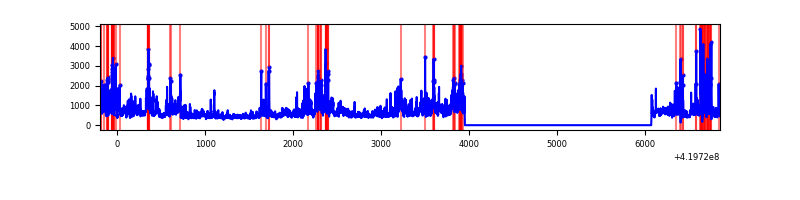 |
Top three noisy pixels from each quadrant. If the there are fewer than three noisy pixels in the level2.evt file, extra rows are filled as -1
| Pixel properties | Quadrant properties | ||||||
|---|---|---|---|---|---|---|---|
| Quadrant | DetID | PixID | Counts | Sigma | Mean | Median | Sigma |
| A | 10 | 83 | 475561 | 4167.71 | 557 | 547 | 114.0 |
| A | 2 | 79 | 90800 | 791.87 | 557 | 547 | 114.0 |
| A | 13 | 248 | 9507 | 78.61 | 557 | 547 | 114.0 |
| B | 4 | 171 | 713348 | 6718.0 | 550 | 534 | 106.1 |
| B | 5 | 255 | 380318 | 3579.32 | 550 | 534 | 106.1 |
| B | 0 | 183 | 25808 | 238.2 | 550 | 534 | 106.1 |
| C | 15 | 214 | 207334 | 1615.4 | 545 | 550 | 128.0 |
| C | 0 | 10 | 106018 | 823.92 | 545 | 550 | 128.0 |
| C | 5 | 10 | 8413 | 61.43 | 545 | 550 | 128.0 |
| D | 12 | 79 | 967682 | 7410.61 | 531 | 516 | 130.5 |
| D | 13 | 249 | 300973 | 2302.16 | 531 | 516 | 130.5 |
| D | 1 | 47 | 172980 | 1321.45 | 531 | 516 | 130.5 |
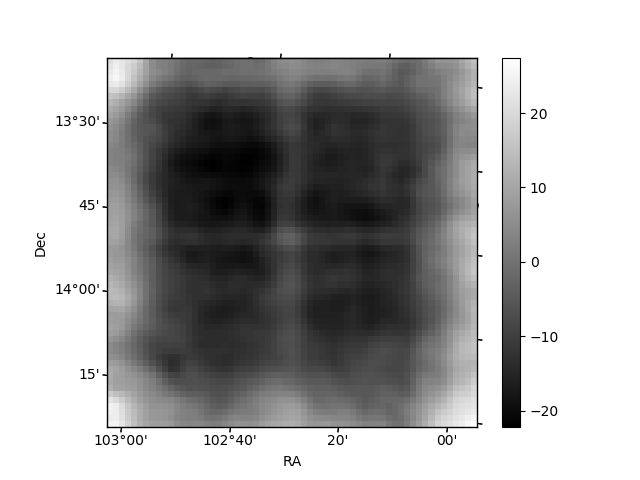
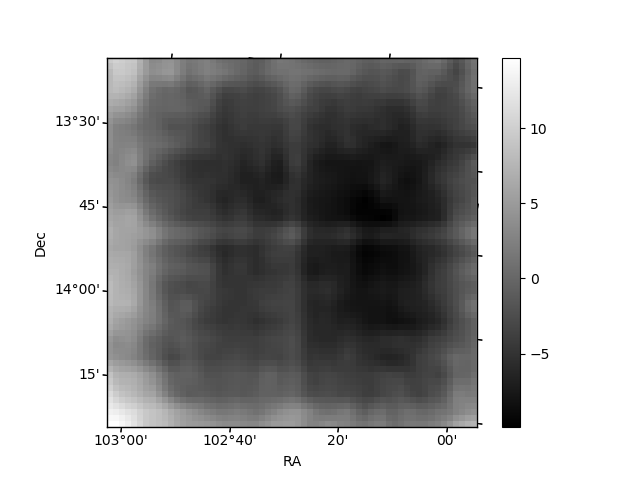
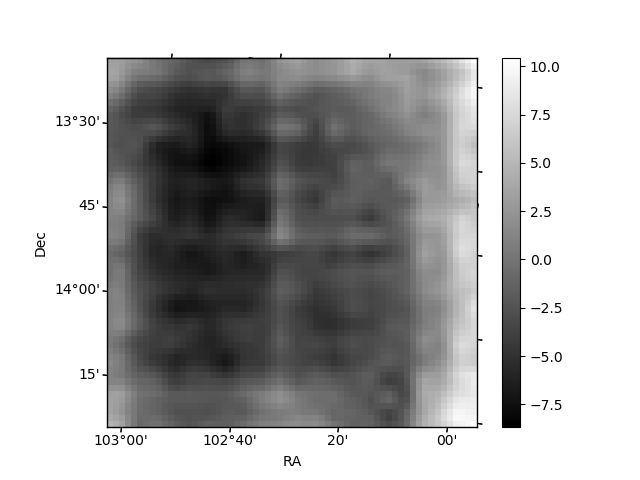
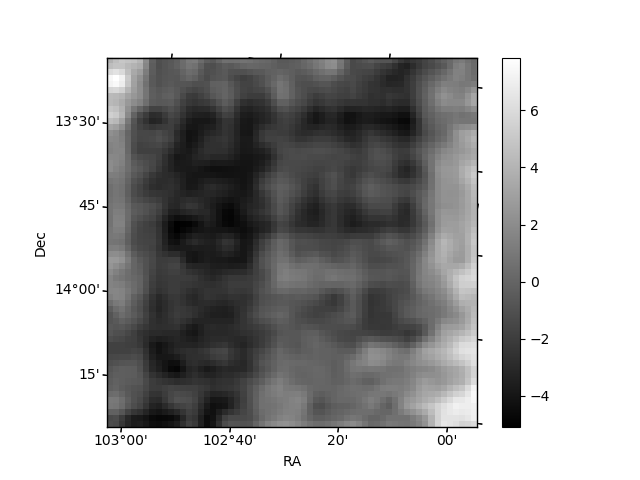
Histogram calculated using DETX and DETY for each event in the final _common_clean file
| Quadrant A | 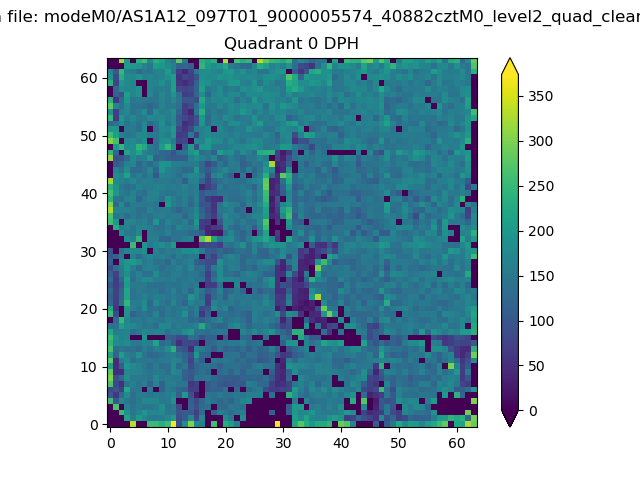 |
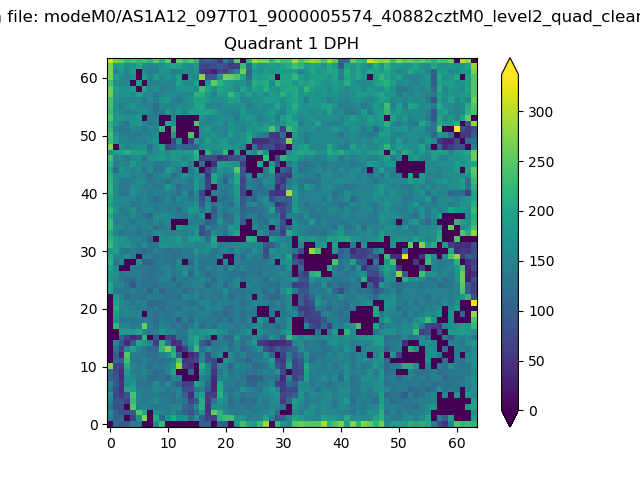 |
Quadrant B |
|---|---|---|---|
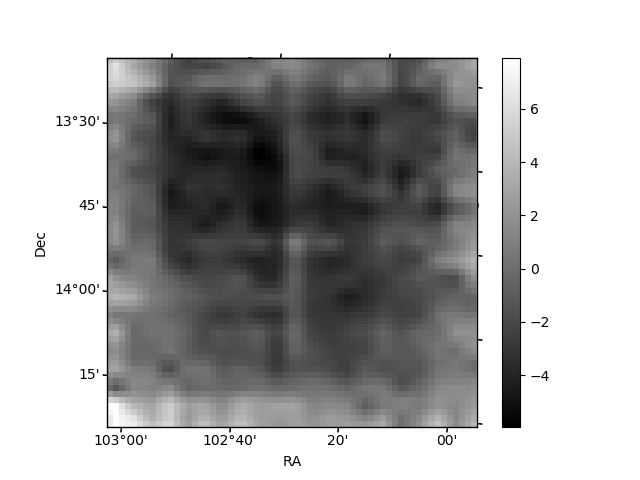
| Quadrant D | 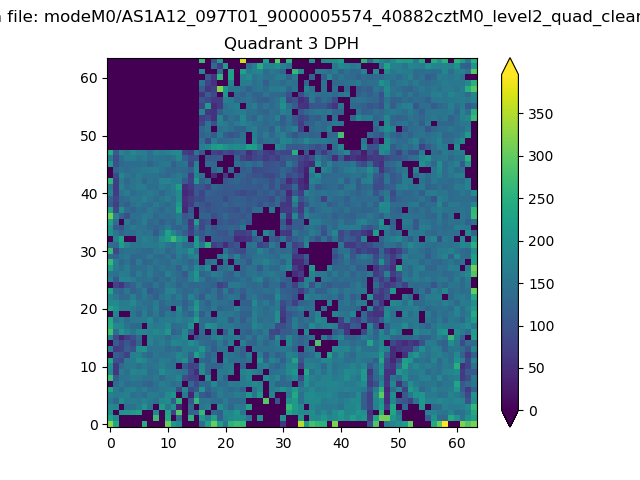 |
 |
Quadrant C |
| Plot type | Count rate plots | Images |
|---|---|---|
| Comparison with Poisson distribution Blue bars denote a histogram of data divided into 1 sec bins. Red curve is a Poisson curve with rate = median count rate of data. |
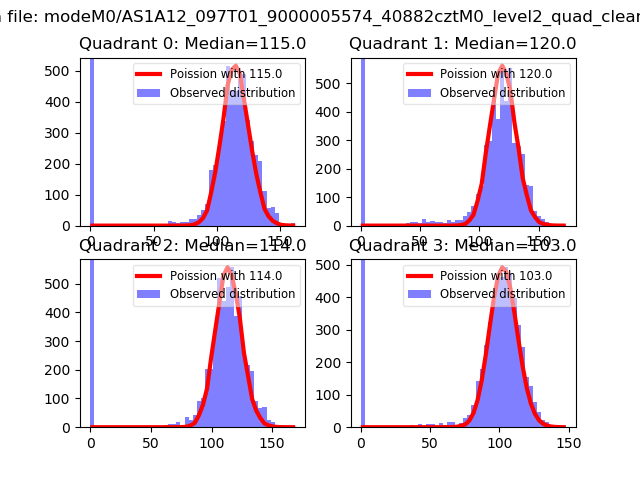 |
 |
| Quadrant-wise count rates Data is divided into 100 sec bins |
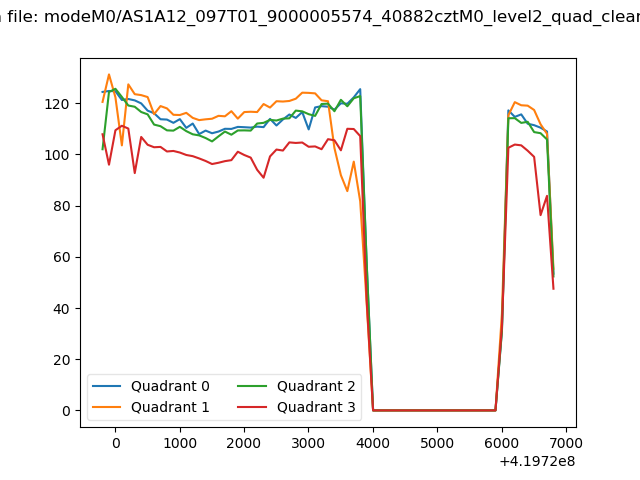 |
|
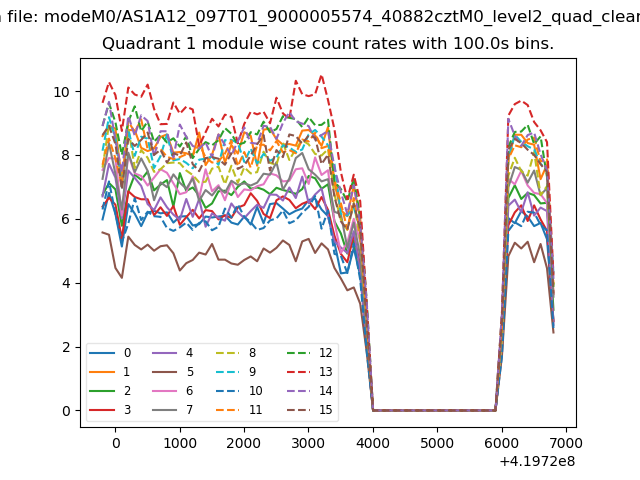
| Module-wise count rates for Quadrant A Data is divided into 100 sec bins |
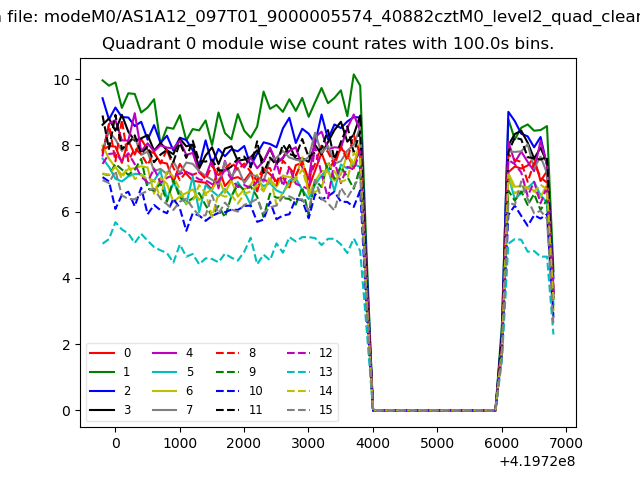 |
 |
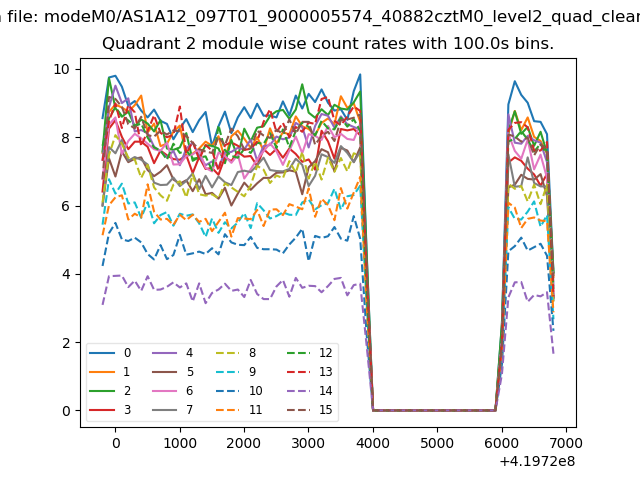
| Module-wise count rates for Quadrant B Data is divided into 100 sec bins |
 |
 |
| Module-wise count rates for Quadrant C Data is divided into 100 sec bins |
 |
 |
| Module-wise count rates for Quadrant D Data is divided into 100 sec bins |
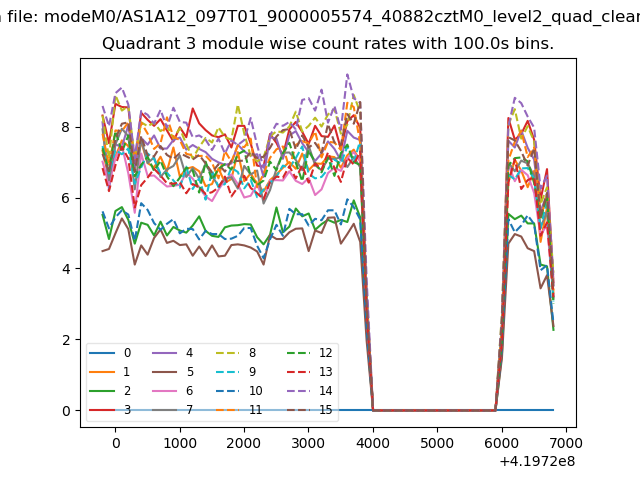 |
 |
| Parameter | Plot |
|---|---|
| CZT HV Monitor | 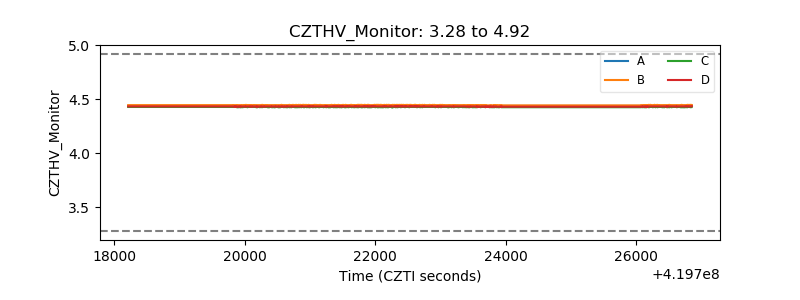 |
| D_VDD | 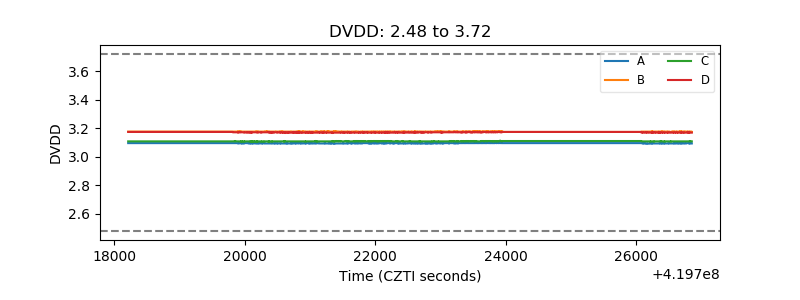 |
| Temperature 1 | 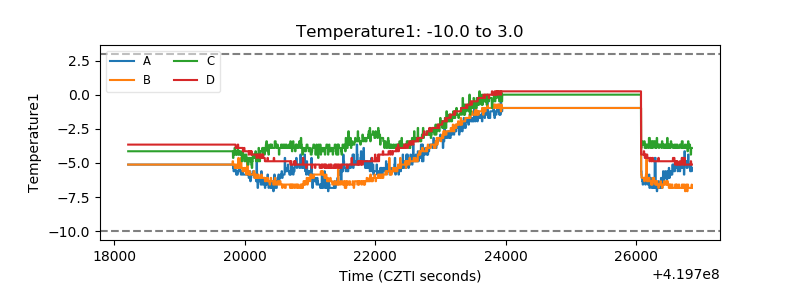 |
| Veto HV Monitor | 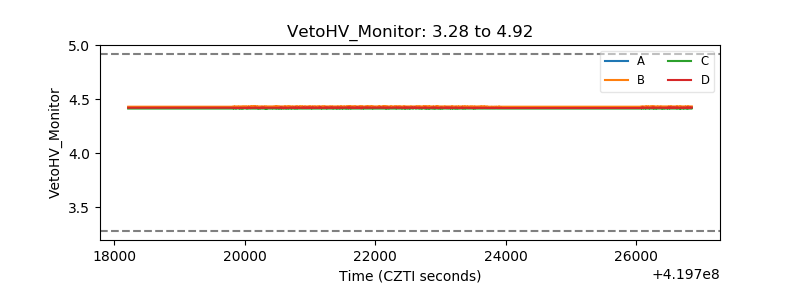 |
| Veto LLD | 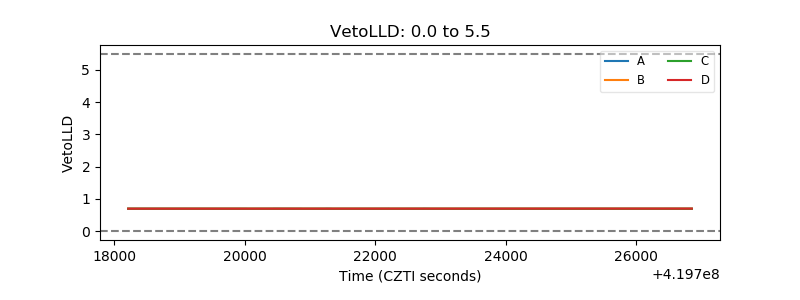 |
| Alpha Counter | 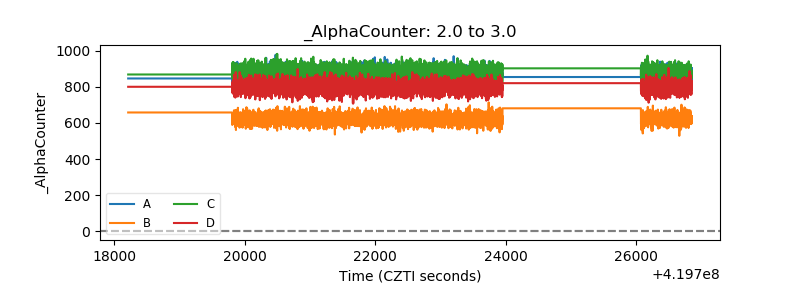 |
| _CPM_Rate | 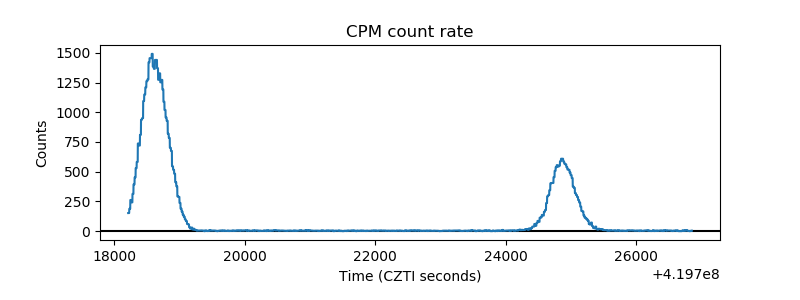 |
| CZT Counter | 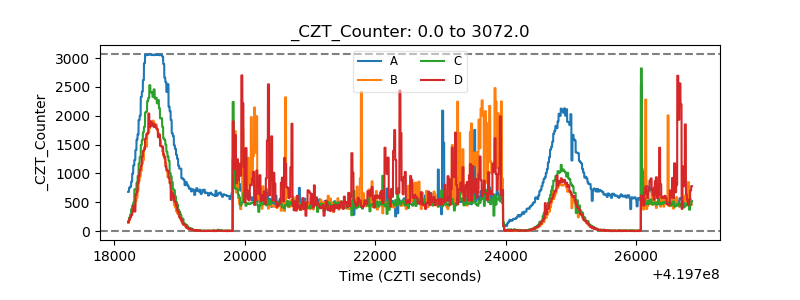 |
| +2.5 Volts monitor | 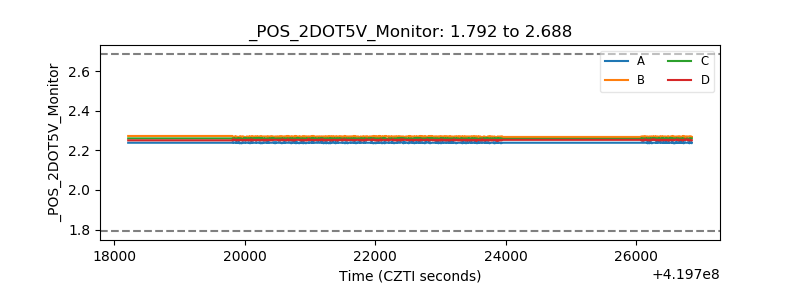 |
| +5 Volts monitor | 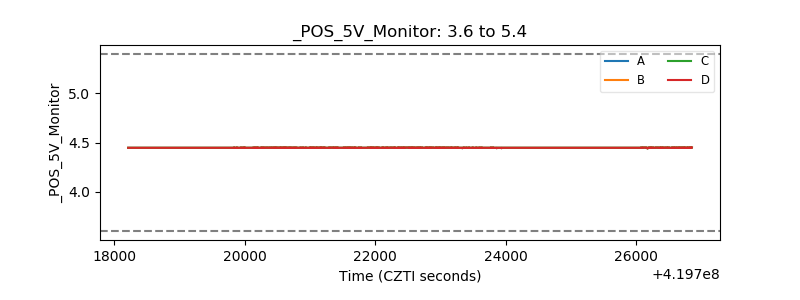 |
| _ROLL_ROT | 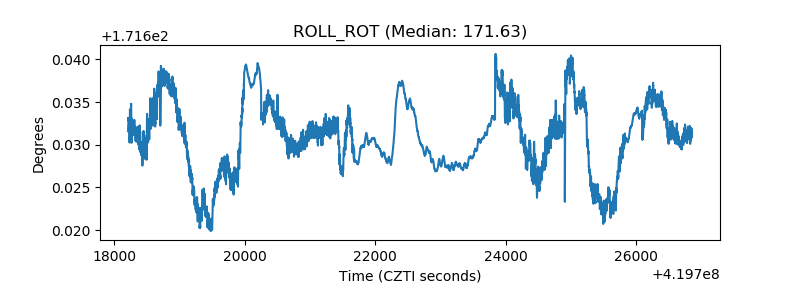 |
| _Roll_DEC | 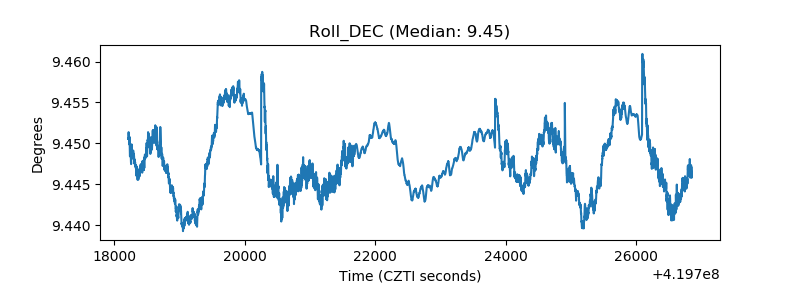 |
| _Roll_RA | 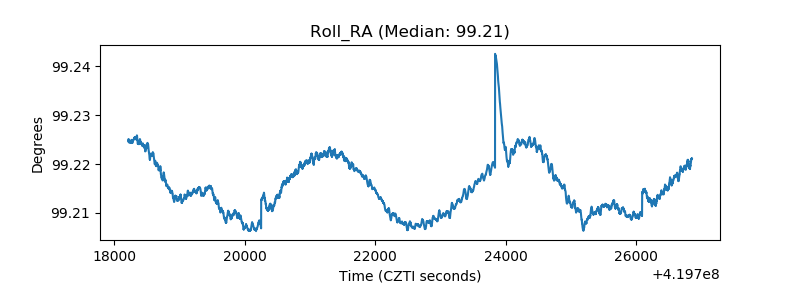 |
| Veto Counter | 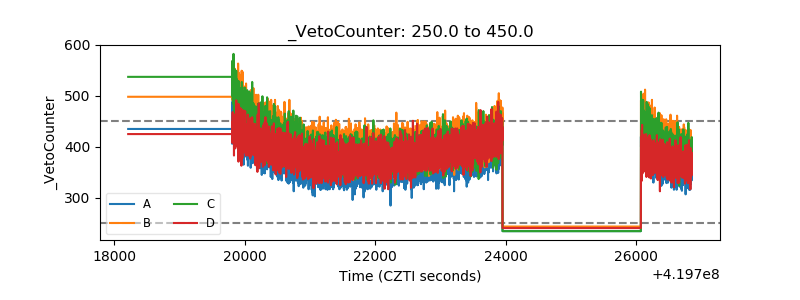 |