| Param | Original file | Final file |
|---|---|---|
| Filename | modeM0/AS1A12_097T01_9000005574_40883cztM0_level2.fits | modeM0/AS1A12_097T01_9000005574_40883cztM0_level2_quad_clean.evt |
| Size (bytes) | 364,956,480 | 82,733,760 |
| Size | 348.0 MB | 78.9 MB |
| Events in quadrant A | 2,889,191 | 558,543 |
| Events in quadrant B | 4,104,198 | 549,564 |
| Events in quadrant C | 2,552,804 | 555,071 |
| Events in quadrant D | 3,569,707 | 487,263 |
| Mode M9 | |||
|---|---|---|---|
| Quadrant | BADHDUFLAG | Total packets | Discarded packets |
| A | 0 | 33 | 0 |
| B | 0 | 33 | 0 |
| C | 0 | 33 | 0 |
| D | 0 | 34 | 0 |
| Mode SS | |||
|---|---|---|---|
| Quadrant | BADHDUFLAG | Total packets | Discarded packets |
| A | 0 | 104 | 0 |
| B | 0 | 104 | 0 |
| C | 0 | 104 | 0 |
| D | 0 | 104 | 0 |
| Mode M0 | |||
|---|---|---|---|
| Quadrant | BADHDUFLAG | Total packets | Discarded packets |
| A | 0 | 11578 | 3 |
| B | 0 | 15557 | 2 |
| C | 0 | 10713 | 2 |
| D | 0 | 14031 | 2 |
| Quadrant | Total seconds | Saturated seconds | Saturation percentage |
|---|---|---|---|
| A | 5057 | 22 | 0.435041% |
| B | 5057 | 435 | 8.601938% |
| C | 5057 | 12 | 0.237295% |
| D | 5057 | 227 | 4.488827% |
Noise dominated data is calculated using 1-second bins in cleaned event files. If a bin has >2000 counts, and if more than 50% of those come from <1% of pixels, then it is considered to be noise-dominated and hence unusable.
| Quadrant | # 1 sec bins | Bins with >0 counts | Bins with >2000 counts | High rate bins dominated by noise | Noise dominated (total time) | Noise dominated (detector-on time) | Marked lightcurve |
|---|---|---|---|---|---|---|---|
| A | 7059 | 5058 | 14 | 14 | 0.20% | 0.28% | 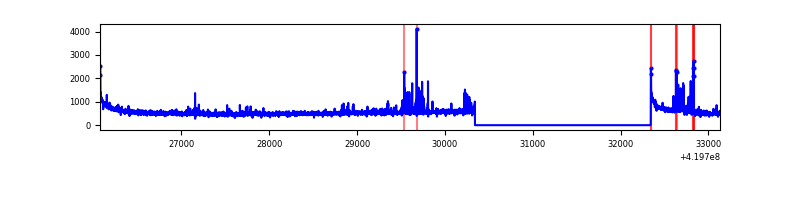 |
| B | 7059 | 5058 | 235 | 235 | 3.33% | 4.65% | 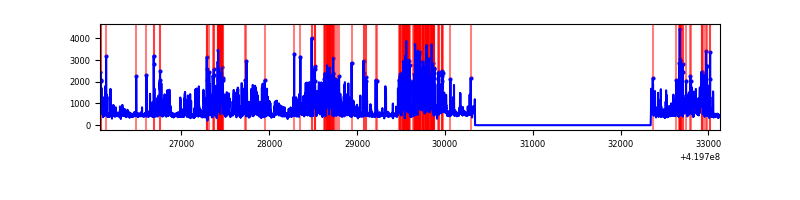 |
| C | 7059 | 5058 | 10 | 10 | 0.14% | 0.20% | 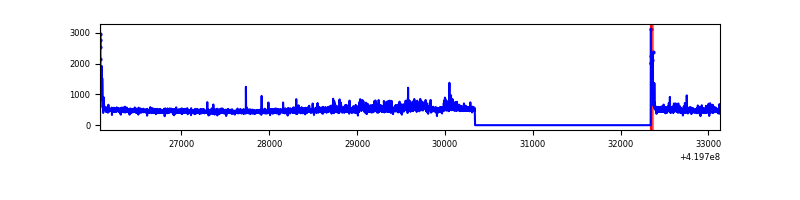 |
| D | 7059 | 5058 | 168 | 168 | 2.38% | 3.32% | 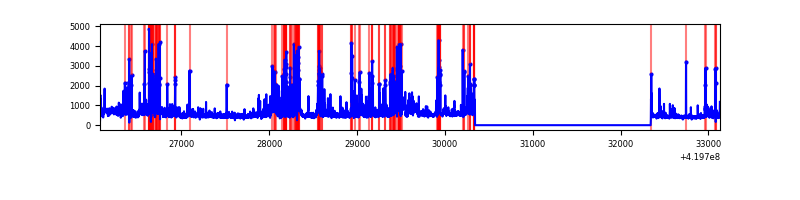 |
Top three noisy pixels from each quadrant. If the there are fewer than three noisy pixels in the level2.evt file, extra rows are filled as -1
| Pixel properties | Quadrant properties | ||||||
|---|---|---|---|---|---|---|---|
| Quadrant | DetID | PixID | Counts | Sigma | Mean | Median | Sigma |
| A | 10 | 83 | 492936 | 4240.08 | 564 | 553 | 116.1 |
| A | 13 | 248 | 118076 | 1012.03 | 564 | 553 | 116.1 |
| A | 2 | 79 | 71633 | 612.09 | 564 | 553 | 116.1 |
| B | 4 | 171 | 1327036 | 12411.68 | 549 | 535 | 106.9 |
| B | 5 | 255 | 543667 | 5081.92 | 549 | 535 | 106.9 |
| B | 0 | 230 | 14724 | 132.76 | 549 | 535 | 106.9 |
| C | 15 | 214 | 211831 | 1641.26 | 551 | 554 | 128.7 |
| C | 5 | 10 | 118918 | 919.48 | 551 | 554 | 128.7 |
| C | 0 | 10 | 60997 | 469.54 | 551 | 554 | 128.7 |
| D | 13 | 249 | 651100 | 4951.68 | 536 | 522 | 131.4 |
| D | 12 | 79 | 274399 | 2084.53 | 536 | 522 | 131.4 |
| D | 2 | 249 | 177083 | 1343.84 | 536 | 522 | 131.4 |
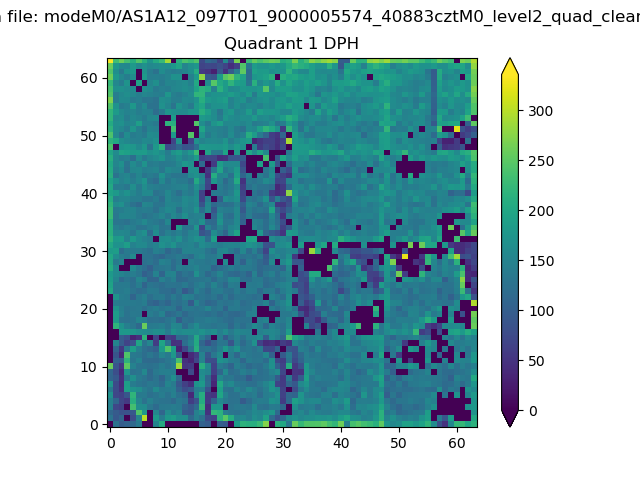
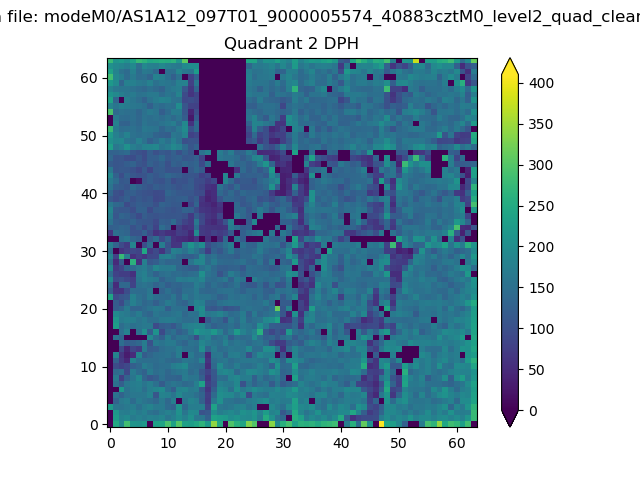
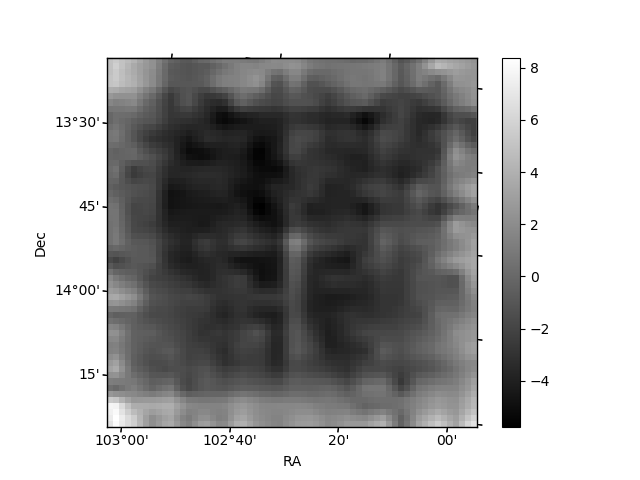
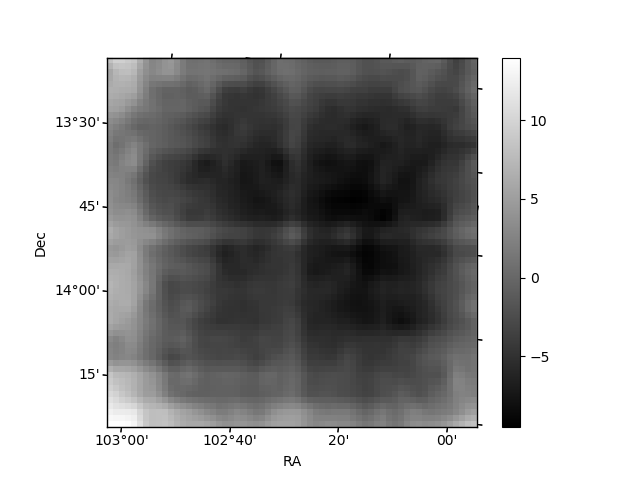
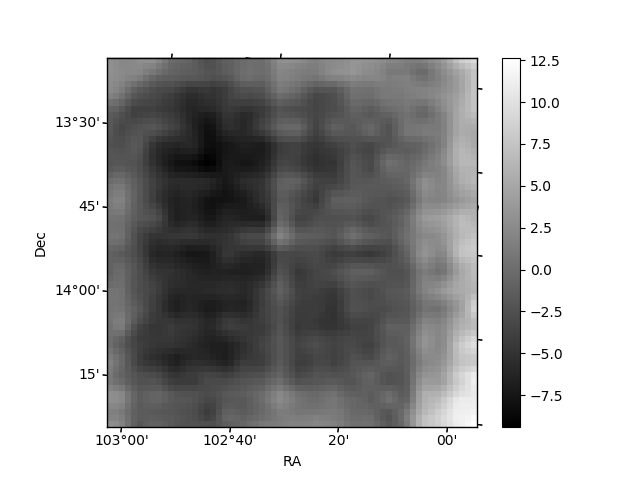
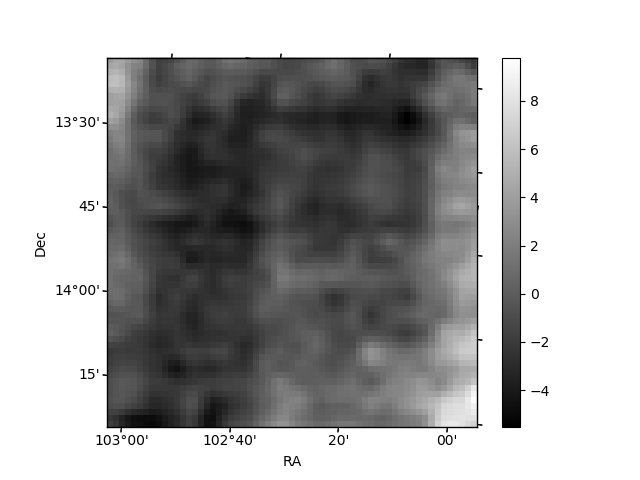
Histogram calculated using DETX and DETY for each event in the final _common_clean file
| Quadrant A |  |
 |
Quadrant B |
|---|---|---|---|
| Quadrant D | 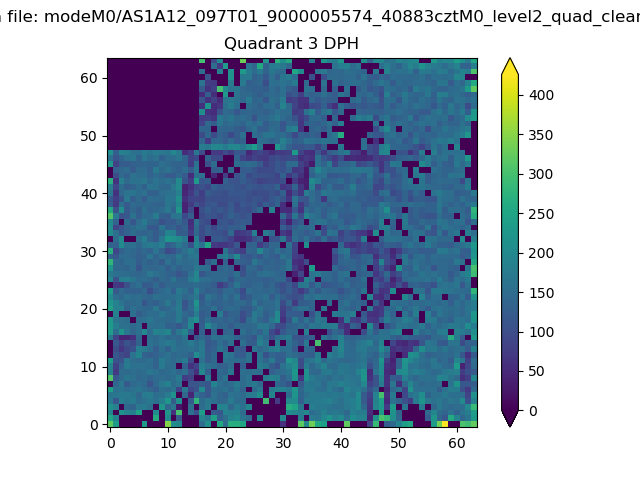 |
 |
Quadrant C |
| Plot type | Count rate plots | Images |
|---|---|---|
| Comparison with Poisson distribution Blue bars denote a histogram of data divided into 1 sec bins. Red curve is a Poisson curve with rate = median count rate of data. |
 |
 |
| Quadrant-wise count rates Data is divided into 100 sec bins |
 |
|
| Module-wise count rates for Quadrant A Data is divided into 100 sec bins |
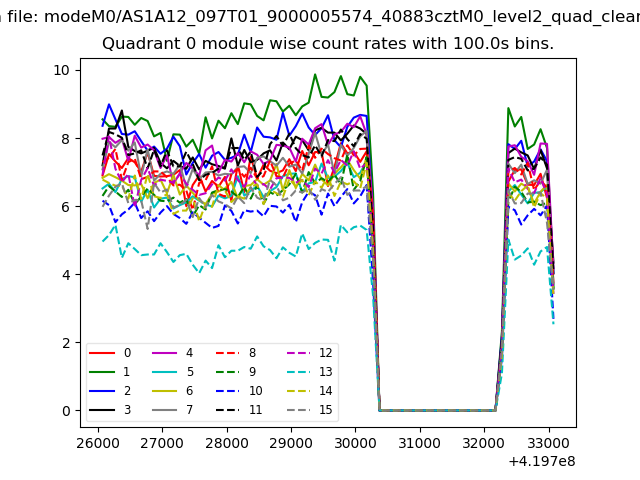 |
 |
| Module-wise count rates for Quadrant B Data is divided into 100 sec bins |
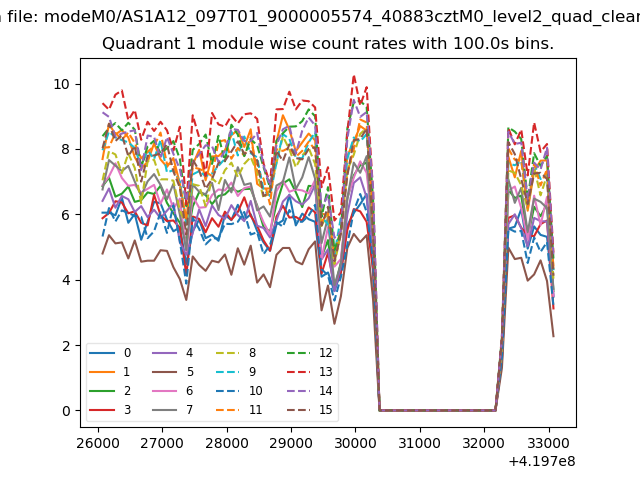 |
 |
| Module-wise count rates for Quadrant C Data is divided into 100 sec bins |
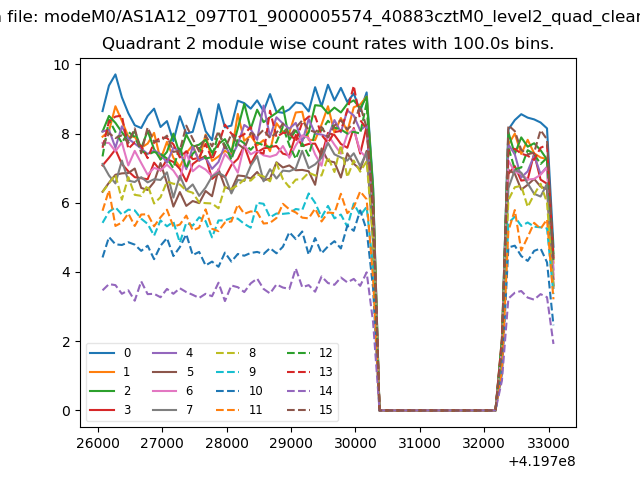 |
 |
| Module-wise count rates for Quadrant D Data is divided into 100 sec bins |
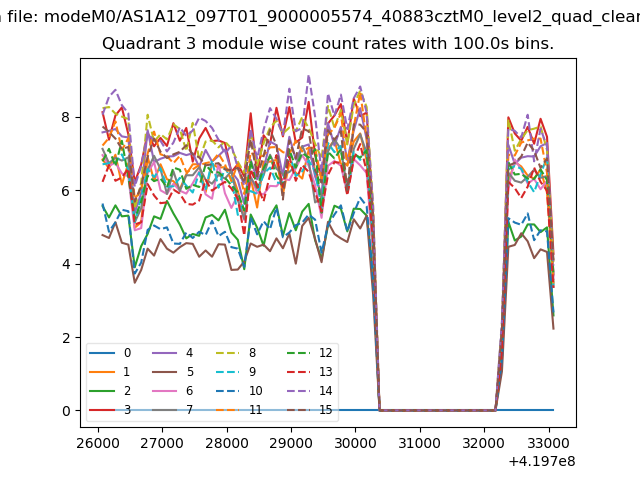 |
 |
| Parameter | Plot |
|---|---|
| CZT HV Monitor | 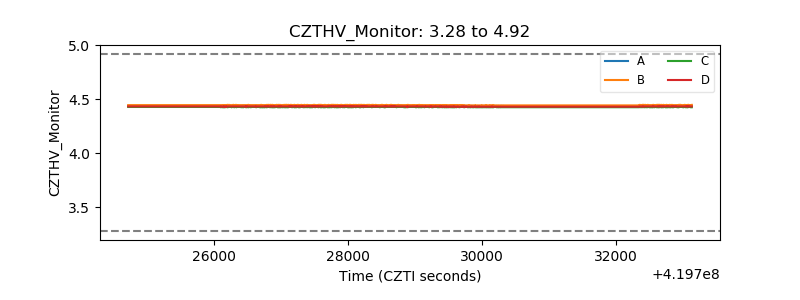 |
| D_VDD | 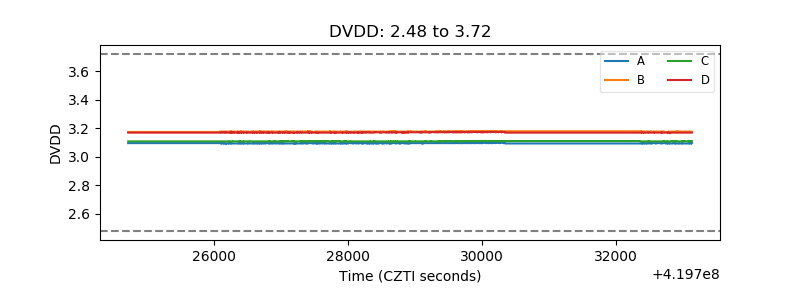 |
| Temperature 1 | 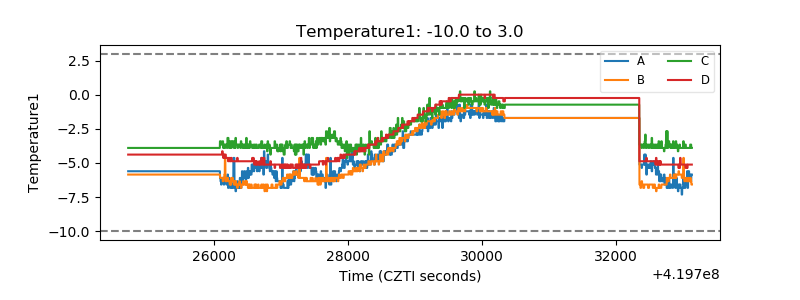 |
| Veto HV Monitor | 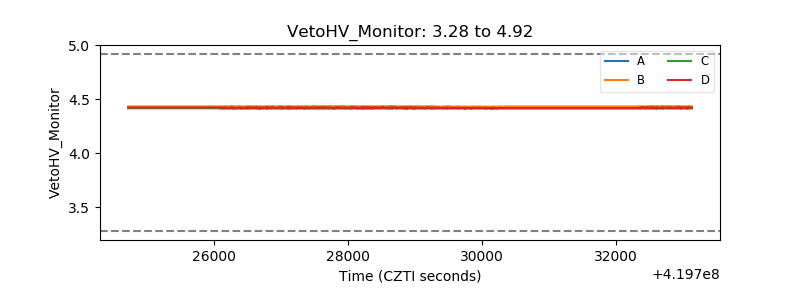 |
| Veto LLD | 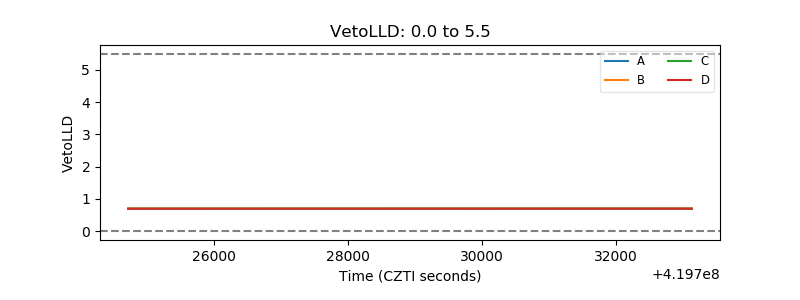 |
| Alpha Counter | 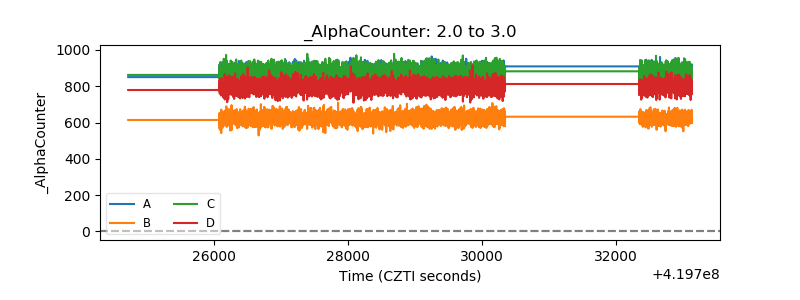 |
| _CPM_Rate | 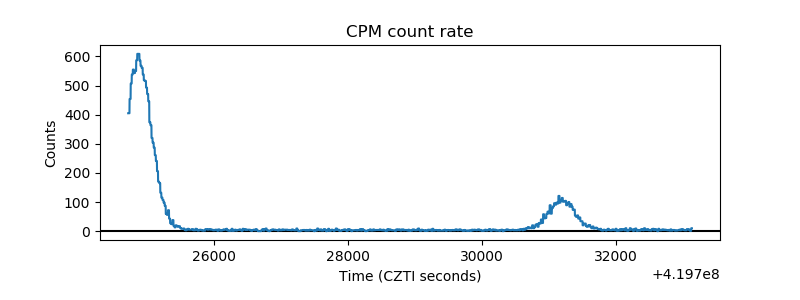 |
| CZT Counter | 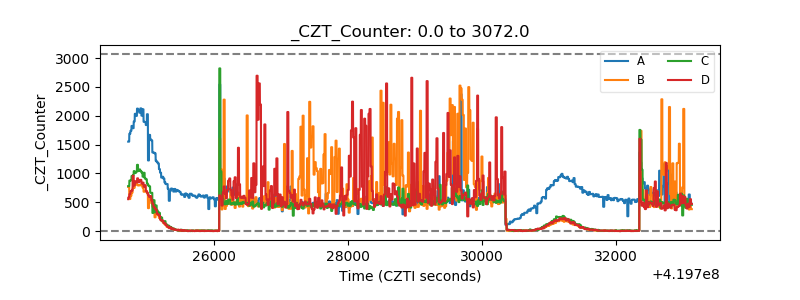 |
| +2.5 Volts monitor |  |
| +5 Volts monitor | 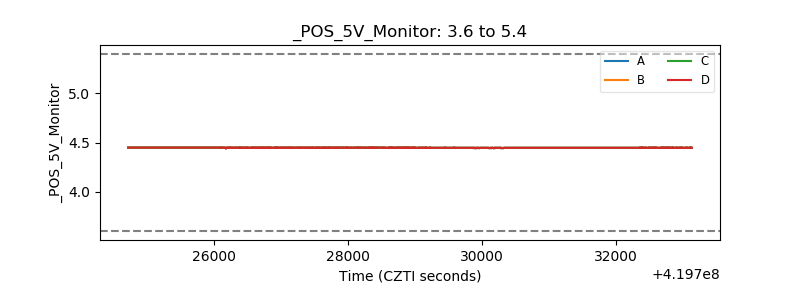 |
| _ROLL_ROT | 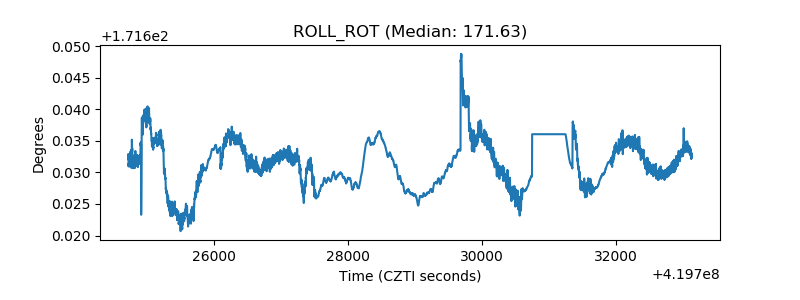 |
| _Roll_DEC |  |
| _Roll_RA | 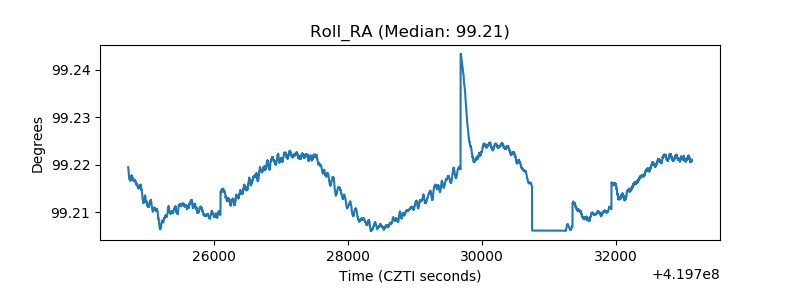 |
| Veto Counter | 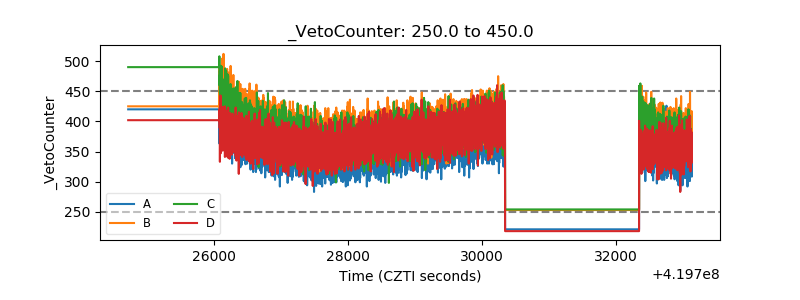 |