| Param | Original file | Final file |
|---|---|---|
| Filename | modeM0/AS1A12_097T01_9000005574_40884cztM0_level2.fits | modeM0/AS1A12_097T01_9000005574_40884cztM0_level2_quad_clean.evt |
| Size (bytes) | 382,671,360 | 87,701,760 |
| Size | 364.9 MB | 83.6 MB |
| Events in quadrant A | 3,076,087 | 589,145 |
| Events in quadrant B | 4,422,539 | 574,992 |
| Events in quadrant C | 2,666,363 | 585,870 |
| Events in quadrant D | 3,574,629 | 522,628 |
| Mode M9 | |||
|---|---|---|---|
| Quadrant | BADHDUFLAG | Total packets | Discarded packets |
| A | 0 | 27 | 0 |
| B | 0 | 27 | 0 |
| C | 0 | 27 | 0 |
| D | 0 | 28 | 0 |
| Mode SS | |||
|---|---|---|---|
| Quadrant | BADHDUFLAG | Total packets | Discarded packets |
| A | 0 | 112 | 0 |
| B | 0 | 112 | 0 |
| C | 0 | 112 | 0 |
| D | 0 | 112 | 0 |
| Mode M0 | |||
|---|---|---|---|
| Quadrant | BADHDUFLAG | Total packets | Discarded packets |
| A | 0 | 12400 | 3 |
| B | 0 | 16852 | 2 |
| C | 0 | 11265 | 2 |
| D | 0 | 14406 | 2 |
| Quadrant | Total seconds | Saturated seconds | Saturation percentage |
|---|---|---|---|
| A | 5468 | 17 | 0.310900% |
| B | 5468 | 501 | 9.162399% |
| C | 5468 | 18 | 0.329188% |
| D | 5468 | 156 | 2.852963% |
Noise dominated data is calculated using 1-second bins in cleaned event files. If a bin has >2000 counts, and if more than 50% of those come from <1% of pixels, then it is considered to be noise-dominated and hence unusable.
| Quadrant | # 1 sec bins | Bins with >0 counts | Bins with >2000 counts | High rate bins dominated by noise | Noise dominated (total time) | Noise dominated (detector-on time) | Marked lightcurve |
|---|---|---|---|---|---|---|---|
| A | 7170 | 5469 | 13 | 13 | 0.18% | 0.24% | 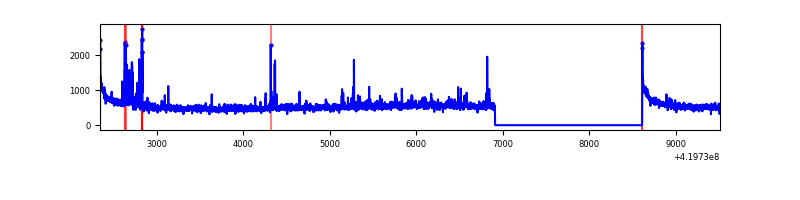 |
| B | 7170 | 5469 | 278 | 278 | 3.88% | 5.08% | 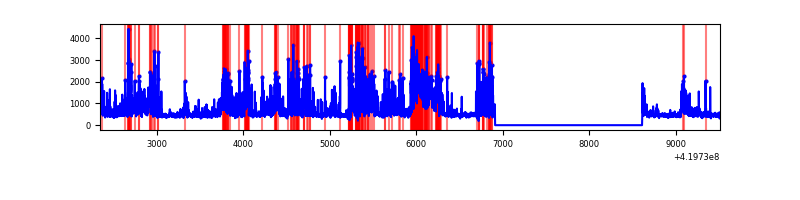 |
| C | 7170 | 5469 | 11 | 11 | 0.15% | 0.20% | 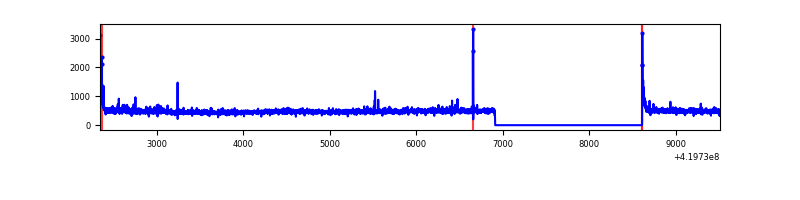 |
| D | 7170 | 5469 | 107 | 107 | 1.49% | 1.96% | 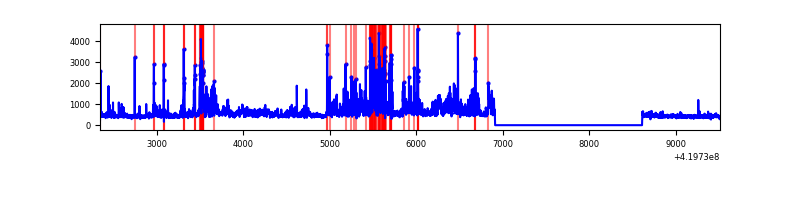 |
Top three noisy pixels from each quadrant. If the there are fewer than three noisy pixels in the level2.evt file, extra rows are filled as -1
| Pixel properties | Quadrant properties | ||||||
|---|---|---|---|---|---|---|---|
| Quadrant | DetID | PixID | Counts | Sigma | Mean | Median | Sigma |
| A | 10 | 83 | 532484 | 4274.55 | 601 | 587 | 124.4 |
| A | 13 | 248 | 106654 | 852.4 | 601 | 587 | 124.4 |
| A | 12 | 189 | 74422 | 593.37 | 601 | 587 | 124.4 |
| B | 4 | 171 | 1822705 | 15987.66 | 585 | 569 | 114.0 |
| B | 5 | 255 | 221511 | 1938.57 | 585 | 569 | 114.0 |
| B | 0 | 230 | 15523 | 131.21 | 585 | 569 | 114.0 |
| C | 15 | 214 | 235847 | 1692.5 | 590 | 592 | 139.0 |
| C | 0 | 10 | 56735 | 403.91 | 590 | 592 | 139.0 |
| C | 5 | 10 | 23969 | 168.18 | 590 | 592 | 139.0 |
| D | 12 | 79 | 471527 | 3286.06 | 579 | 562 | 143.3 |
| D | 13 | 249 | 226035 | 1573.19 | 579 | 562 | 143.3 |
| D | 2 | 249 | 214844 | 1495.11 | 579 | 562 | 143.3 |
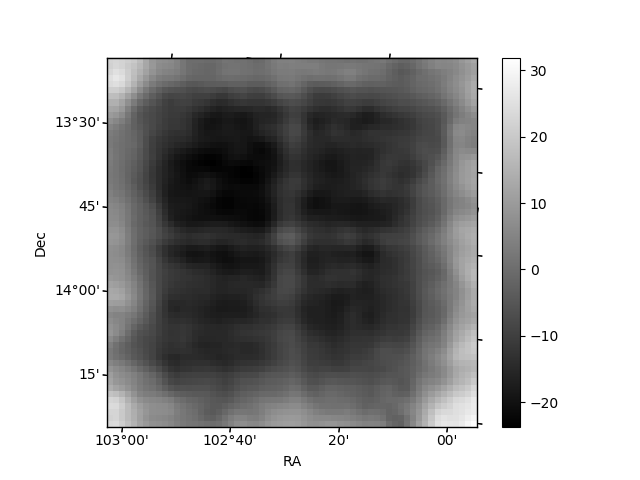
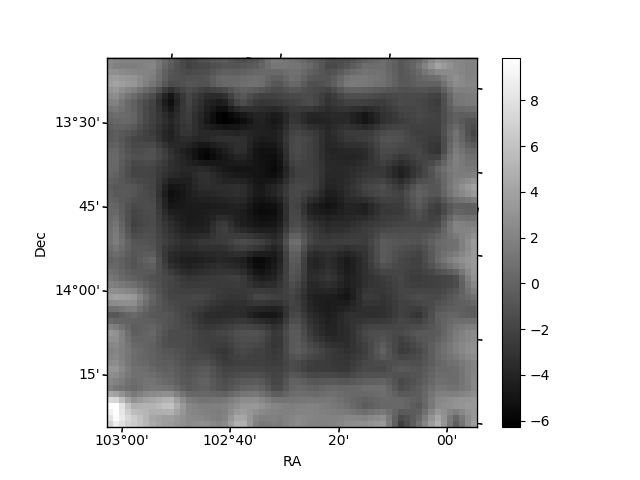
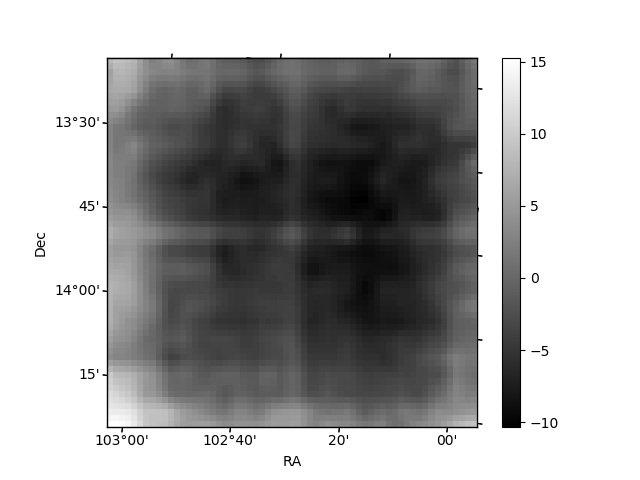
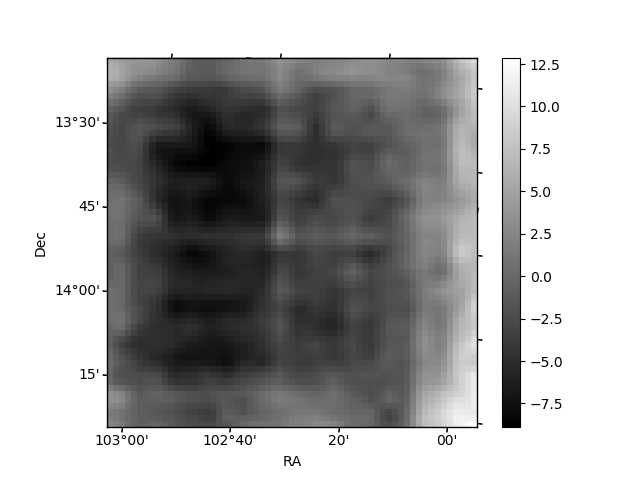
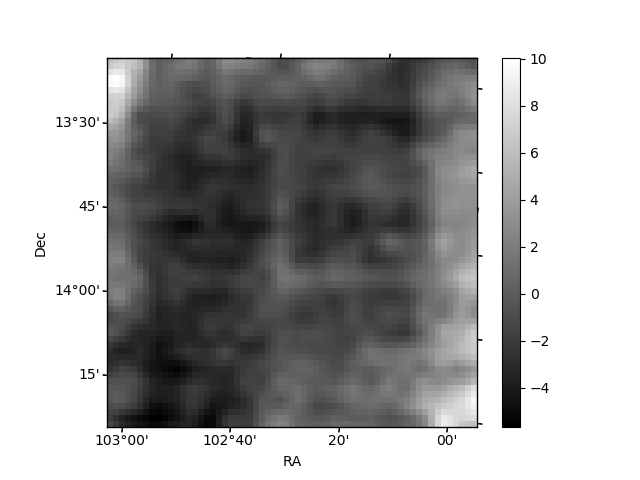
Histogram calculated using DETX and DETY for each event in the final _common_clean file
| Quadrant A | 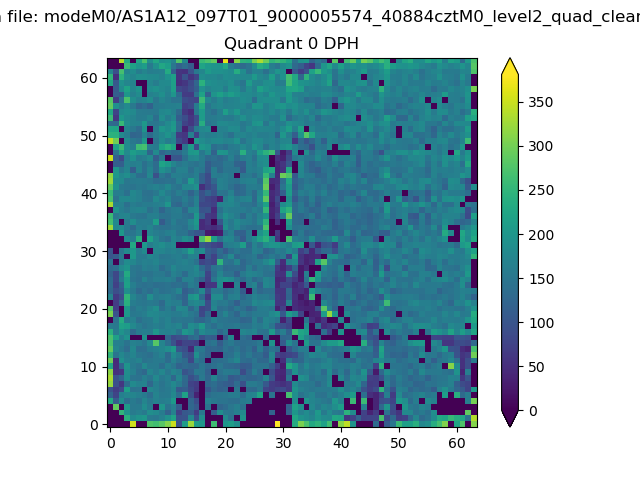 |
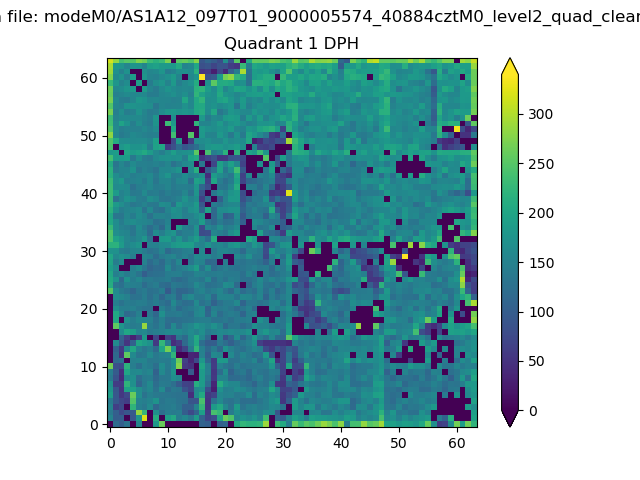 |
Quadrant B |
|---|---|---|---|
| Quadrant D | 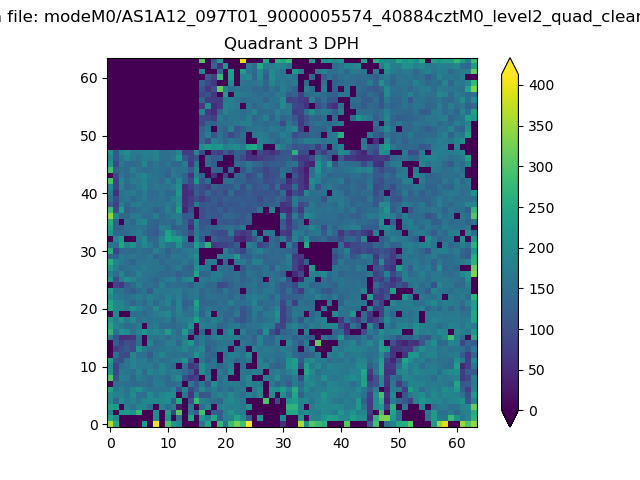 |
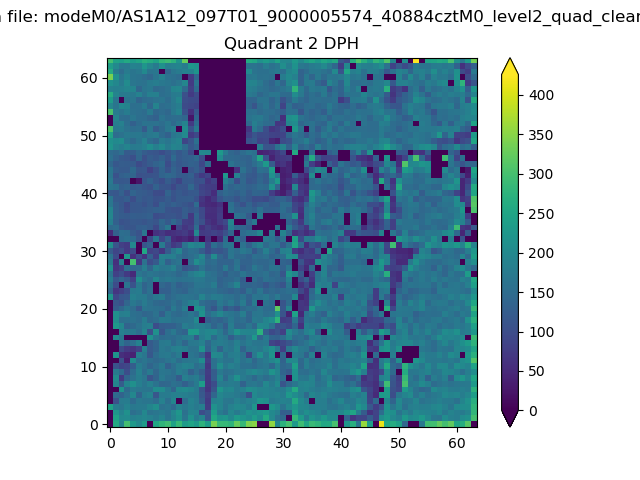 |
Quadrant C |
| Plot type | Count rate plots | Images |
|---|---|---|
| Comparison with Poisson distribution Blue bars denote a histogram of data divided into 1 sec bins. Red curve is a Poisson curve with rate = median count rate of data. |
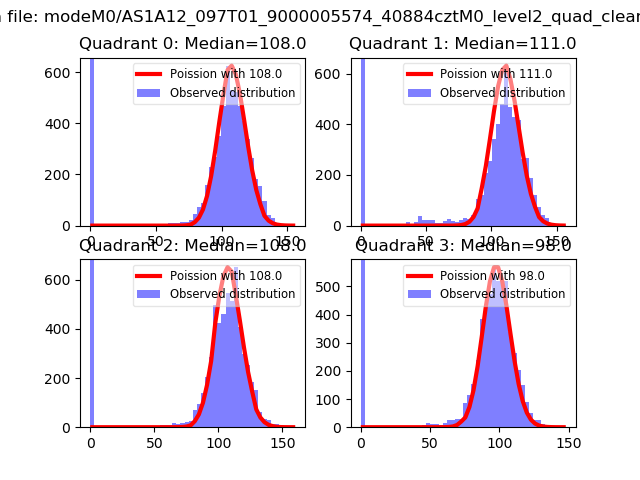 |
 |
| Quadrant-wise count rates Data is divided into 100 sec bins |
 |
|
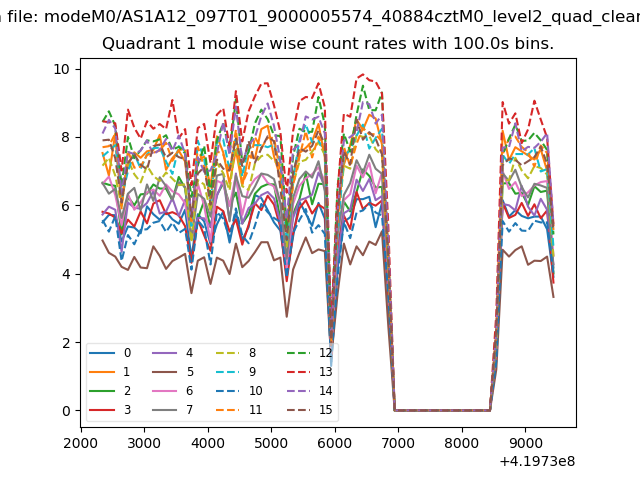
| Module-wise count rates for Quadrant A Data is divided into 100 sec bins |
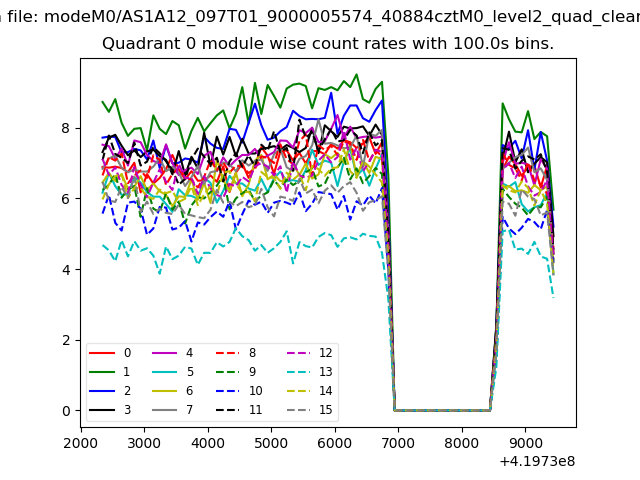 |
 |
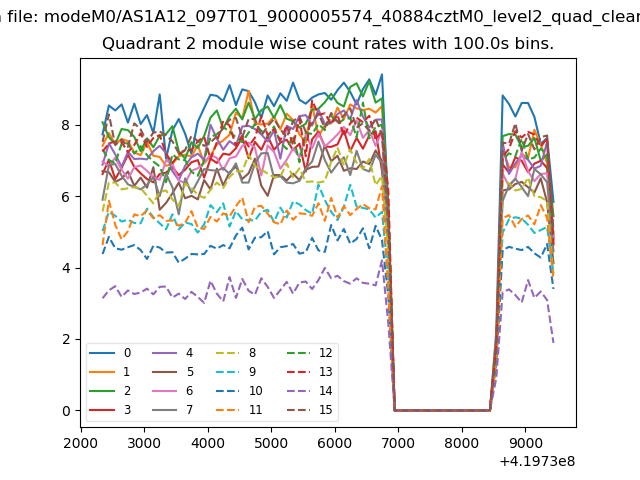
| Module-wise count rates for Quadrant B Data is divided into 100 sec bins |
 |
 |
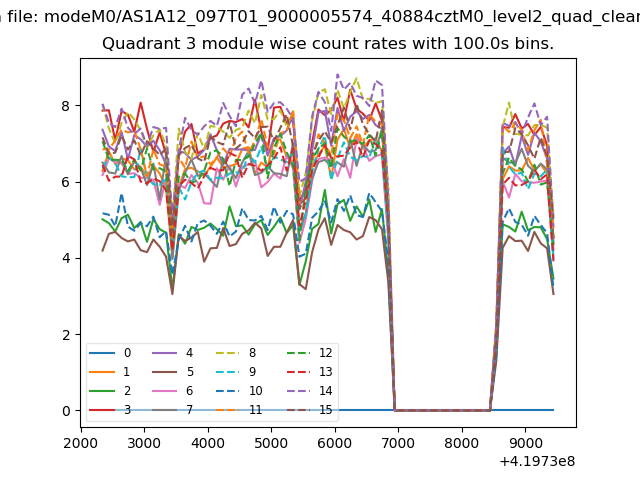
| Module-wise count rates for Quadrant C Data is divided into 100 sec bins |
 |
 |
| Module-wise count rates for Quadrant D Data is divided into 100 sec bins |
 |
 |
| Parameter | Plot |
|---|---|
| CZT HV Monitor |  |
| D_VDD | 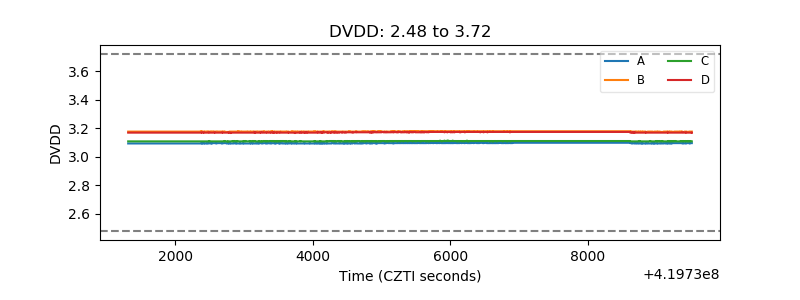 |
| Temperature 1 | 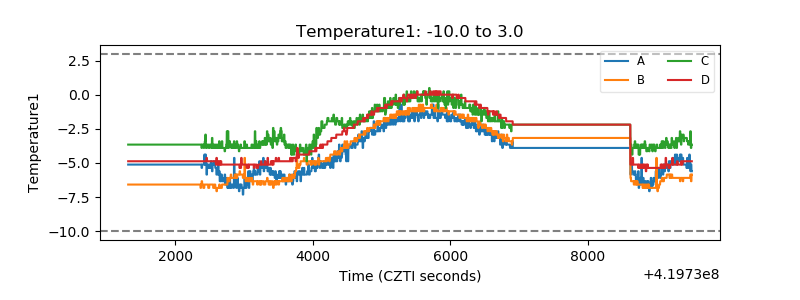 |
| Veto HV Monitor | 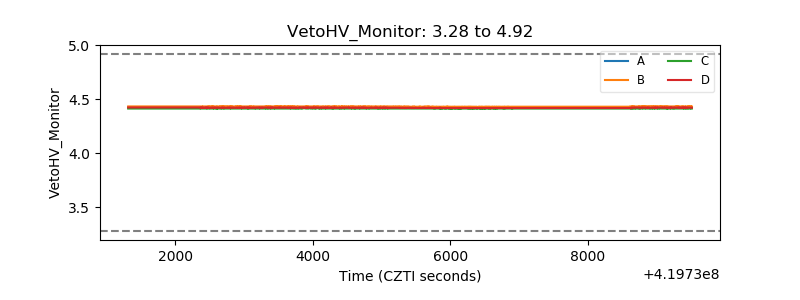 |
| Veto LLD | 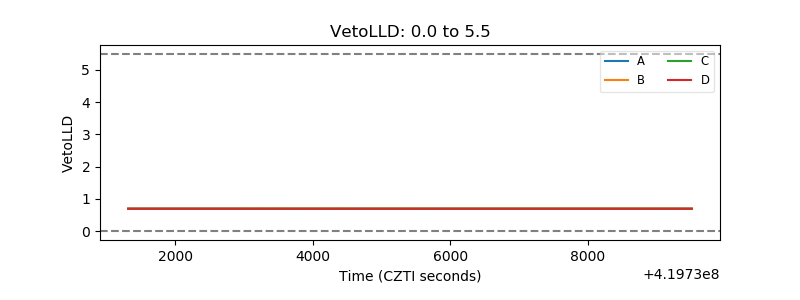 |
| Alpha Counter | 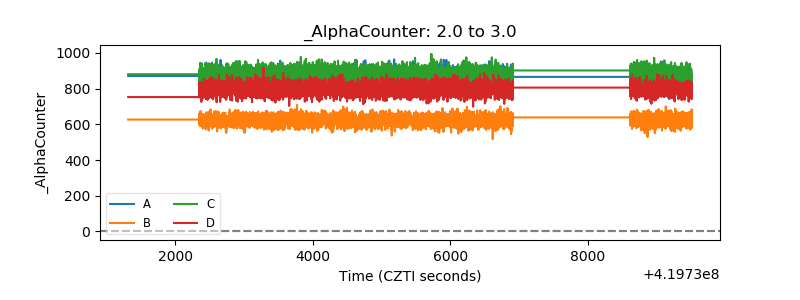 |
| _CPM_Rate | 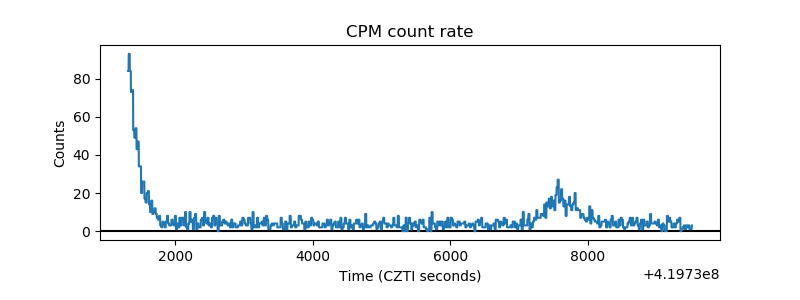 |
| CZT Counter | 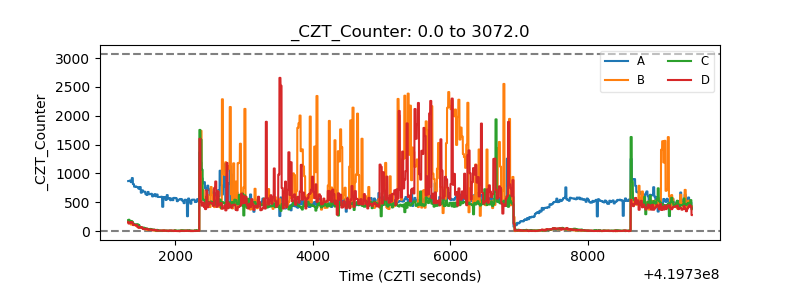 |
| +2.5 Volts monitor |  |
| +5 Volts monitor | 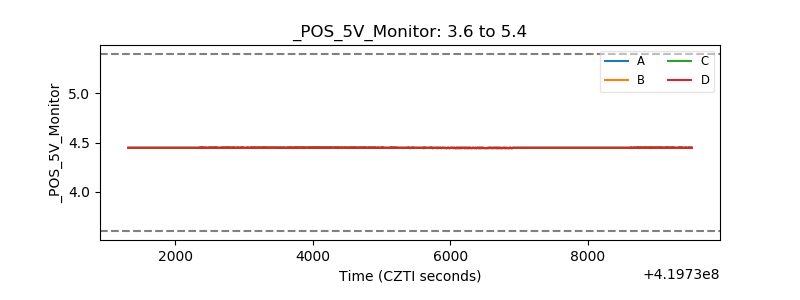 |
| _ROLL_ROT | 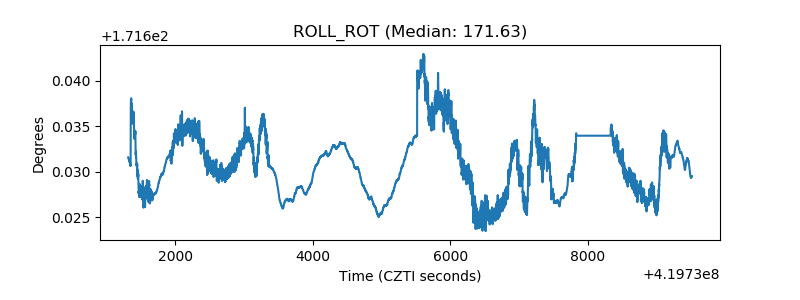 |
| _Roll_DEC |  |
| _Roll_RA | 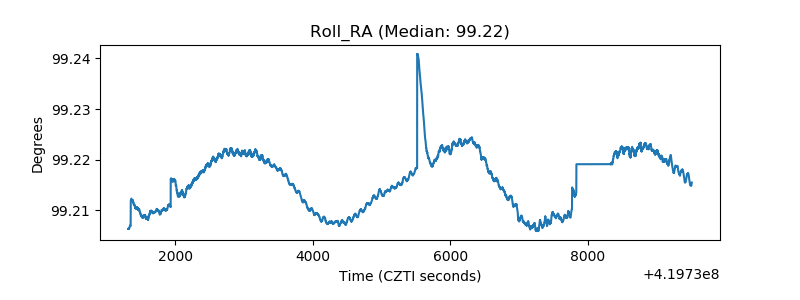 |
| Veto Counter | 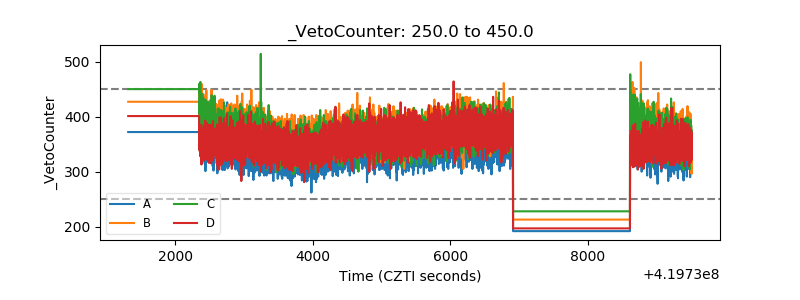 |