| Param | Original file | Final file |
|---|---|---|
| Filename | modeM0/AS1A12_097T01_9000005574_40885cztM0_level2.fits | modeM0/AS1A12_097T01_9000005574_40885cztM0_level2_quad_clean.evt |
| Size (bytes) | 372,672,000 | 92,756,160 |
| Size | 355.4 MB | 88.5 MB |
| Events in quadrant A | 3,174,931 | 616,920 |
| Events in quadrant B | 3,643,404 | 631,593 |
| Events in quadrant C | 2,773,860 | 613,339 |
| Events in quadrant D | 3,755,880 | 545,170 |
| Mode M9 | |||
|---|---|---|---|
| Quadrant | BADHDUFLAG | Total packets | Discarded packets |
| A | 0 | 16 | 0 |
| B | 0 | 16 | 0 |
| C | 0 | 16 | 0 |
| D | 0 | 17 | 0 |
| Mode SS | |||
|---|---|---|---|
| Quadrant | BADHDUFLAG | Total packets | Discarded packets |
| A | 0 | 116 | 0 |
| B | 0 | 116 | 0 |
| C | 0 | 116 | 0 |
| D | 0 | 116 | 0 |
| Mode M0 | |||
|---|---|---|---|
| Quadrant | BADHDUFLAG | Total packets | Discarded packets |
| A | 0 | 12786 | 3 |
| B | 0 | 14652 | 2 |
| C | 0 | 11739 | 2 |
| D | 0 | 15062 | 2 |
| Quadrant | Total seconds | Saturated seconds | Saturation percentage |
|---|---|---|---|
| A | 5746 | 9 | 0.156631% |
| B | 5746 | 191 | 3.324052% |
| C | 5746 | 15 | 0.261051% |
| D | 5746 | 187 | 3.254438% |
Noise dominated data is calculated using 1-second bins in cleaned event files. If a bin has >2000 counts, and if more than 50% of those come from <1% of pixels, then it is considered to be noise-dominated and hence unusable.
| Quadrant | # 1 sec bins | Bins with >0 counts | Bins with >2000 counts | High rate bins dominated by noise | Noise dominated (total time) | Noise dominated (detector-on time) | Marked lightcurve |
|---|---|---|---|---|---|---|---|
| A | 7119 | 5747 | 5 | 5 | 0.07% | 0.09% | 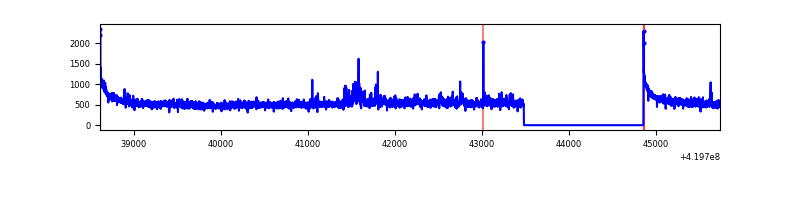 |
| B | 7119 | 5747 | 111 | 111 | 1.56% | 1.93% | 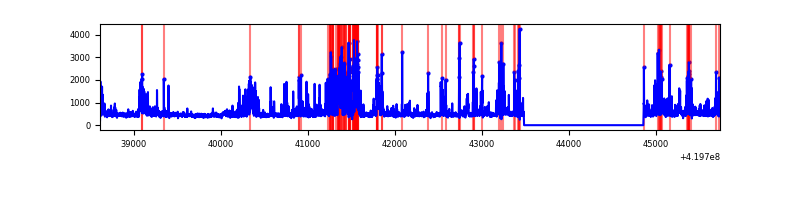 |
| C | 7119 | 5747 | 5 | 5 | 0.07% | 0.09% | 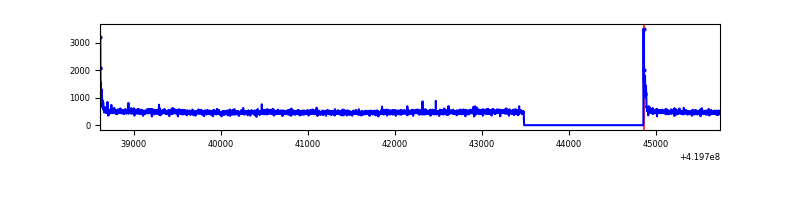 |
| D | 7119 | 5747 | 153 | 153 | 2.15% | 2.66% | 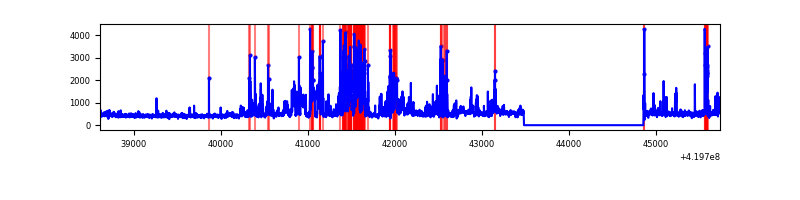 |
Top three noisy pixels from each quadrant. If the there are fewer than three noisy pixels in the level2.evt file, extra rows are filled as -1
| Pixel properties | Quadrant properties | ||||||
|---|---|---|---|---|---|---|---|
| Quadrant | DetID | PixID | Counts | Sigma | Mean | Median | Sigma |
| A | 10 | 83 | 564793 | 4343.92 | 632 | 617 | 129.9 |
| A | 12 | 189 | 131903 | 1010.85 | 632 | 617 | 129.9 |
| A | 2 | 79 | 14602 | 107.68 | 632 | 617 | 129.9 |
| B | 5 | 255 | 545211 | 4429.4 | 628 | 611 | 123.0 |
| B | 4 | 171 | 446227 | 3624.33 | 628 | 611 | 123.0 |
| B | 0 | 190 | 101738 | 822.5 | 628 | 611 | 123.0 |
| C | 15 | 214 | 245882 | 1679.96 | 620 | 624 | 146.0 |
| C | 0 | 10 | 64519 | 437.66 | 620 | 624 | 146.0 |
| C | 10 | 70 | 37226 | 250.71 | 620 | 624 | 146.0 |
| D | 12 | 79 | 438753 | 2913.3 | 607 | 590 | 150.4 |
| D | 2 | 249 | 379510 | 2519.4 | 607 | 590 | 150.4 |
| D | 13 | 249 | 180327 | 1195.05 | 607 | 590 | 150.4 |
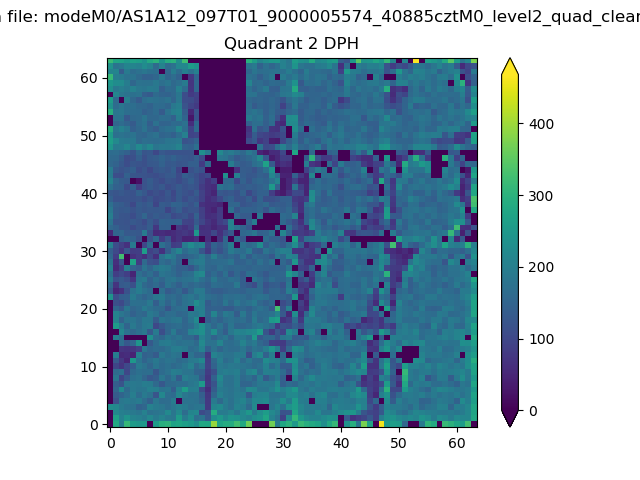
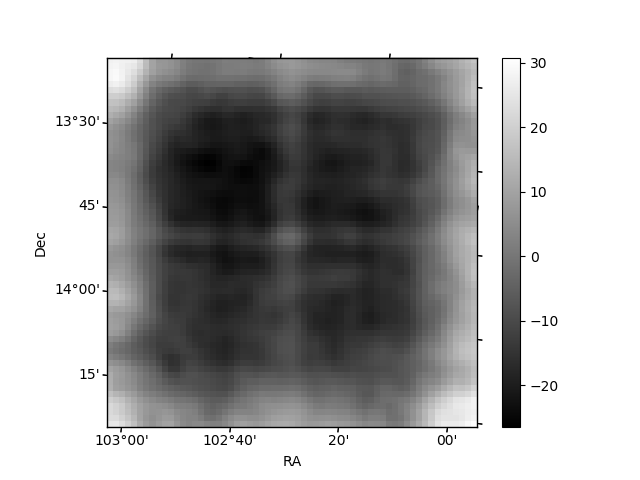
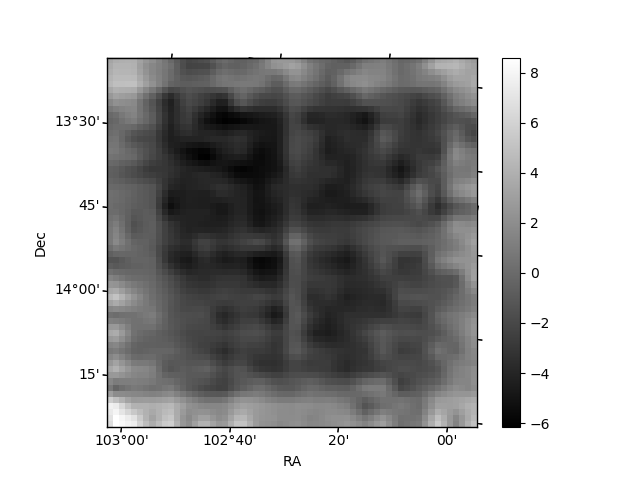
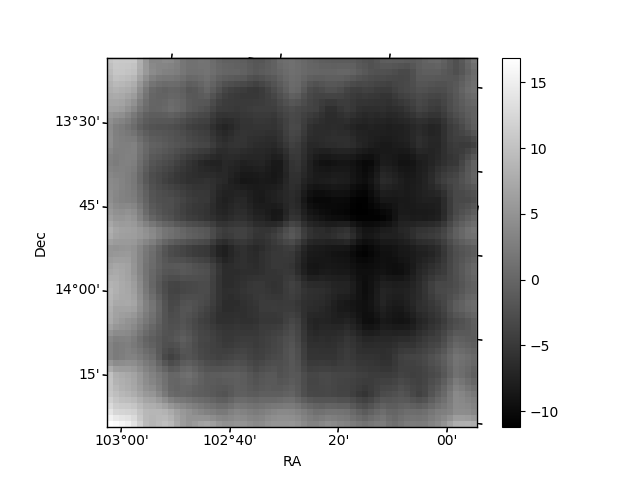
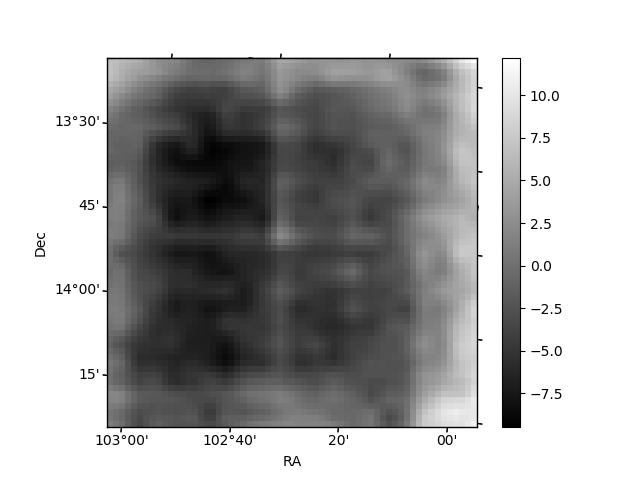
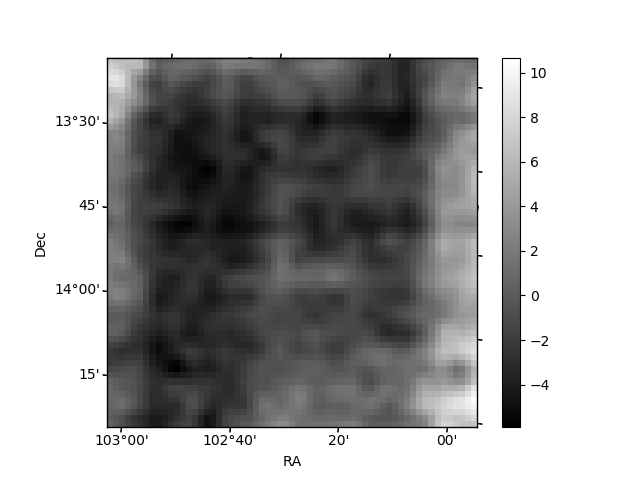
Histogram calculated using DETX and DETY for each event in the final _common_clean file
| Quadrant A | 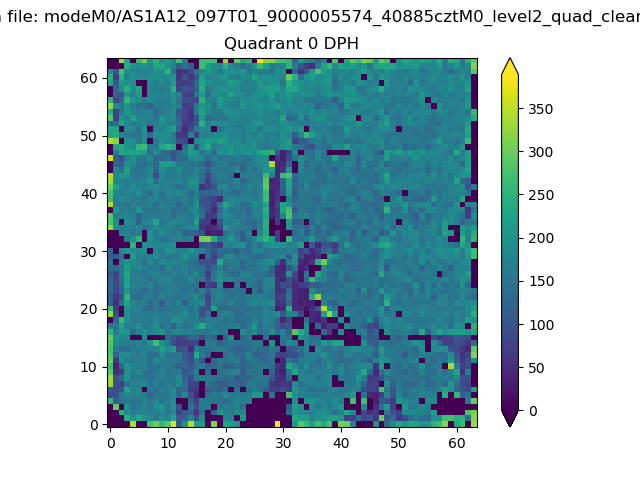 |
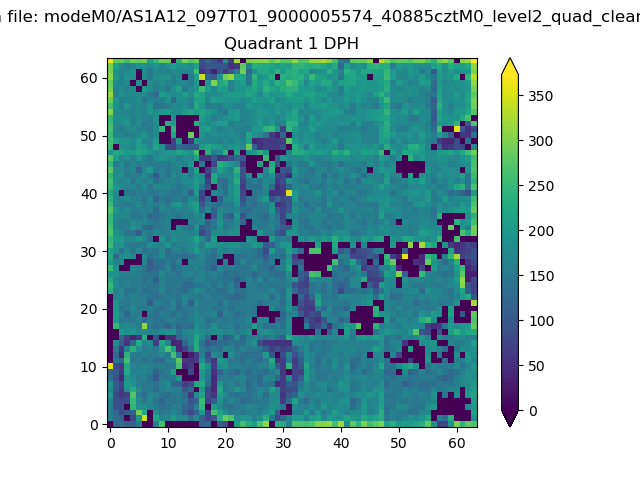 |
Quadrant B |
|---|---|---|---|
| Quadrant D | 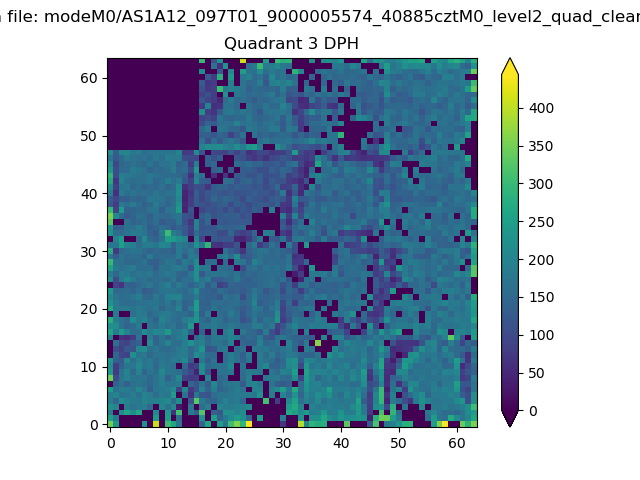 |
 |
Quadrant C |
| Plot type | Count rate plots | Images |
|---|---|---|
| Comparison with Poisson distribution Blue bars denote a histogram of data divided into 1 sec bins. Red curve is a Poisson curve with rate = median count rate of data. |
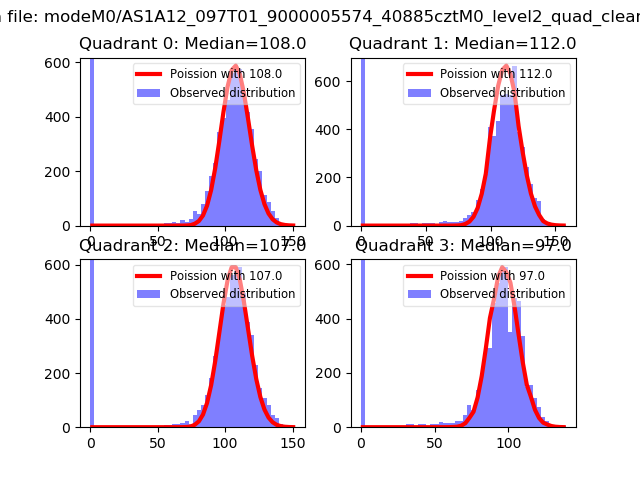 |
 |
| Quadrant-wise count rates Data is divided into 100 sec bins |
 |
|
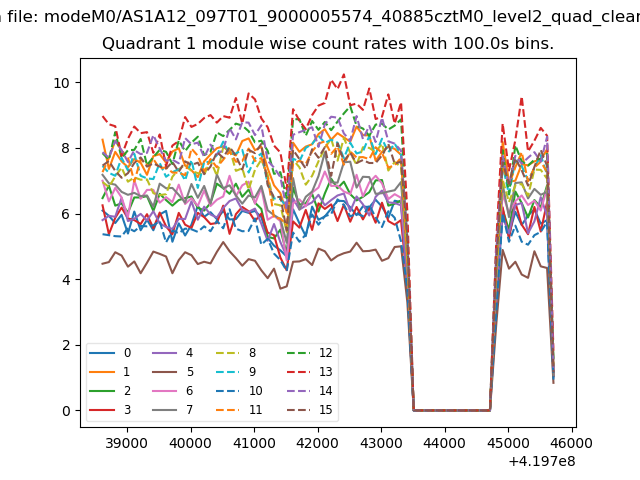
| Module-wise count rates for Quadrant A Data is divided into 100 sec bins |
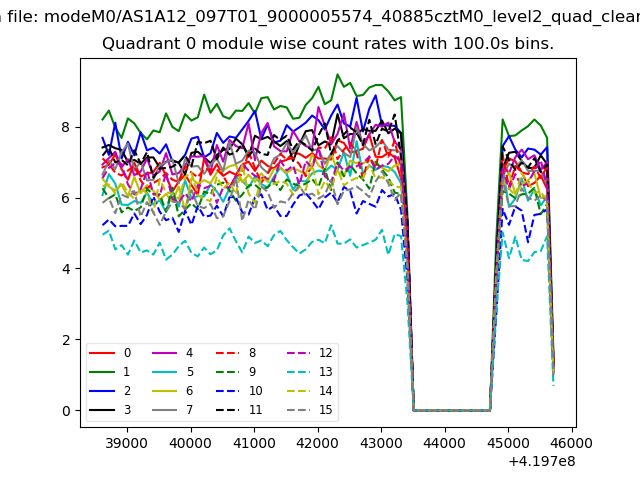 |
 |
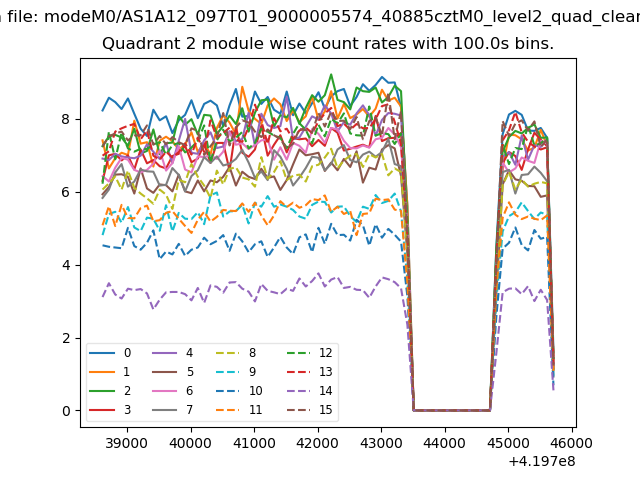
| Module-wise count rates for Quadrant B Data is divided into 100 sec bins |
 |
 |
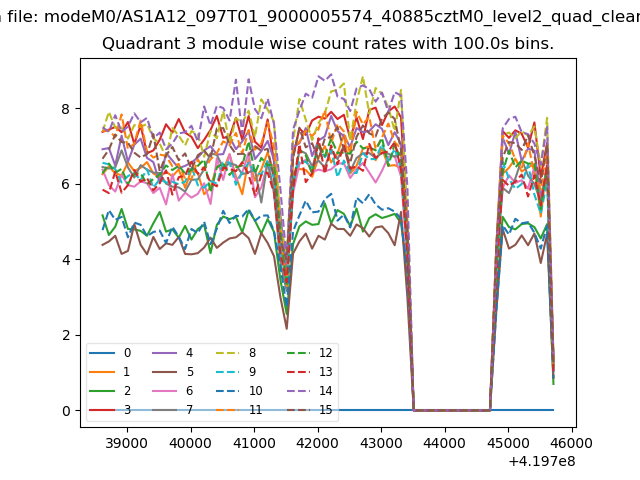
| Module-wise count rates for Quadrant C Data is divided into 100 sec bins |
 |
 |
| Module-wise count rates for Quadrant D Data is divided into 100 sec bins |
 |
 |
| Parameter | Plot |
|---|---|
| CZT HV Monitor | 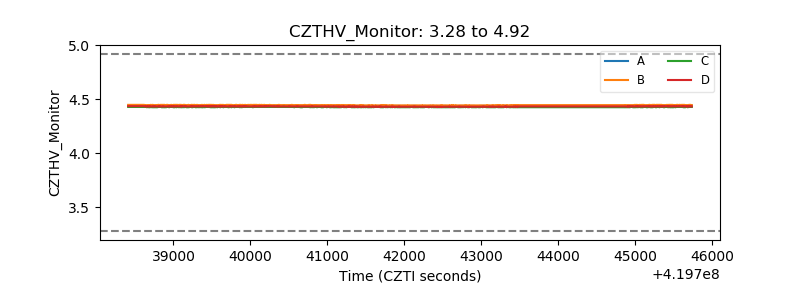 |
| D_VDD | 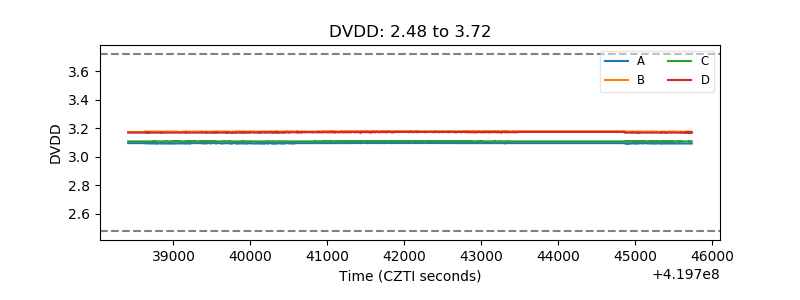 |
| Temperature 1 | 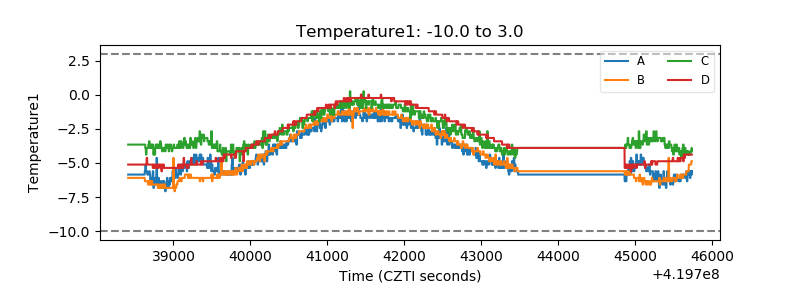 |
| Veto HV Monitor | 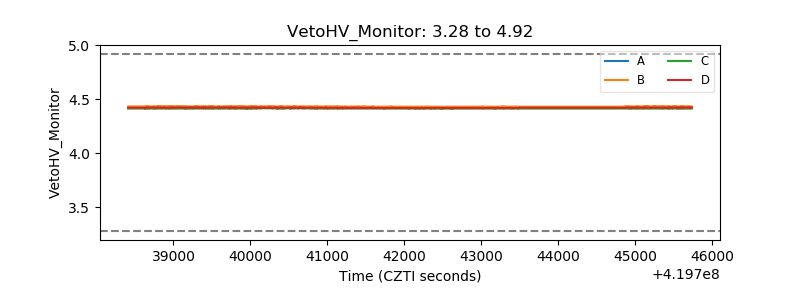 |
| Veto LLD | 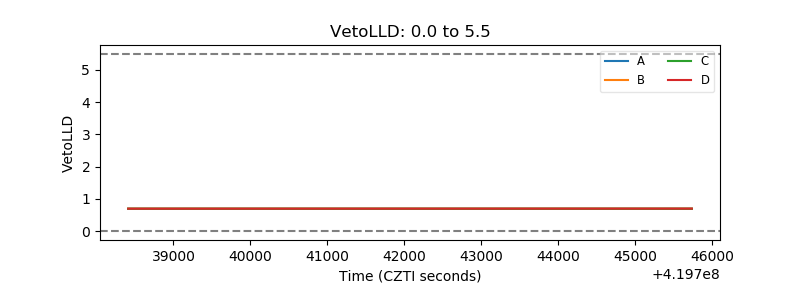 |
| Alpha Counter | 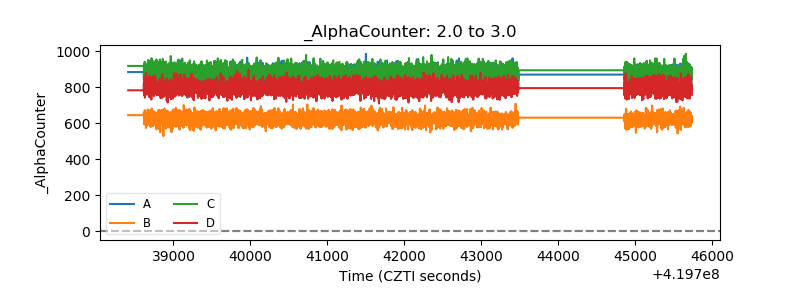 |
| _CPM_Rate | 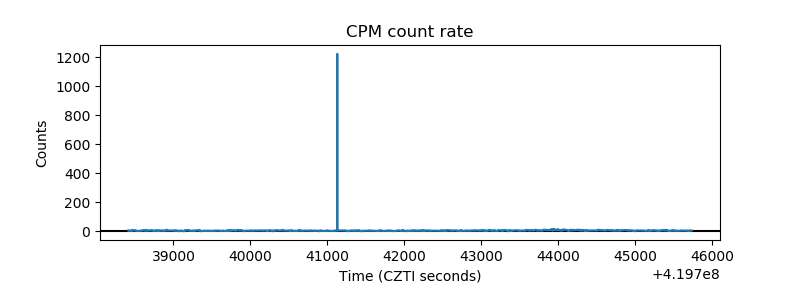 |
| CZT Counter | 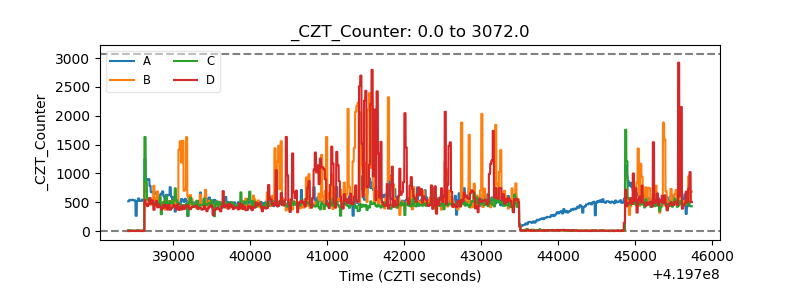 |
| +2.5 Volts monitor |  |
| +5 Volts monitor | 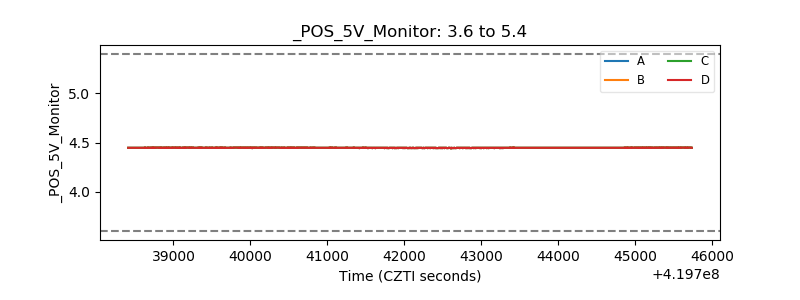 |
| _ROLL_ROT | 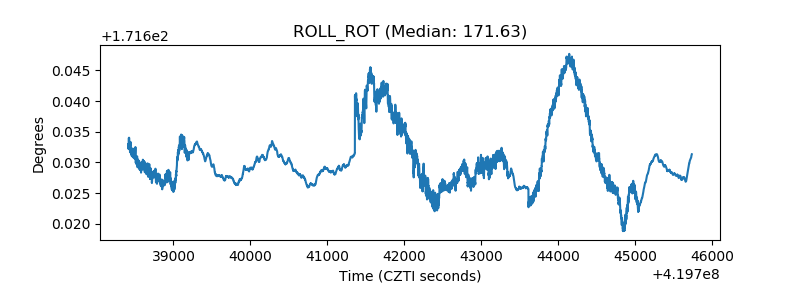 |
| _Roll_DEC |  |
| _Roll_RA | 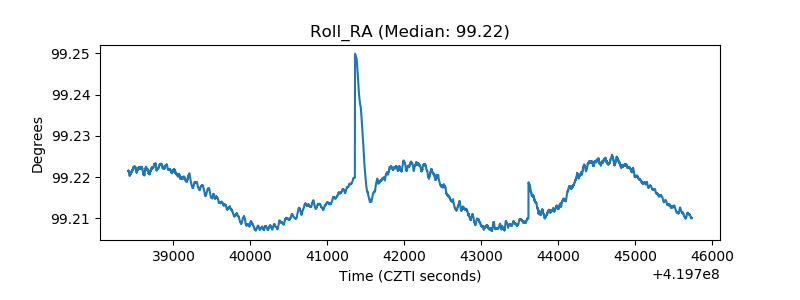 |
| Veto Counter | 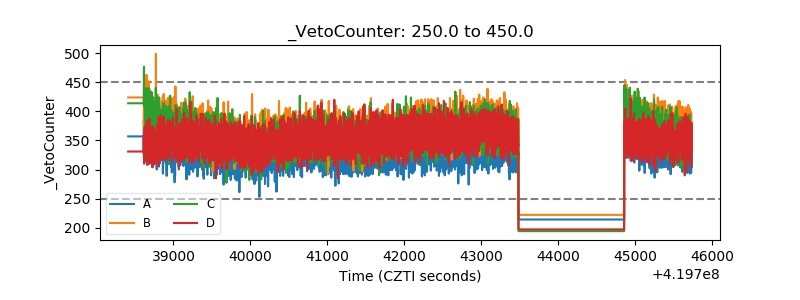 |