| Param | Original file | Final file |
|---|---|---|
| Filename | modeM0/AS1A12_097T01_9000005574_40886cztM0_level2.fits | modeM0/AS1A12_097T01_9000005574_40886cztM0_level2_quad_clean.evt |
| Size (bytes) | 470,427,840 | 101,741,760 |
| Size | 448.6 MB | 97.0 MB |
| Events in quadrant A | 3,481,894 | 682,279 |
| Events in quadrant B | 4,494,856 | 687,213 |
| Events in quadrant C | 3,042,276 | 683,022 |
| Events in quadrant D | 5,897,110 | 580,905 |
| Mode M9 | |||
|---|---|---|---|
| Quadrant | BADHDUFLAG | Total packets | Discarded packets |
| A | 0 | 27 | 0 |
| B | 0 | 27 | 0 |
| C | 0 | 27 | 0 |
| D | 0 | 27 | 0 |
| Mode SS | |||
|---|---|---|---|
| Quadrant | BADHDUFLAG | Total packets | Discarded packets |
| A | 0 | 132 | 0 |
| B | 0 | 132 | 0 |
| C | 0 | 132 | 0 |
| D | 0 | 132 | 0 |
| Mode M0 | |||
|---|---|---|---|
| Quadrant | BADHDUFLAG | Total packets | Discarded packets |
| A | 0 | 14023 | 3 |
| B | 0 | 17626 | 2 |
| C | 0 | 13012 | 2 |
| D | 0 | 21830 | 2 |
| Quadrant | Total seconds | Saturated seconds | Saturation percentage |
|---|---|---|---|
| A | 6406 | 20 | 0.312207% |
| B | 6406 | 362 | 5.650952% |
| C | 6406 | 13 | 0.202935% |
| D | 6406 | 572 | 8.929129% |
Noise dominated data is calculated using 1-second bins in cleaned event files. If a bin has >2000 counts, and if more than 50% of those come from <1% of pixels, then it is considered to be noise-dominated and hence unusable.
| Quadrant | # 1 sec bins | Bins with >0 counts | Bins with >2000 counts | High rate bins dominated by noise | Noise dominated (total time) | Noise dominated (detector-on time) | Marked lightcurve |
|---|---|---|---|---|---|---|---|
| A | 9061 | 6408 | 13 | 13 | 0.14% | 0.20% | 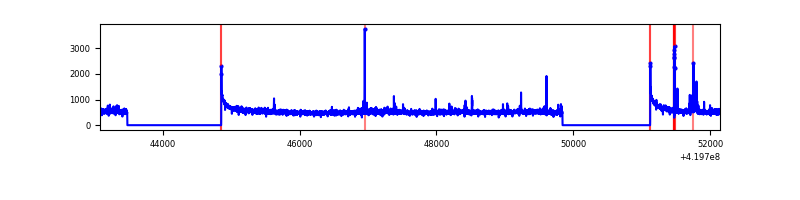 |
| B | 9061 | 6408 | 212 | 212 | 2.34% | 3.31% | 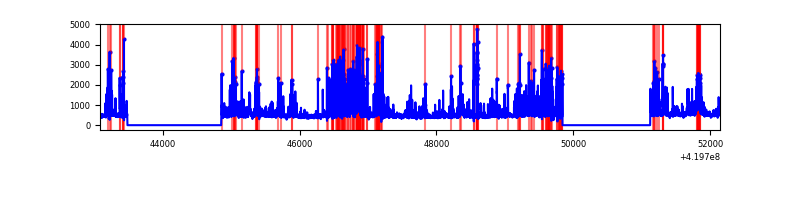 |
| C | 9061 | 6408 | 5 | 5 | 0.06% | 0.08% | 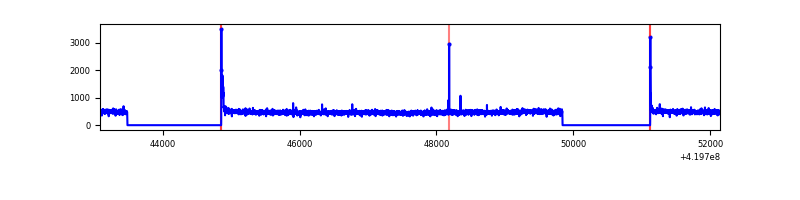 |
| D | 9061 | 6408 | 462 | 462 | 5.10% | 7.21% | 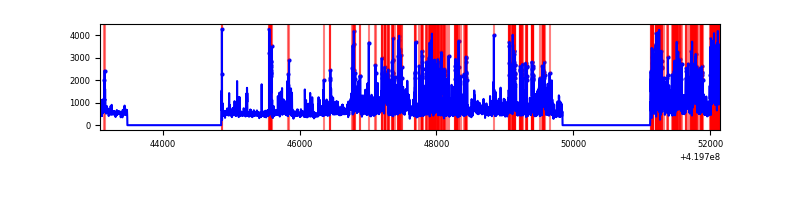 |
Top three noisy pixels from each quadrant. If the there are fewer than three noisy pixels in the level2.evt file, extra rows are filled as -1
| Pixel properties | Quadrant properties | ||||||
|---|---|---|---|---|---|---|---|
| Quadrant | DetID | PixID | Counts | Sigma | Mean | Median | Sigma |
| A | 10 | 83 | 600396 | 4090.87 | 706 | 691 | 146.6 |
| A | 13 | 248 | 65590 | 442.71 | 706 | 691 | 146.6 |
| A | 12 | 189 | 64626 | 436.13 | 706 | 691 | 146.6 |
| B | 4 | 171 | 720649 | 5296.31 | 694 | 675 | 135.9 |
| B | 5 | 255 | 616780 | 4532.23 | 694 | 675 | 135.9 |
| B | 0 | 190 | 217341 | 1593.85 | 694 | 675 | 135.9 |
| C | 15 | 214 | 273106 | 1668.85 | 694 | 698 | 163.2 |
| C | 0 | 10 | 50769 | 306.75 | 694 | 698 | 163.2 |
| C | 0 | 207 | 6120 | 33.22 | 694 | 698 | 163.2 |
| D | 12 | 79 | 1341031 | 8190.24 | 668 | 651 | 163.7 |
| D | 13 | 249 | 883810 | 5396.44 | 668 | 651 | 163.7 |
| D | 2 | 249 | 448709 | 2737.81 | 668 | 651 | 163.7 |
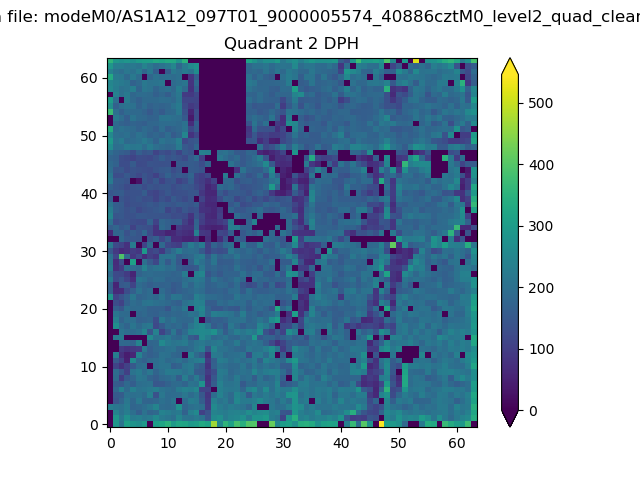
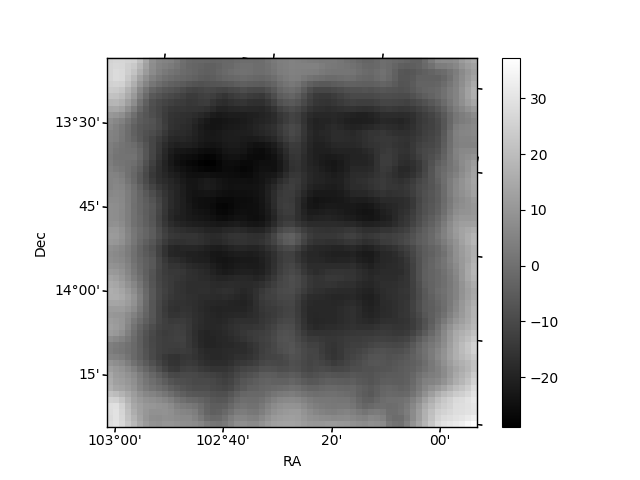
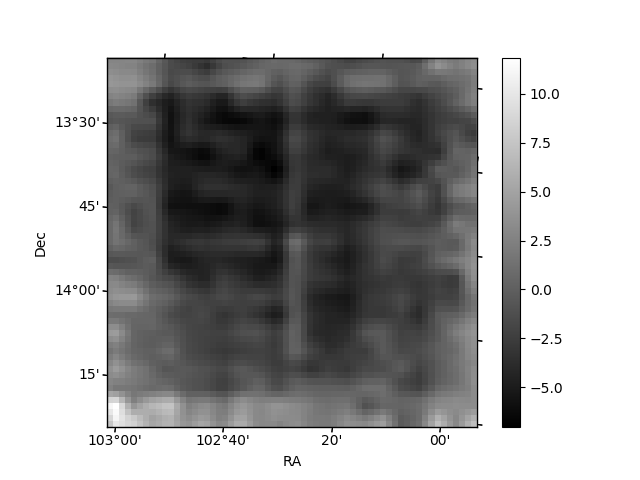
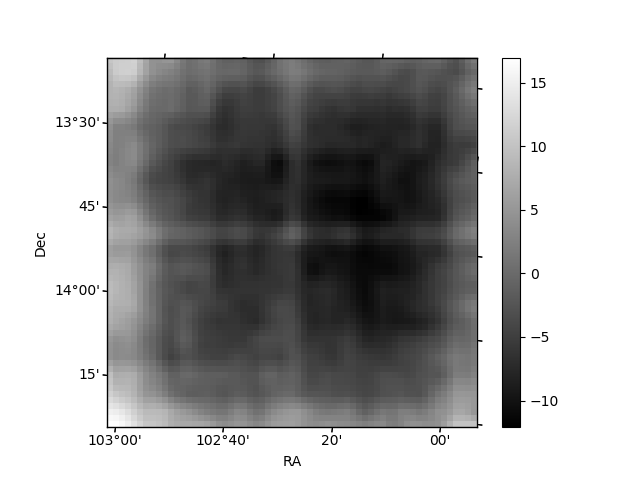
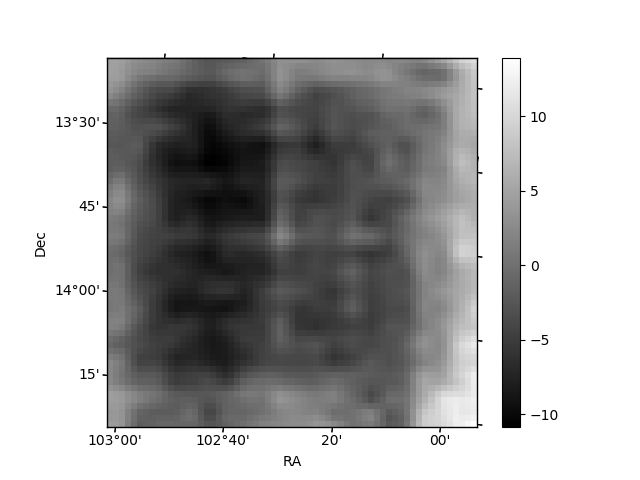
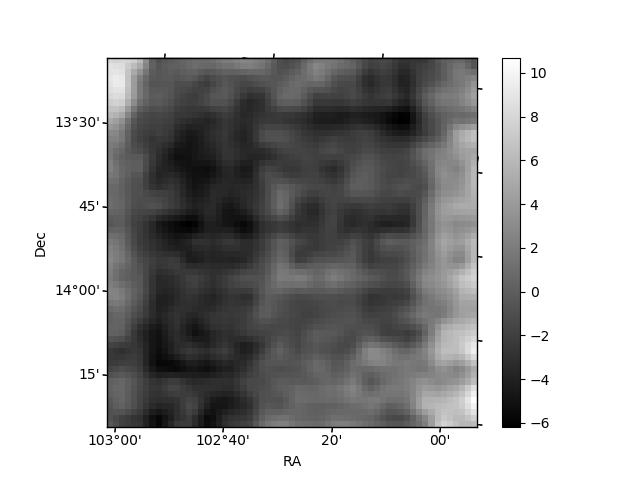
Histogram calculated using DETX and DETY for each event in the final _common_clean file
| Quadrant A | 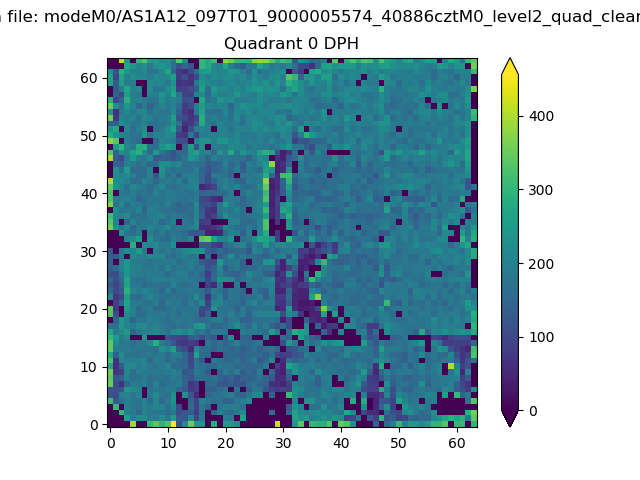 |
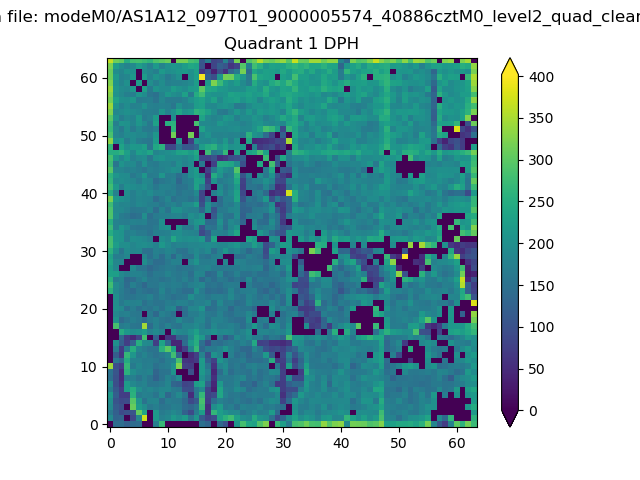 |
Quadrant B |
|---|---|---|---|
| Quadrant D | 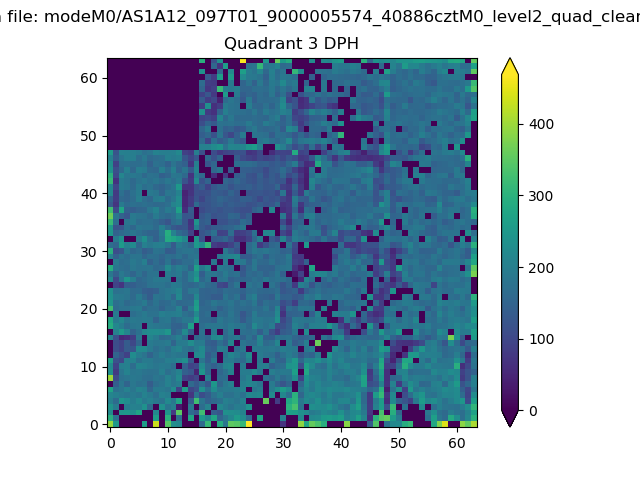 |
 |
Quadrant C |
| Plot type | Count rate plots | Images |
|---|---|---|
| Comparison with Poisson distribution Blue bars denote a histogram of data divided into 1 sec bins. Red curve is a Poisson curve with rate = median count rate of data. |
 |
 |
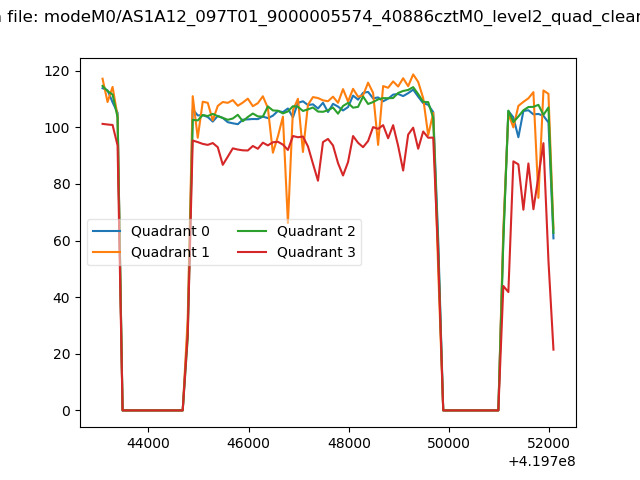
| Quadrant-wise count rates Data is divided into 100 sec bins |
 |
|
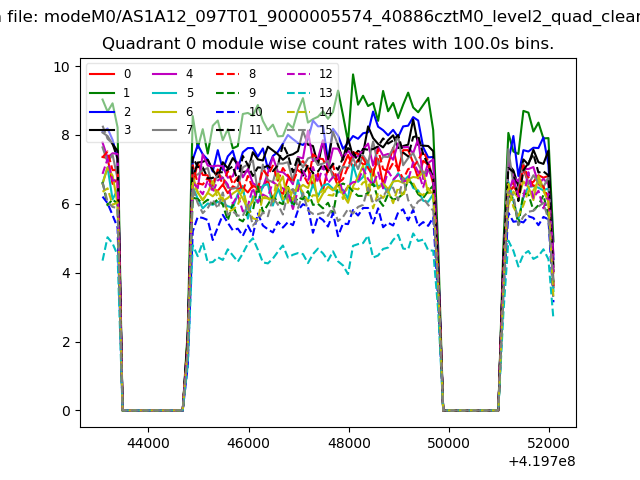
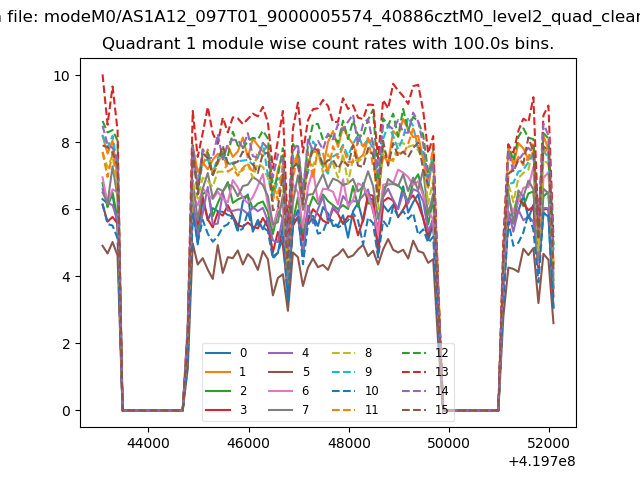
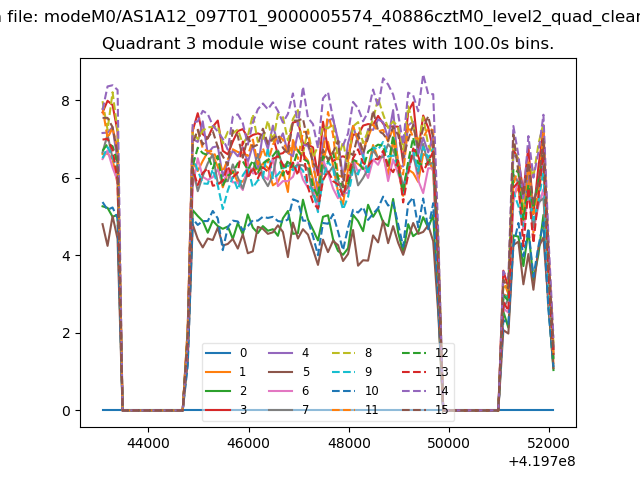
| Module-wise count rates for Quadrant A Data is divided into 100 sec bins |
 |
 |
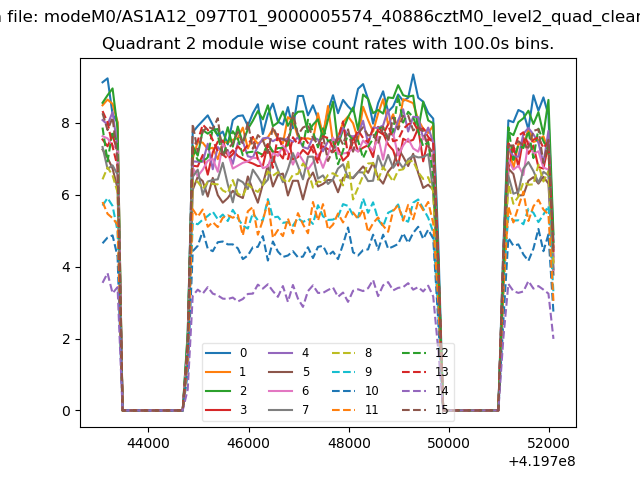
| Module-wise count rates for Quadrant B Data is divided into 100 sec bins |
 |
 |
| Module-wise count rates for Quadrant C Data is divided into 100 sec bins |
 |
 |
| Module-wise count rates for Quadrant D Data is divided into 100 sec bins |
 |
 |
| Parameter | Plot |
|---|---|
| CZT HV Monitor |  |
| D_VDD | 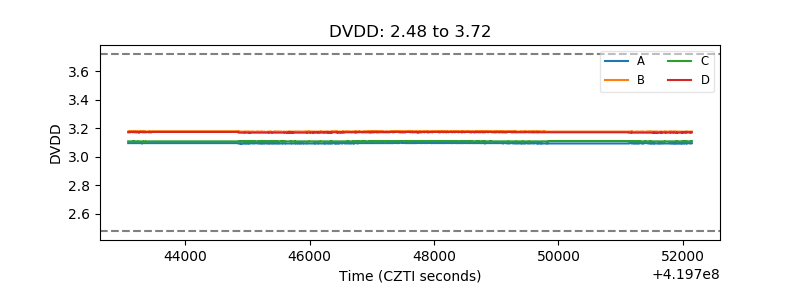 |
| Temperature 1 | 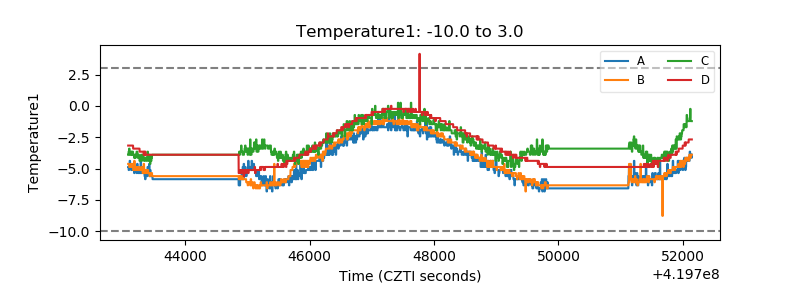 |
| Veto HV Monitor | 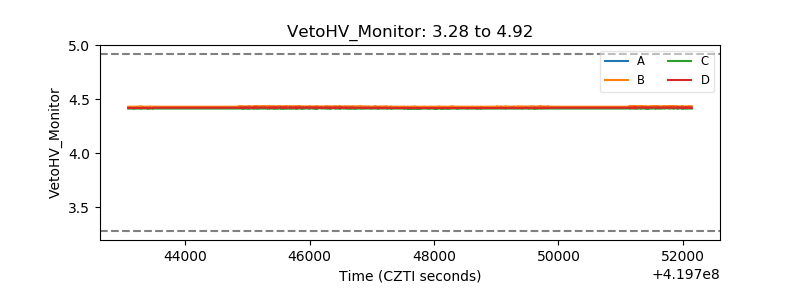 |
| Veto LLD | 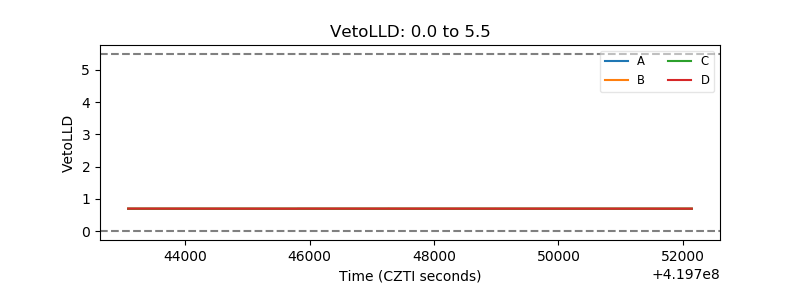 |
| Alpha Counter | 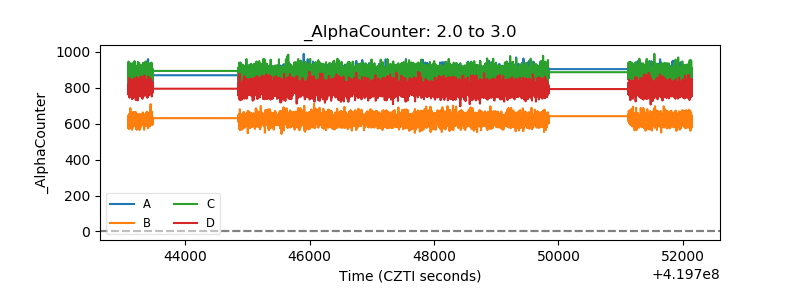 |
| _CPM_Rate |  |
| CZT Counter | 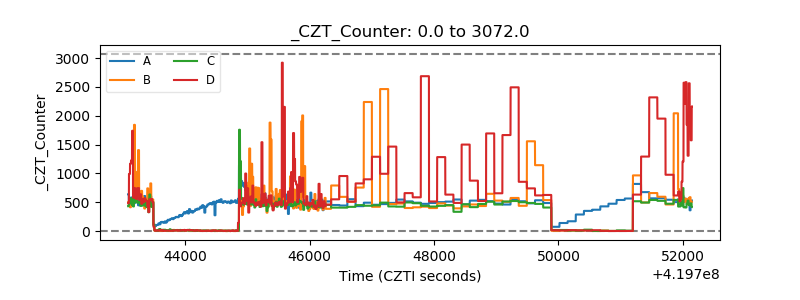 |
| +2.5 Volts monitor |  |
| +5 Volts monitor | 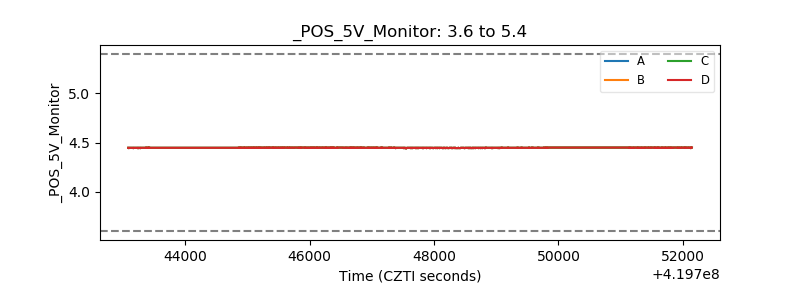 |
| _ROLL_ROT | 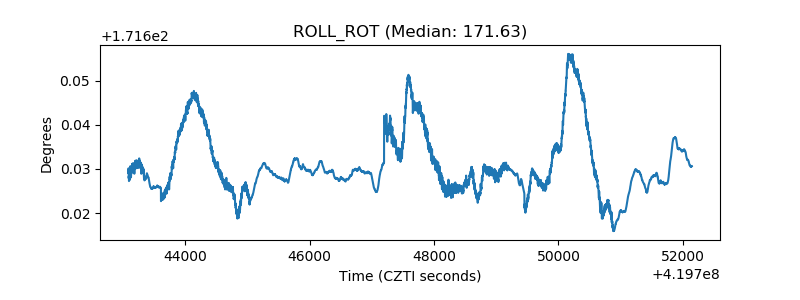 |
| _Roll_DEC | 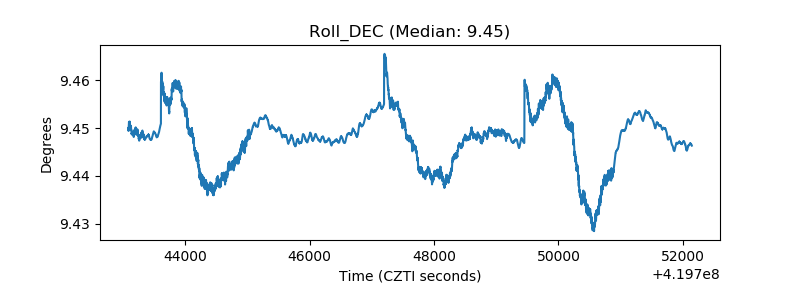 |
| _Roll_RA | 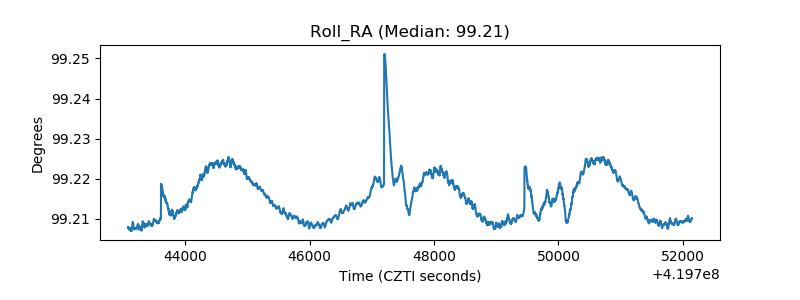 |
| Veto Counter | 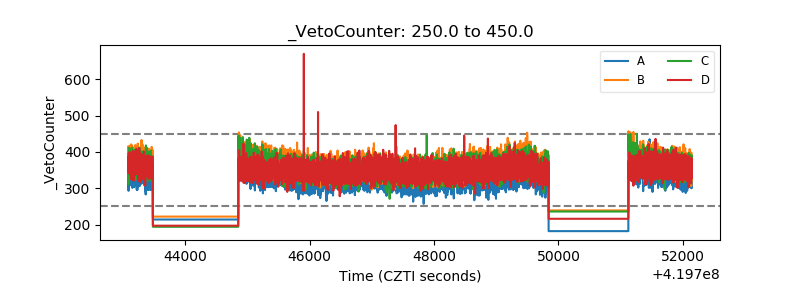 |