| Param | Original file | Final file |
|---|---|---|
| Filename | modeM0/AS1A12_097T01_9000005574_40889cztM0_level2.fits | modeM0/AS1A12_097T01_9000005574_40889cztM0_level2_quad_clean.evt |
| Size (bytes) | 977,664,960 | 203,247,360 |
| Size | 932.4 MB | 193.8 MB |
| Events in quadrant A | 6,981,060 | 1,384,673 |
| Events in quadrant B | 10,630,008 | 1,336,639 |
| Events in quadrant C | 6,116,404 | 1,379,926 |
| Events in quadrant D | 11,461,391 | 1,158,096 |
| Mode M9 | |||
|---|---|---|---|
| Quadrant | BADHDUFLAG | Total packets | Discarded packets |
| A | 0 | 55 | 0 |
| B | 0 | 55 | 1 |
| C | 0 | 55 | 0 |
| D | 0 | 55 | 0 |
| Mode SS | |||
|---|---|---|---|
| Quadrant | BADHDUFLAG | Total packets | Discarded packets |
| A | 0 | 266 | 0 |
| B | 0 | 266 | 0 |
| C | 0 | 266 | 0 |
| D | 0 | 266 | 0 |
| Mode M0 | |||
|---|---|---|---|
| Quadrant | BADHDUFLAG | Total packets | Discarded packets |
| A | 0 | 28397 | 11 |
| B | 0 | 40294 | 8 |
| C | 0 | 26294 | 10 |
| D | 0 | 42930 | 20 |
| Quadrant | Total seconds | Saturated seconds | Saturation percentage |
|---|---|---|---|
| A | 12939 | 45 | 0.347786% |
| B | 12939 | 1242 | 9.598887% |
| C | 12938 | 21 | 0.162313% |
| D | 12938 | 1212 | 9.367754% |
Noise dominated data is calculated using 1-second bins in cleaned event files. If a bin has >2000 counts, and if more than 50% of those come from <1% of pixels, then it is considered to be noise-dominated and hence unusable.
| Quadrant | # 1 sec bins | Bins with >0 counts | Bins with >2000 counts | High rate bins dominated by noise | Noise dominated (total time) | Noise dominated (detector-on time) | Marked lightcurve |
|---|---|---|---|---|---|---|---|
| A | 21345 | 12943 | 17 | 17 | 0.08% | 0.13% | 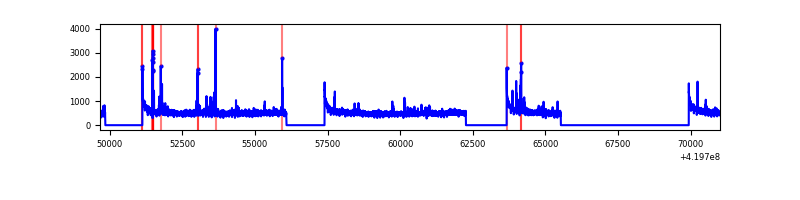 |
| B | 21345 | 12943 | 833 | 833 | 3.90% | 6.44% | 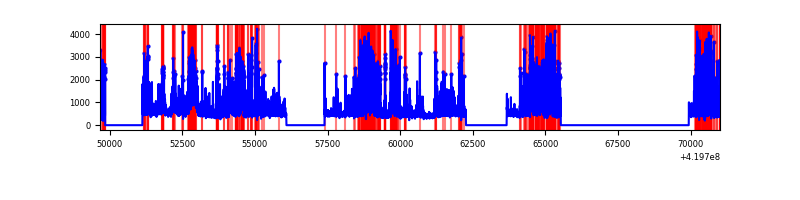 |
| C | 21345 | 12943 | 8 | 8 | 0.04% | 0.06% | 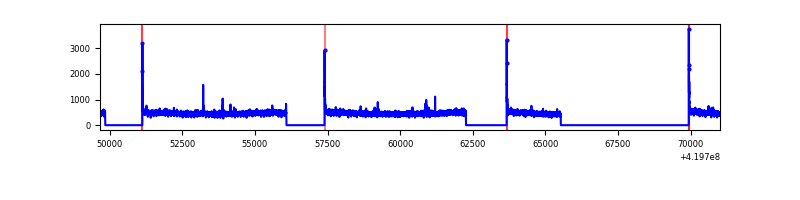 |
| D | 21345 | 12942 | 986 | 986 | 4.62% | 7.62% | 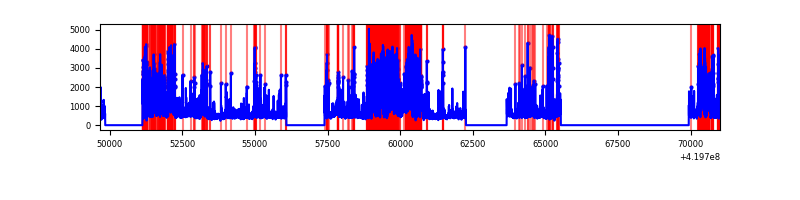 |
Top three noisy pixels from each quadrant. If the there are fewer than three noisy pixels in the level2.evt file, extra rows are filled as -1
| Pixel properties | Quadrant properties | ||||||
|---|---|---|---|---|---|---|---|
| Quadrant | DetID | PixID | Counts | Sigma | Mean | Median | Sigma |
| A | 10 | 83 | 1213213 | 4163.28 | 1424 | 1396 | 291.1 |
| A | 13 | 248 | 135462 | 460.59 | 1424 | 1396 | 291.1 |
| A | 2 | 79 | 56629 | 189.75 | 1424 | 1396 | 291.1 |
| B | 5 | 255 | 2117220 | 7977.88 | 1375 | 1336 | 265.2 |
| B | 4 | 171 | 1834459 | 6911.74 | 1375 | 1336 | 265.2 |
| B | 0 | 229 | 484882 | 1823.2 | 1375 | 1336 | 265.2 |
| C | 15 | 214 | 551975 | 1695.39 | 1396 | 1402 | 324.7 |
| C | 0 | 10 | 82440 | 249.54 | 1396 | 1402 | 324.7 |
| C | 14 | 254 | 26890 | 78.49 | 1396 | 1402 | 324.7 |
| D | 12 | 233 | 2161919 | 6541.44 | 1347 | 1310 | 330.3 |
| D | 12 | 79 | 1483040 | 4486.07 | 1347 | 1310 | 330.3 |
| D | 13 | 249 | 977859 | 2956.59 | 1347 | 1310 | 330.3 |
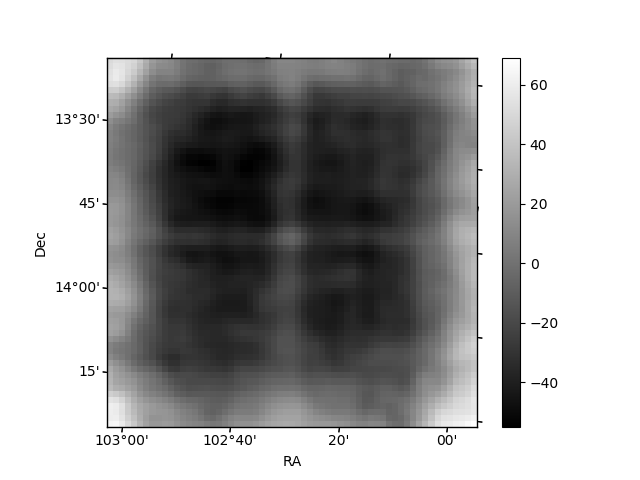
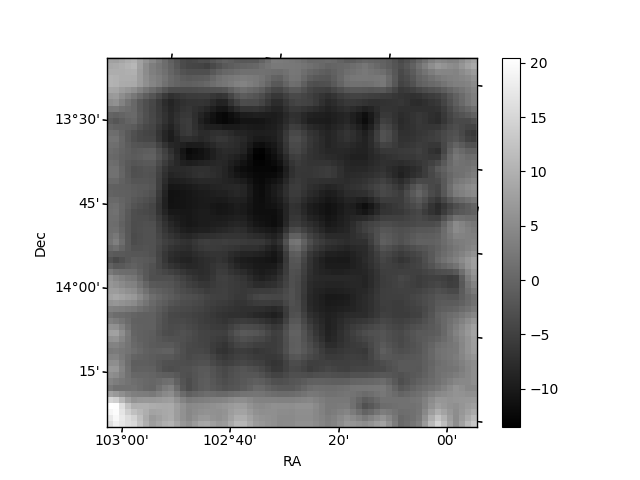
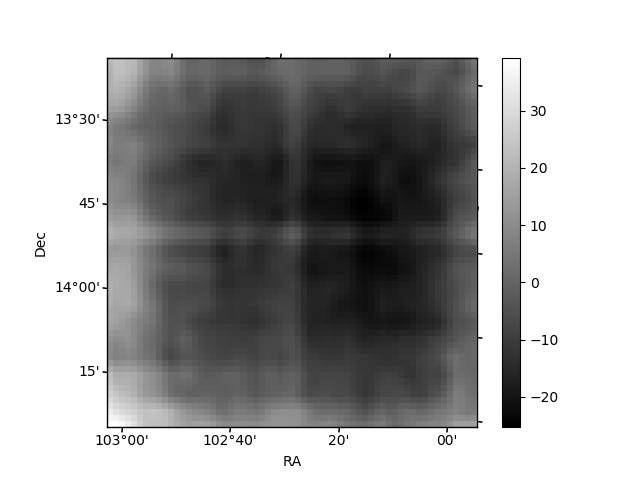
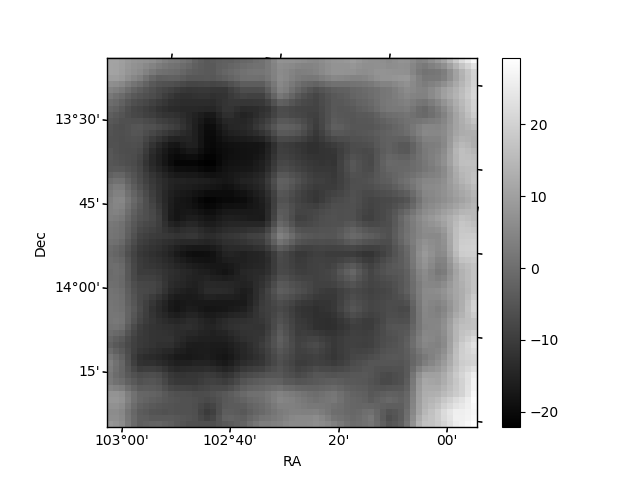
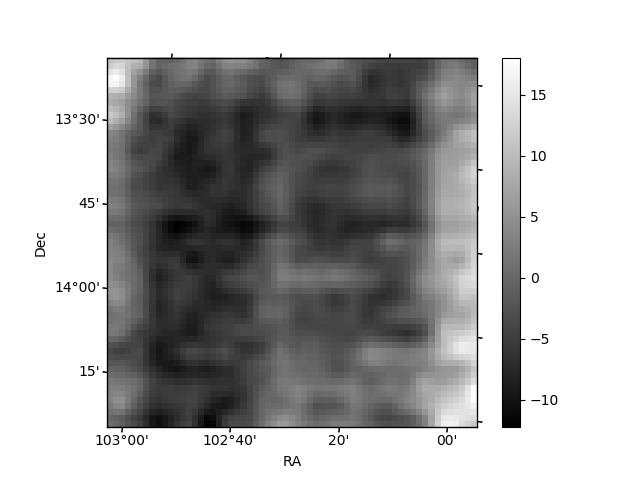
Histogram calculated using DETX and DETY for each event in the final _common_clean file
| Quadrant A | 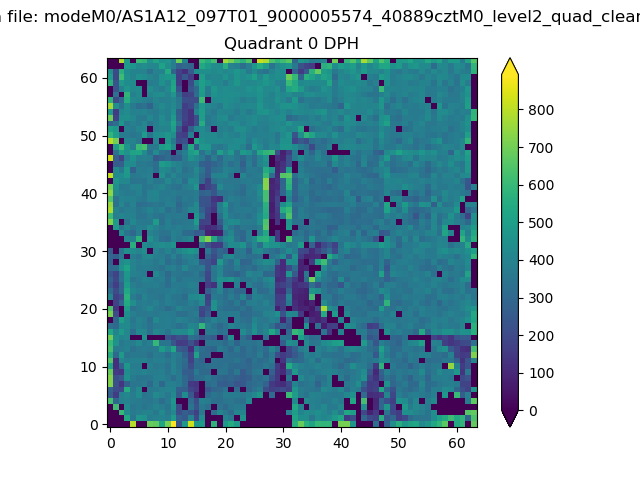 |
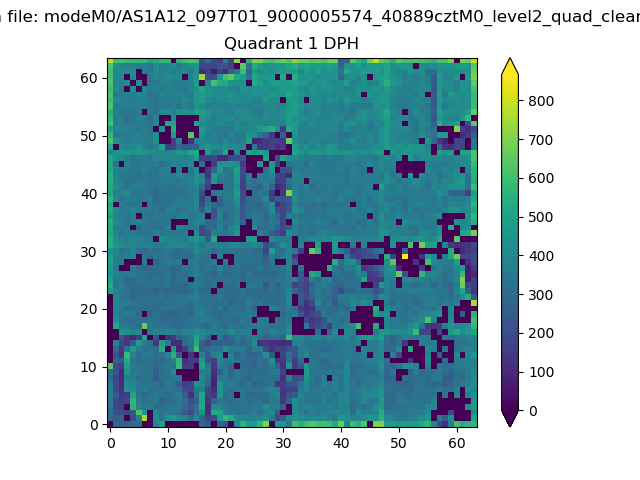 |
Quadrant B |
|---|---|---|---|
| Quadrant D | 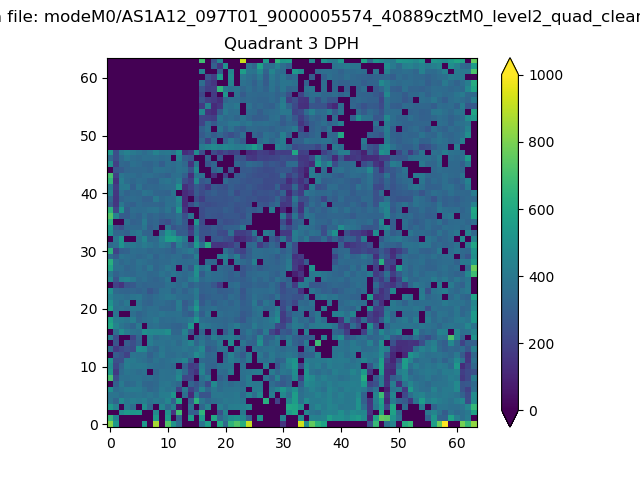 |
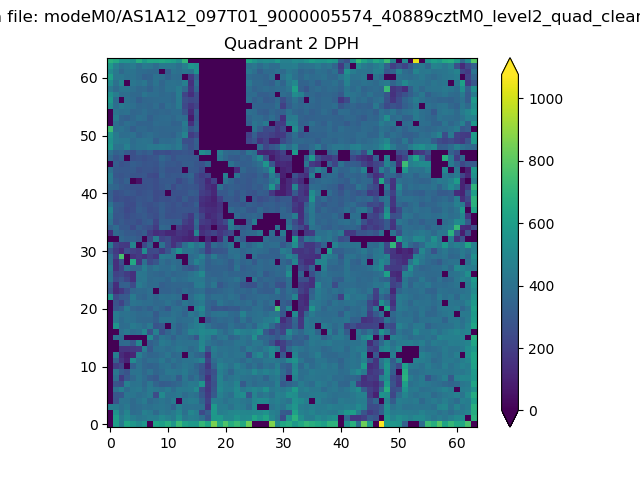 |
Quadrant C |
| Plot type | Count rate plots | Images |
|---|---|---|
| Comparison with Poisson distribution Blue bars denote a histogram of data divided into 1 sec bins. Red curve is a Poisson curve with rate = median count rate of data. |
 |
 |
| Quadrant-wise count rates Data is divided into 100 sec bins |
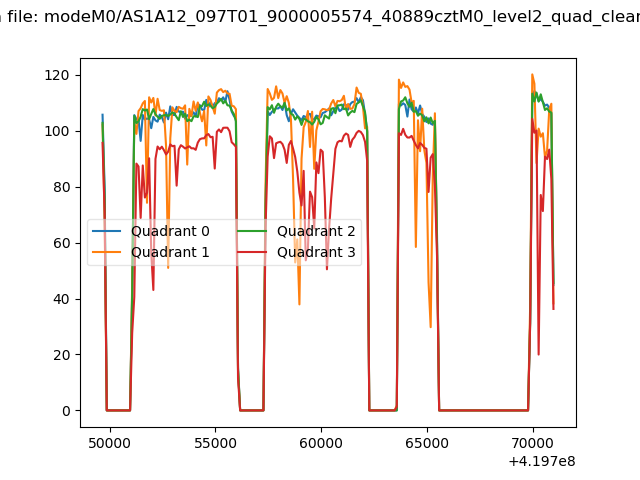 |
|
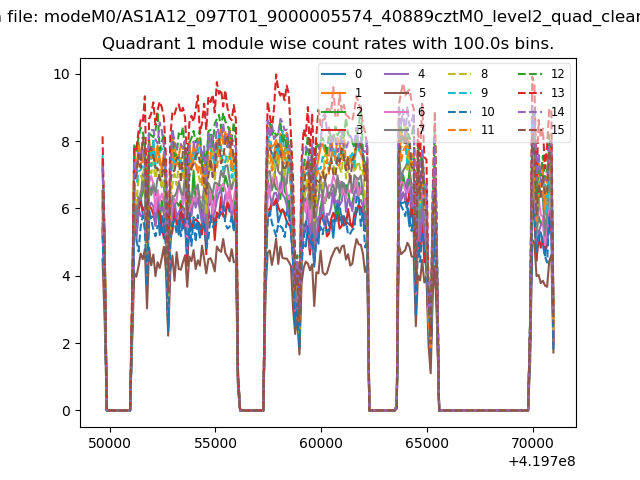
| Module-wise count rates for Quadrant A Data is divided into 100 sec bins |
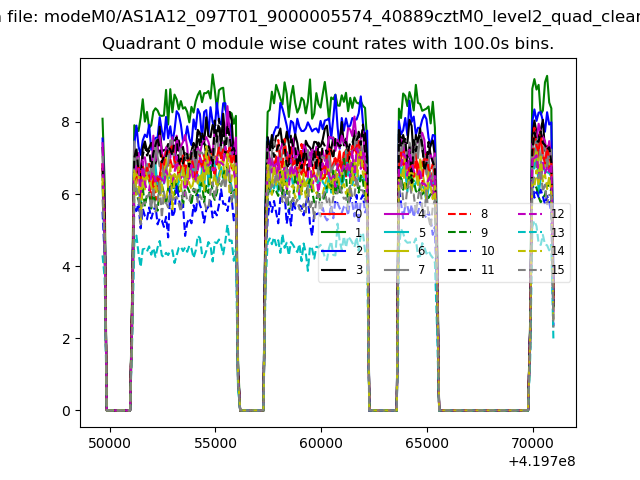 |
 |
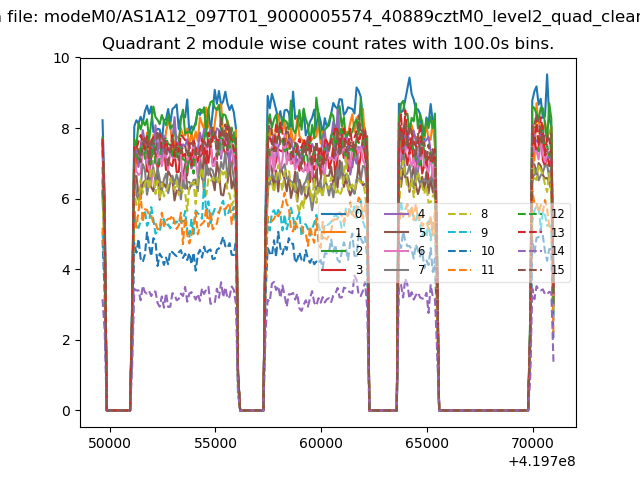
| Module-wise count rates for Quadrant B Data is divided into 100 sec bins |
 |
 |
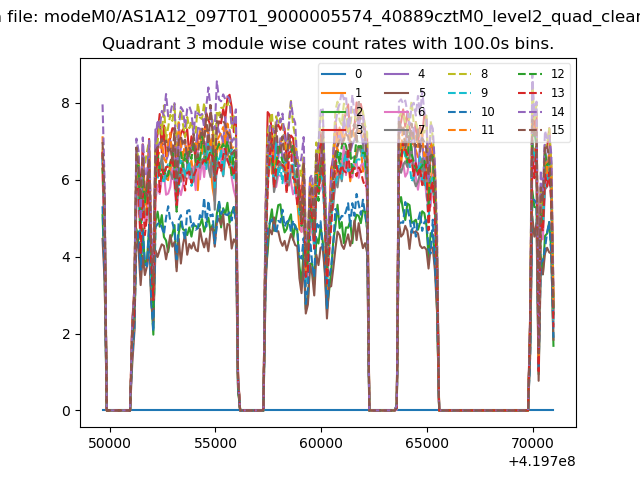
| Module-wise count rates for Quadrant C Data is divided into 100 sec bins |
 |
 |
| Module-wise count rates for Quadrant D Data is divided into 100 sec bins |
 |
 |
| Parameter | Plot |
|---|---|
| CZT HV Monitor |  |
| D_VDD | 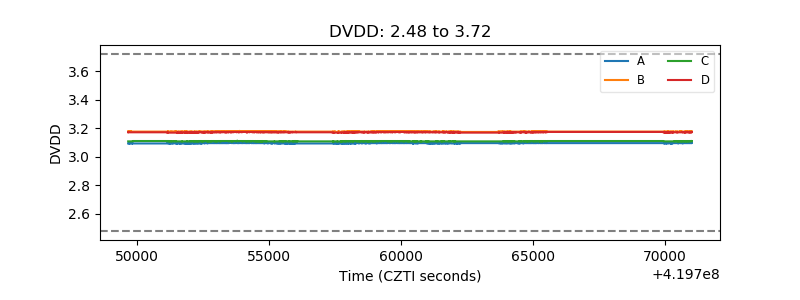 |
| Temperature 1 | 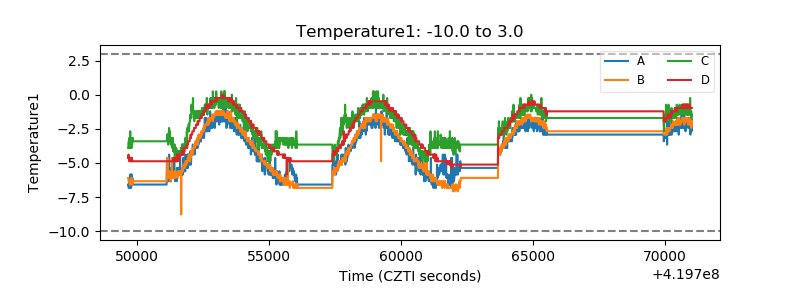 |
| Veto HV Monitor | 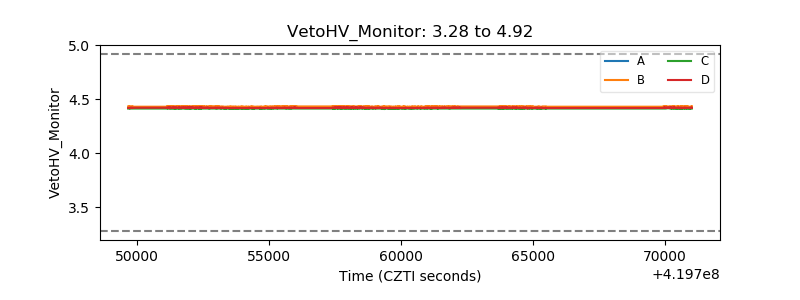 |
| Veto LLD | 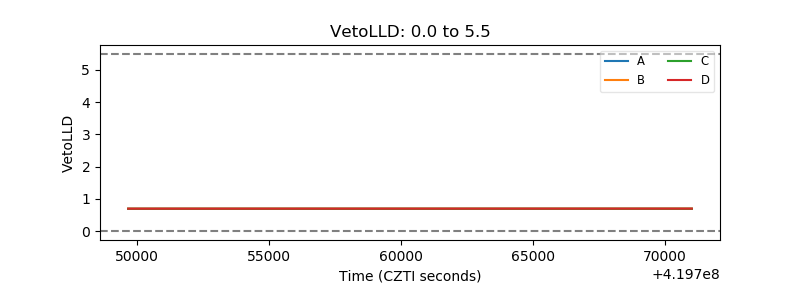 |
| Alpha Counter | 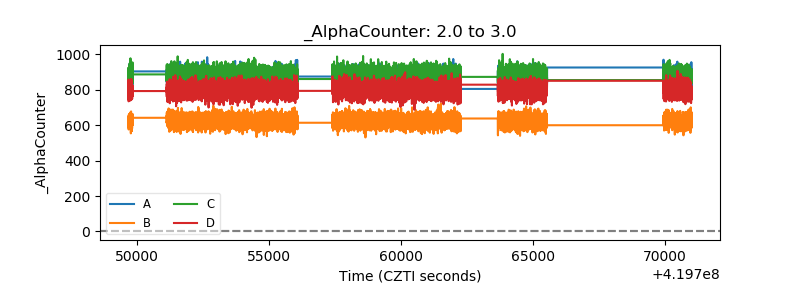 |
| _CPM_Rate | 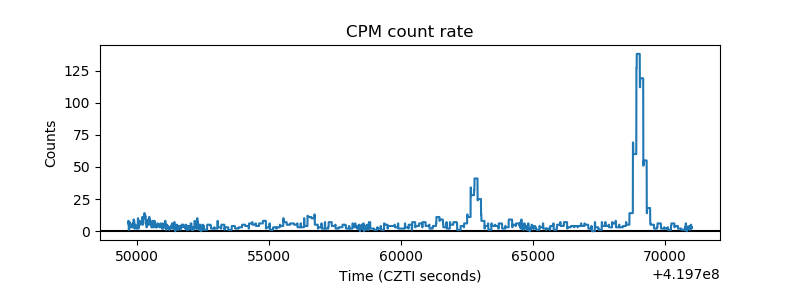 |
| CZT Counter | 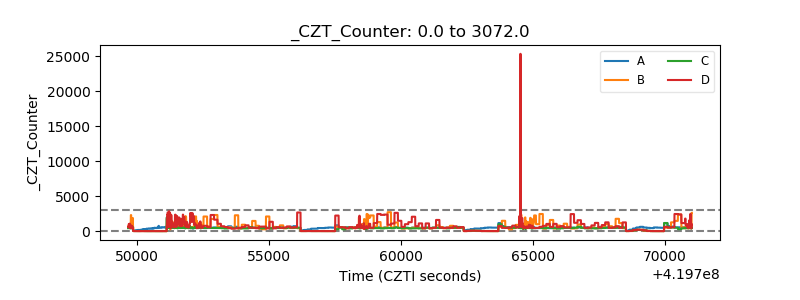 |
| +2.5 Volts monitor |  |
| +5 Volts monitor | 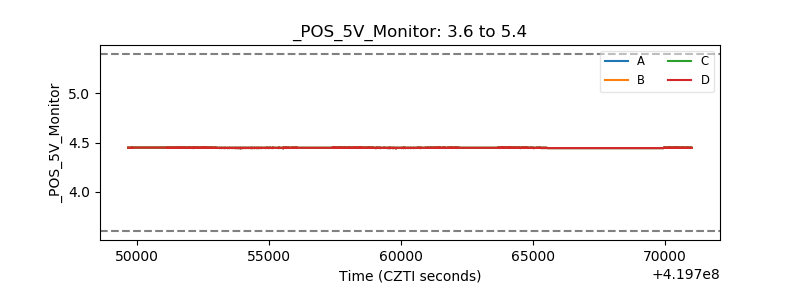 |
| _ROLL_ROT | 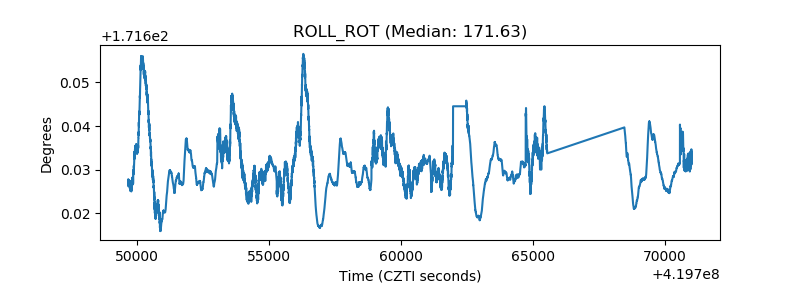 |
| _Roll_DEC |  |
| _Roll_RA | 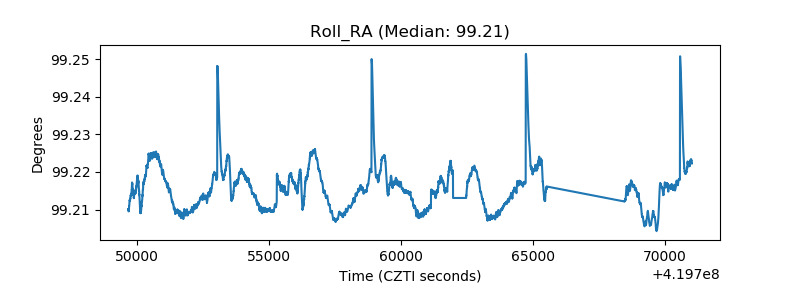 |
| Veto Counter | 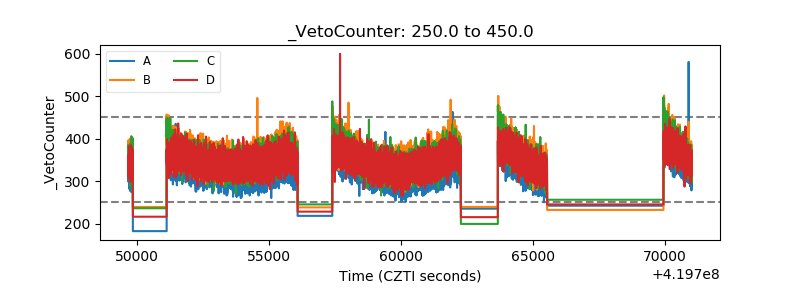 |