| Param | Original file | Final file |
|---|---|---|
| Filename | modeM0/AS1A12_097T01_9000005574_40890cztM0_level2.fits | modeM0/AS1A12_097T01_9000005574_40890cztM0_level2_quad_clean.evt |
| Size (bytes) | 391,662,720 | 84,061,440 |
| Size | 373.5 MB | 80.2 MB |
| Events in quadrant A | 2,719,042 | 571,696 |
| Events in quadrant B | 3,909,182 | 561,950 |
| Events in quadrant C | 2,575,097 | 562,949 |
| Events in quadrant D | 4,882,715 | 477,189 |
| Mode M9 | |||
|---|---|---|---|
| Quadrant | BADHDUFLAG | Total packets | Discarded packets |
| A | 0 | 16 | 0 |
| B | 0 | 16 | 0 |
| C | 0 | 16 | 0 |
| D | 0 | 16 | 0 |
| Mode SS | |||
|---|---|---|---|
| Quadrant | BADHDUFLAG | Total packets | Discarded packets |
| A | 0 | 110 | 0 |
| B | 0 | 110 | 0 |
| C | 0 | 110 | 0 |
| D | 0 | 110 | 0 |
| Mode M0 | |||
|---|---|---|---|
| Quadrant | BADHDUFLAG | Total packets | Discarded packets |
| A | 0 | 11337 | 2 |
| B | 0 | 15219 | 1 |
| C | 0 | 11140 | 1 |
| D | 0 | 18162 | 1 |
| Quadrant | Total seconds | Saturated seconds | Saturation percentage |
|---|---|---|---|
| A | 5294 | 13 | 0.245561% |
| B | 5294 | 381 | 7.196827% |
| C | 5294 | 30 | 0.566679% |
| D | 5294 | 547 | 10.332452% |
Noise dominated data is calculated using 1-second bins in cleaned event files. If a bin has >2000 counts, and if more than 50% of those come from <1% of pixels, then it is considered to be noise-dominated and hence unusable.
| Quadrant | # 1 sec bins | Bins with >0 counts | Bins with >2000 counts | High rate bins dominated by noise | Noise dominated (total time) | Noise dominated (detector-on time) | Marked lightcurve |
|---|---|---|---|---|---|---|---|
| A | 6937 | 5295 | 1 | 1 | 0.01% | 0.02% | 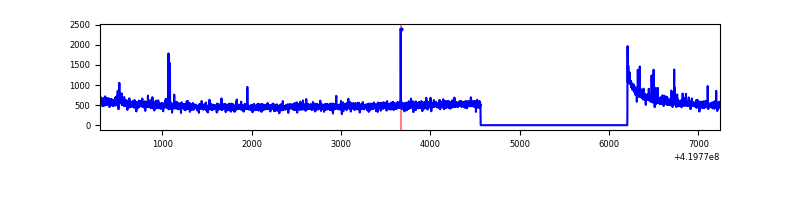 |
| B | 6937 | 5295 | 301 | 301 | 4.34% | 5.68% | 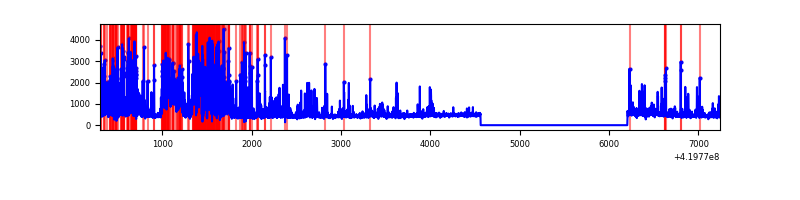 |
| C | 6937 | 5295 | 19 | 19 | 0.27% | 0.36% | 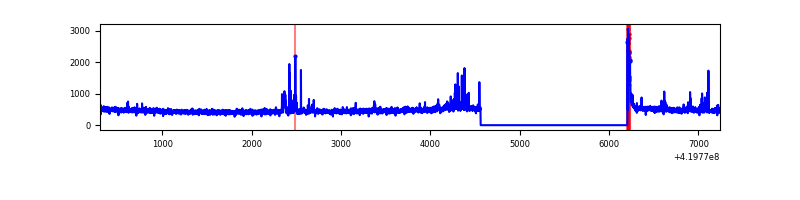 |
| D | 6937 | 5295 | 464 | 464 | 6.69% | 8.76% | 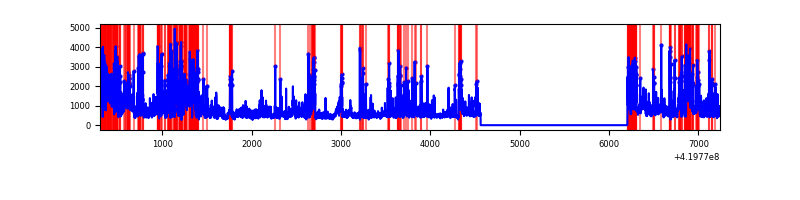 |
Top three noisy pixels from each quadrant. If the there are fewer than three noisy pixels in the level2.evt file, extra rows are filled as -1
| Pixel properties | Quadrant properties | ||||||
|---|---|---|---|---|---|---|---|
| Quadrant | DetID | PixID | Counts | Sigma | Mean | Median | Sigma |
| A | 10 | 83 | 457788 | 3898.35 | 569 | 558 | 117.3 |
| A | 13 | 248 | 34245 | 287.22 | 569 | 558 | 117.3 |
| A | 2 | 79 | 14279 | 116.99 | 569 | 558 | 117.3 |
| B | 5 | 255 | 1364907 | 12700.35 | 554 | 538 | 107.4 |
| B | 4 | 171 | 242030 | 2247.95 | 554 | 538 | 107.4 |
| B | 15 | 85 | 73000 | 674.52 | 554 | 538 | 107.4 |
| C | 15 | 214 | 220617 | 1668.84 | 558 | 562 | 131.9 |
| C | 14 | 254 | 103605 | 781.45 | 558 | 562 | 131.9 |
| C | 0 | 10 | 67707 | 509.21 | 558 | 562 | 131.9 |
| D | 12 | 233 | 767593 | 5809.28 | 535 | 521 | 132.0 |
| D | 12 | 79 | 735248 | 5564.32 | 535 | 521 | 132.0 |
| D | 2 | 249 | 716580 | 5422.94 | 535 | 521 | 132.0 |
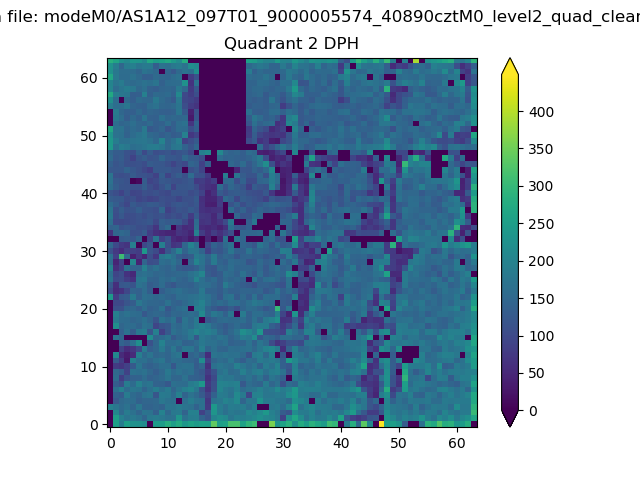
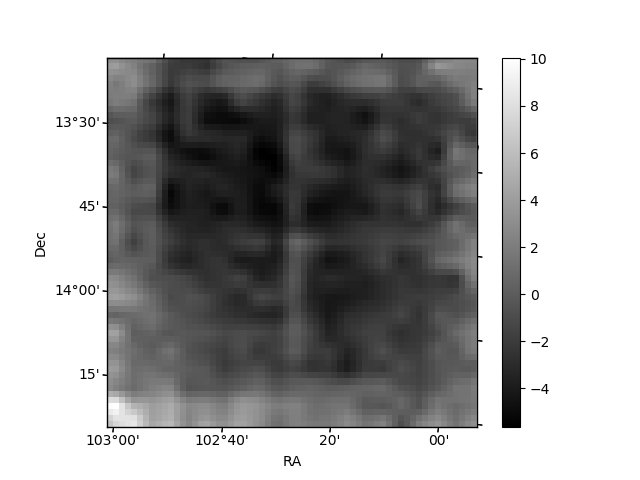
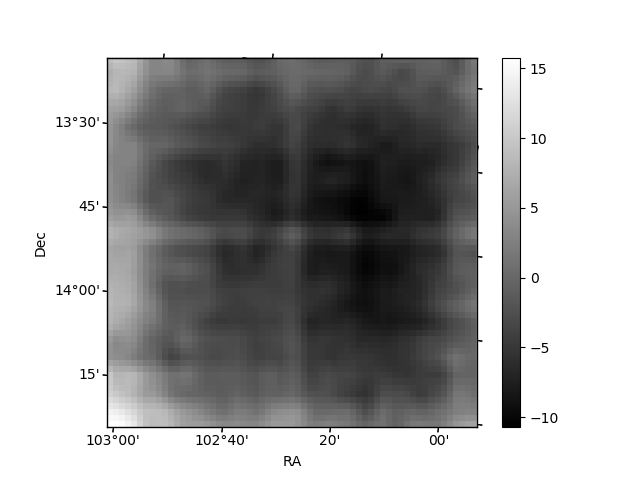
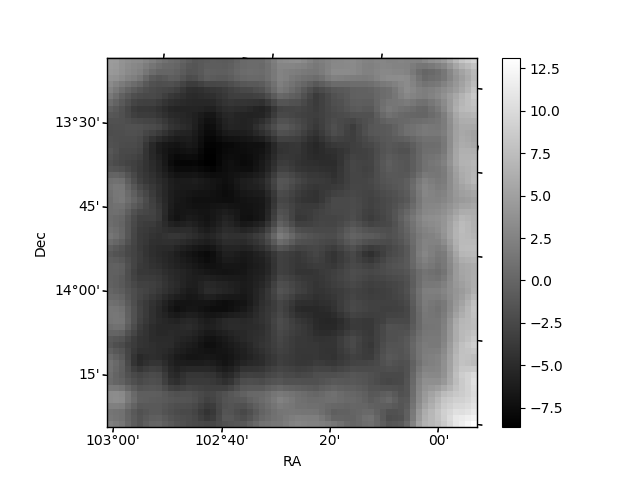
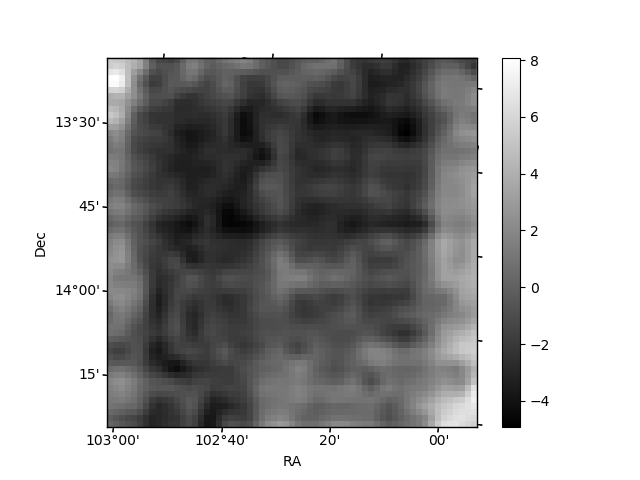
Histogram calculated using DETX and DETY for each event in the final _common_clean file
| Quadrant A | 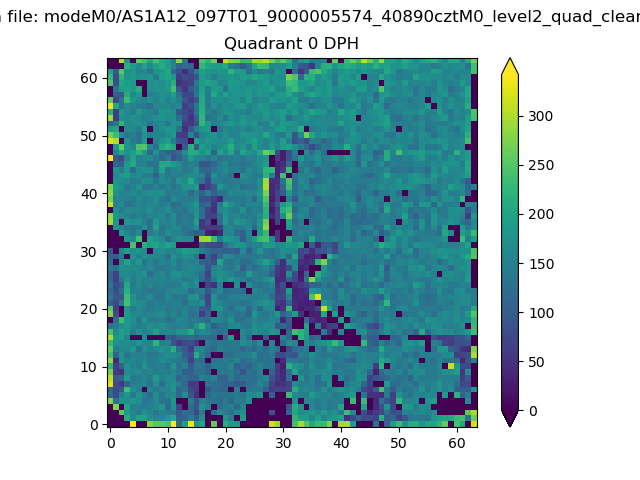 |
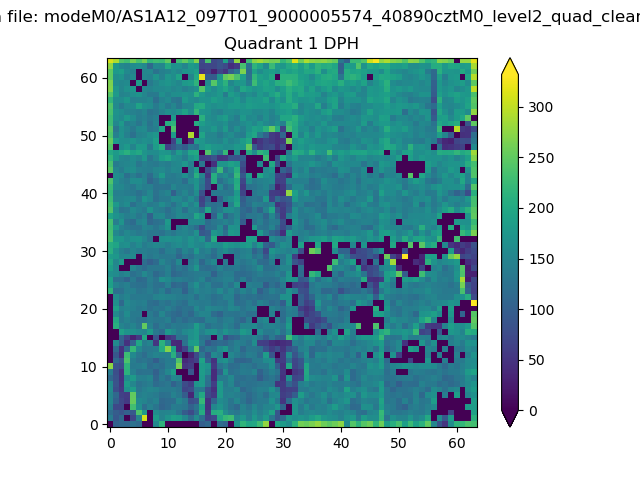 |
Quadrant B |
|---|---|---|---|
| Quadrant D | 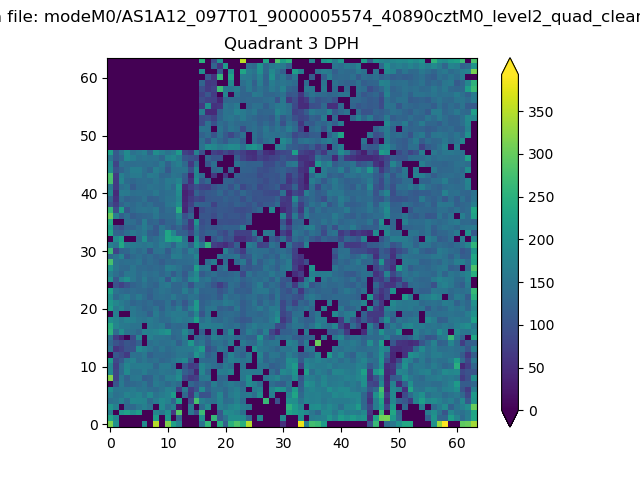 |
 |
Quadrant C |
| Plot type | Count rate plots | Images |
|---|---|---|
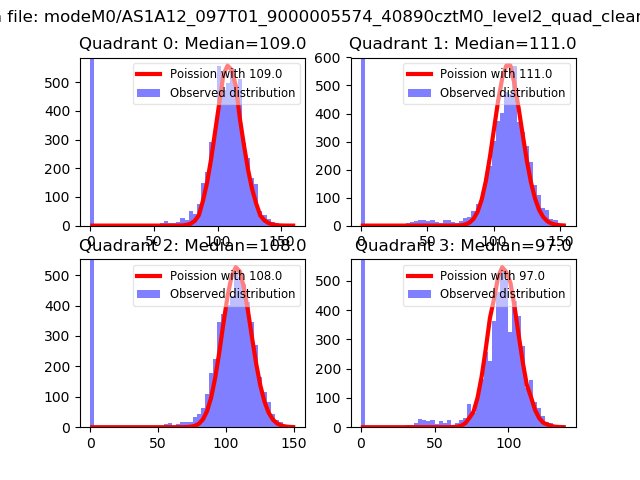
| Comparison with Poisson distribution Blue bars denote a histogram of data divided into 1 sec bins. Red curve is a Poisson curve with rate = median count rate of data. |
 |
 |
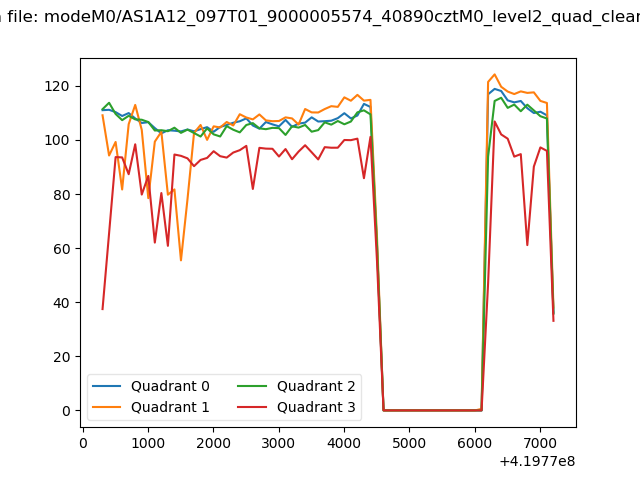
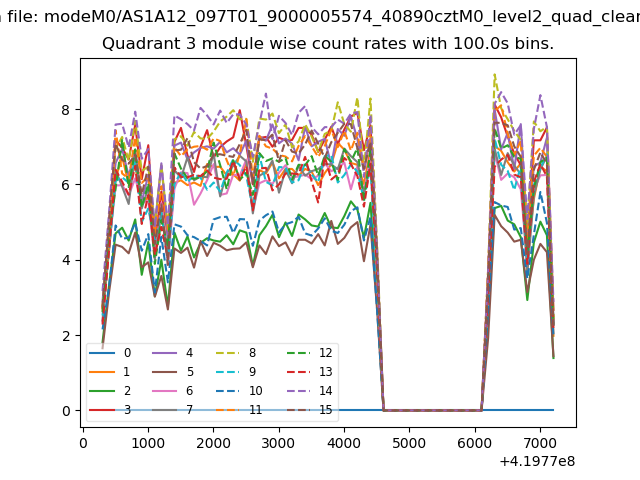
| Quadrant-wise count rates Data is divided into 100 sec bins |
 |
|
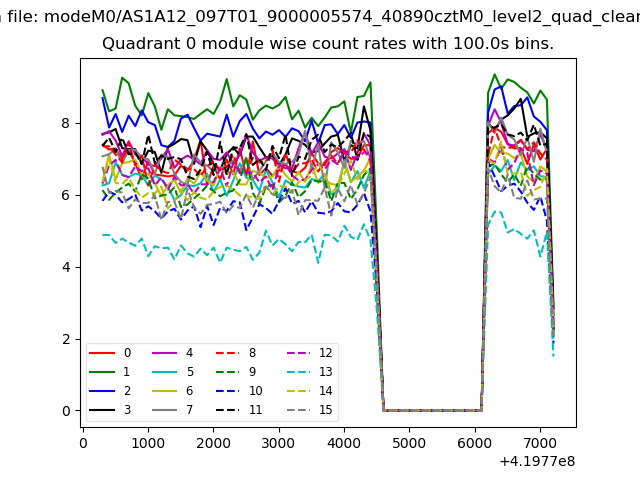
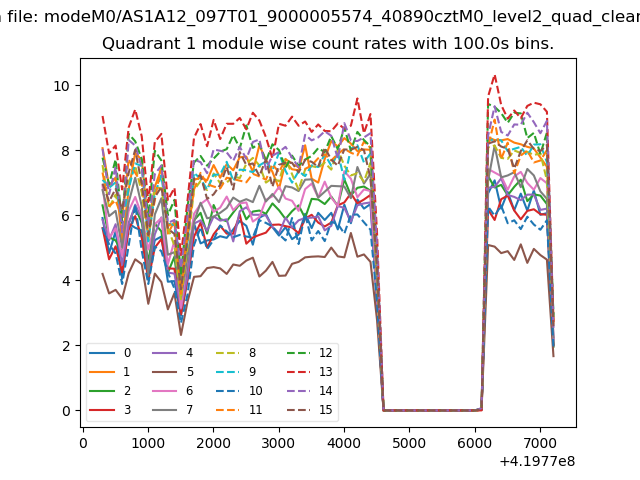
| Module-wise count rates for Quadrant A Data is divided into 100 sec bins |
 |
 |
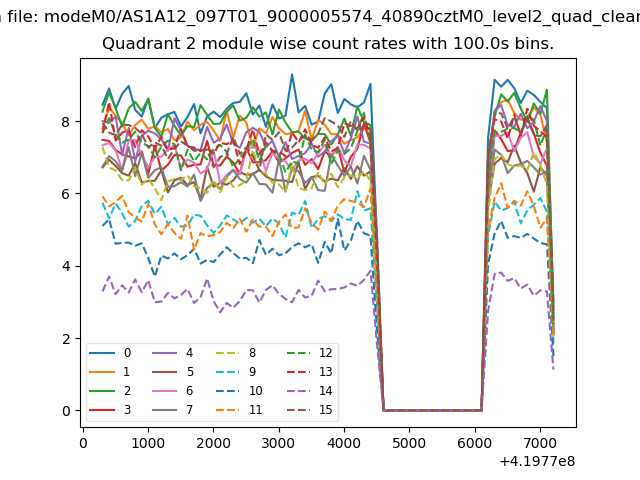
| Module-wise count rates for Quadrant B Data is divided into 100 sec bins |
 |
 |
| Module-wise count rates for Quadrant C Data is divided into 100 sec bins |
 |
 |
| Module-wise count rates for Quadrant D Data is divided into 100 sec bins |
 |
 |
| Parameter | Plot |
|---|---|
| CZT HV Monitor | 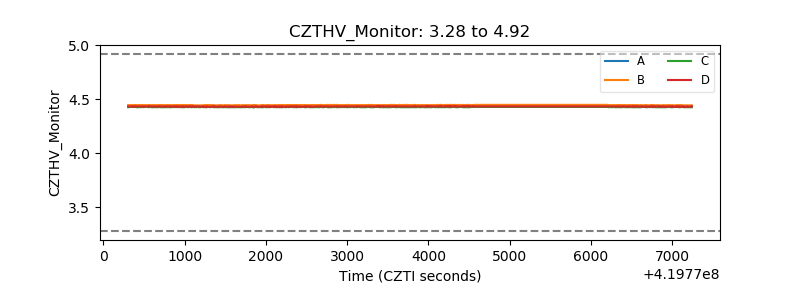 |
| D_VDD | 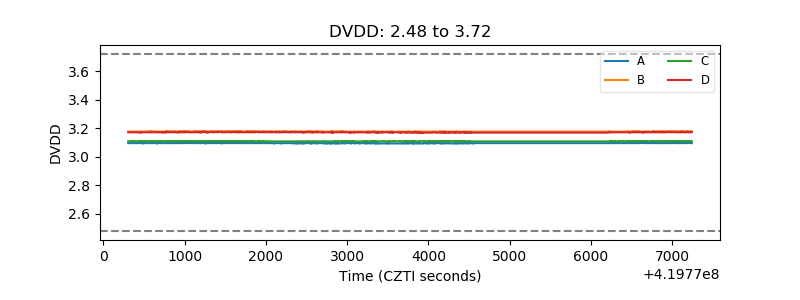 |
| Temperature 1 | 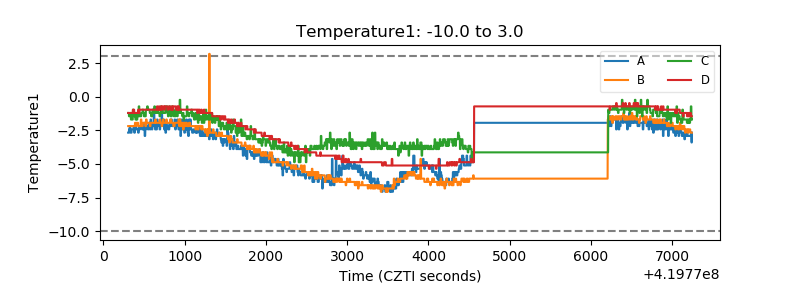 |
| Veto HV Monitor | 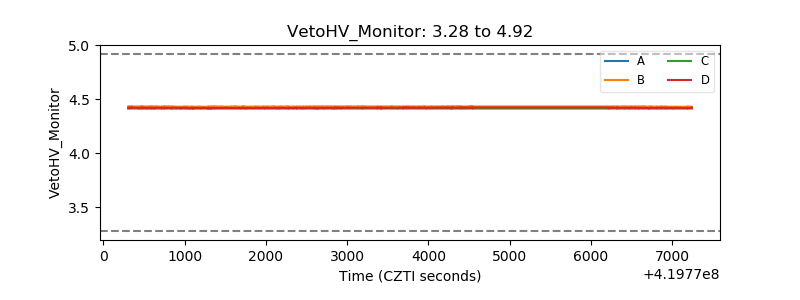 |
| Veto LLD | 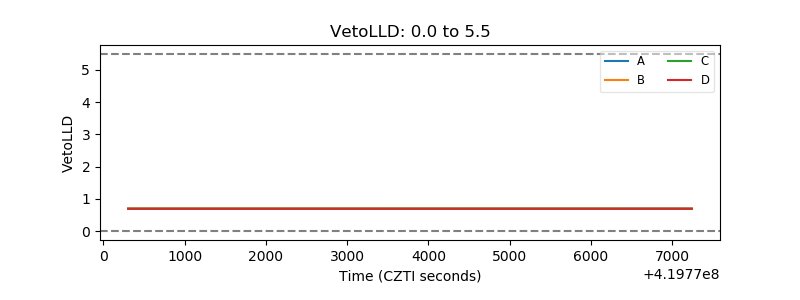 |
| Alpha Counter | 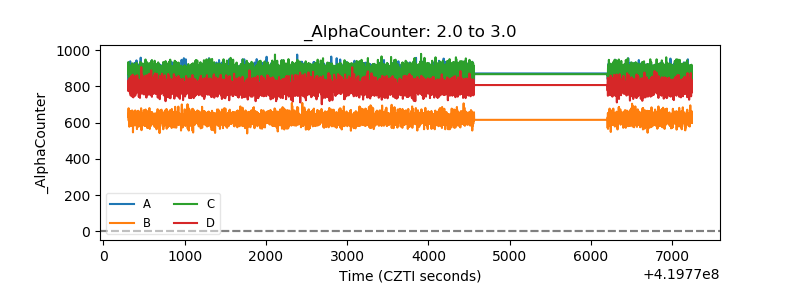 |
| _CPM_Rate | 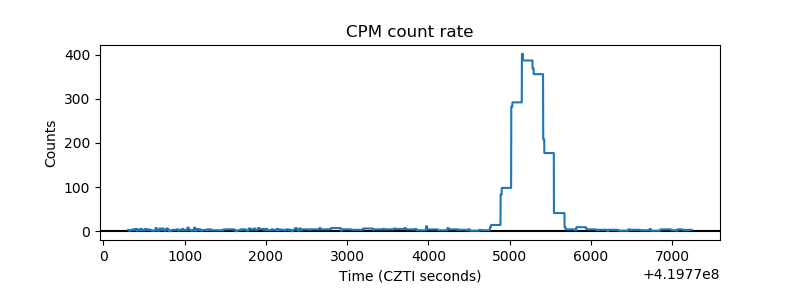 |
| CZT Counter |  |
| +2.5 Volts monitor | 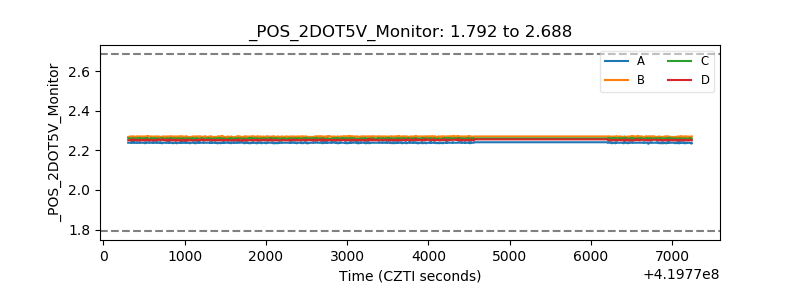 |
| +5 Volts monitor | 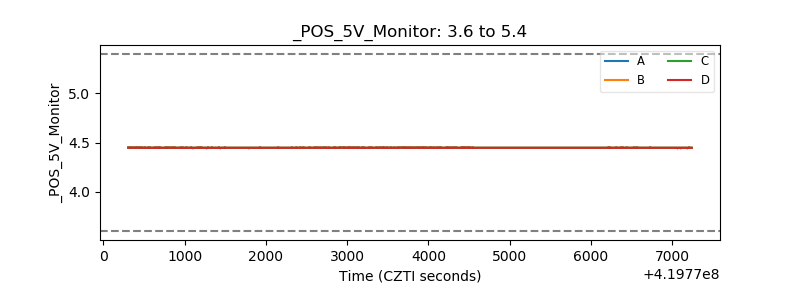 |
| _ROLL_ROT | 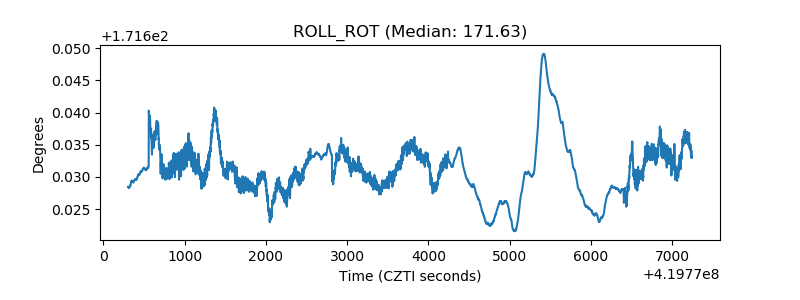 |
| _Roll_DEC | 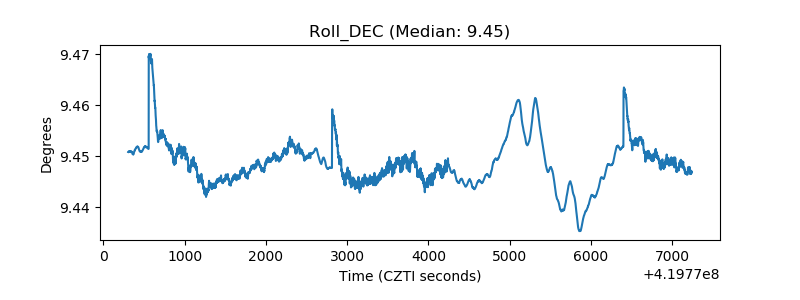 |
| _Roll_RA | 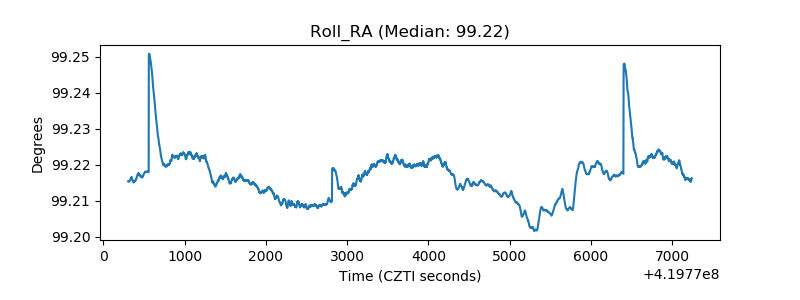 |
| Veto Counter | 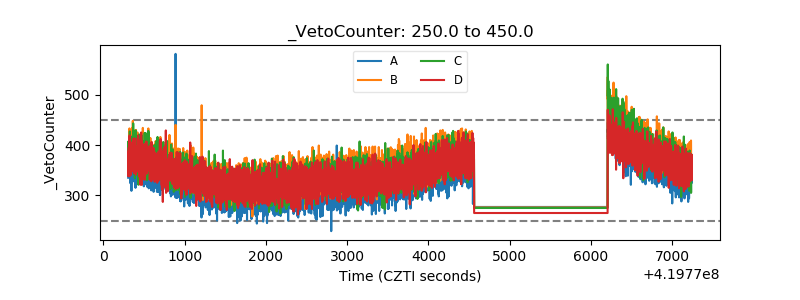 |